
Explain regulations of gene expression in prokaryotic giving the example of lac operon and trp operon
lac operon regulation gene expression prokaryote
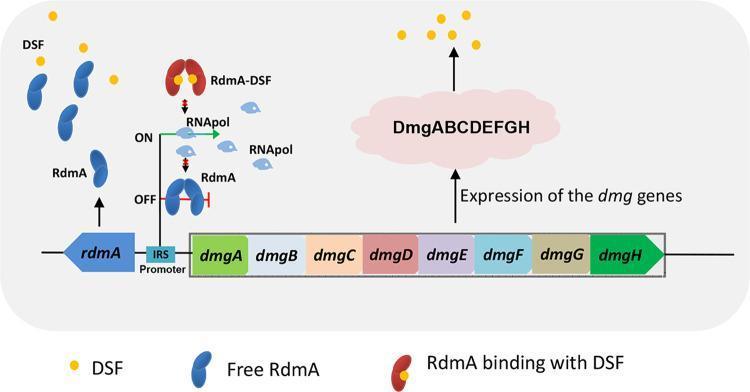
This pathophysiology diagram illustrates the regulatory mechanism of the dmg gene cluster via the Diffusible Signaling Factor (DSF) positive feedback mechanism in bacterial cell signaling. The diagram depicts a genetic locus containing the 'rdmA' gene upstream of an 'IRS Promoter', followed by a downstream operon containing 'dmgA-H' genes. The visual logic demonstrates two states of transcriptional regulation: an 'OFF' state where free RdmA dimers (blue bean-shaped structures) bind to the IRS promoter to repress transcription, and an 'ON' state triggered by the quorum-sensing signal DSF (yellow dots). In the presence of DSF, RdmA binds to the signaling molecules to form a 'RdmA-DSF' complex (two-lobed reddish structure), which prevents the regulator from binding to the promoter. This dissociation allows RNA polymerase (RNApol) to initiate the expression of the dmg genes (dmgA through dmgH), leading to the production of the DmgABCDEFGH enzyme complex responsible for DSF degradation. This model highlights a transcriptional repression-induction system essential for bacterial quorum quenching and metabolic signaling.
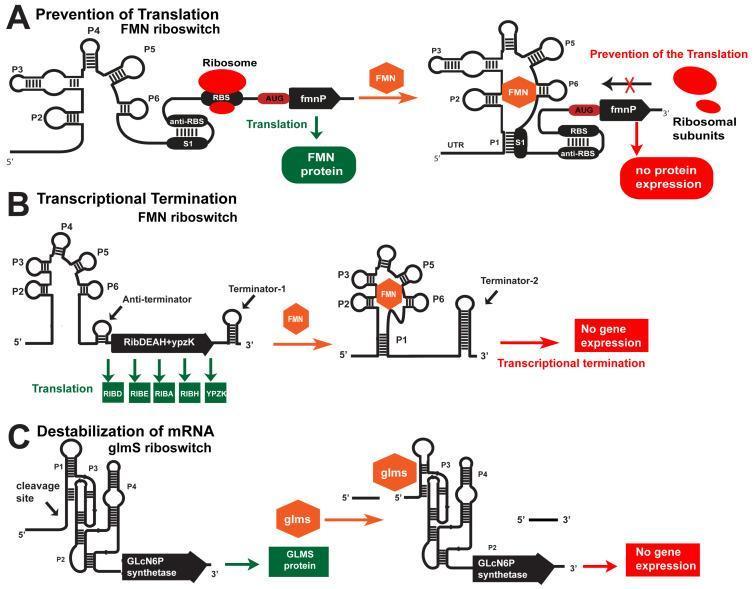
A comprehensive pathophysiology diagram illustrating three cis-acting riboswitch mechanisms for bacterial gene regulation. Section A (Prevention of Translation) depicts the FMN riboswitch; in the absence of FMN, the Ribosome Binding Site (RBS) is accessible for translation of the fmnP gene. In the presence of FMN, the metabolite binds the aptamer domain, causing P1 stem formation and anti-RBS hybridization with the RBS, blocking ribosomal subunits and preventing protein expression. Section B (Transcriptional Termination) shows the ribD operon; low FMN levels allow for an anti-terminator structure and full polycistronic mRNA transcription (RIBD-YPZK). High FMN levels trigger Terminator-2 formation via P1 stabilization, resulting in premature transcriptional termination and no gene expression. Section C (Destabilization of mRNA) illustrates the glmS ribozyme; absence of glucosamine-6-phosphate (glmS) allows GLMS synthetase expression, while ligand binding induces ribozyme self-cleavage at a specific site, destabilizing the mRNA and silencing gene expression. These mechanisms represent potential targets for novel antibacterial agents.
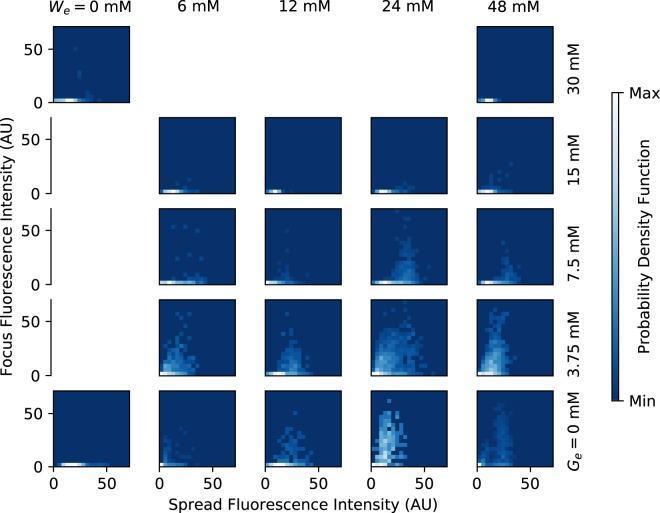
A medical research graphic presenting a grid of 2D probability density function (PDF) plots that illustrate the expression of the tna operon in Escherichia coli. The plots compare single-cell fluorescence patterns across varying environmental conditions: tryptophan concentration (We: 0 to 48 mM) along the horizontal axis and glucose concentration (Ge: 0 to 30 mM) along the vertical axis. Each individual plot displays 'Spread Fluorescence Intensity' (dispersed TnaA enzymes) on the x-axis and 'Focus Fluorescence Intensity' (inactive TnaA foci) on the y-axis, both measured in arbitrary units (0-50 AU). The probability density is represented by a blue-to-white color gradient, with lighter shades indicating higher density. The visualization demonstrates that higher tryptophan levels induce increased fluorescence (gene expression) and shifts in protein localization between dispersed and foci states, while increasing glucose concentrations suppress this induction via catabolite repression. This educational diagram is used to analyze post-translational regulation and phenotypic heterogeneity in bacterial populations.
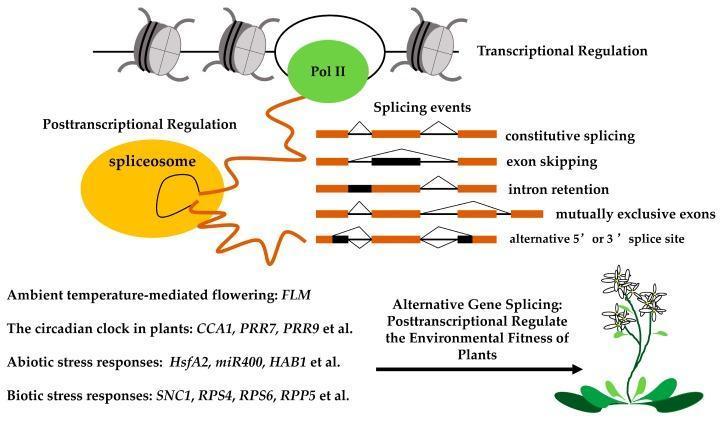
This pathophysiology diagram illustrates the process of gene expression regulation, focusing on co-transcriptional and post-transcriptional mechanisms common in eukaryotic molecular biology. The top section depicts transcriptional regulation, showing DNA wound around histones and RNA Polymerase II (Pol II) synthesizing a pre-mRNA strand. Below this, the post-transcriptional regulation stage is highlighted, where the spliceosome (a large ribonucleoprotein complex) processes the pre-mRNA strand. The diagram catalogs five distinct alternative splicing events: constitutive splicing, exon skipping, intron retention, mutually exclusive exons, and alternative 5' or 3' splice sites. Each event is visually represented by differences in exon (orange block) and intron (black block/line) arrangements, demonstrating how a single gene can produce multiple mRNA isoforms. The educational focus connects these molecular processes to biological adaptations, such as environmental fitness, circadian clock regulation (e.g., CCA1, PRR7), and stress responses (e.g., HsfA2, SNC1). The clinical relevance lies in understanding fundamental genetic regulation mechanisms that govern cellular responses to external stimuli.
trp operon tryptophan repressor attenuation regulation
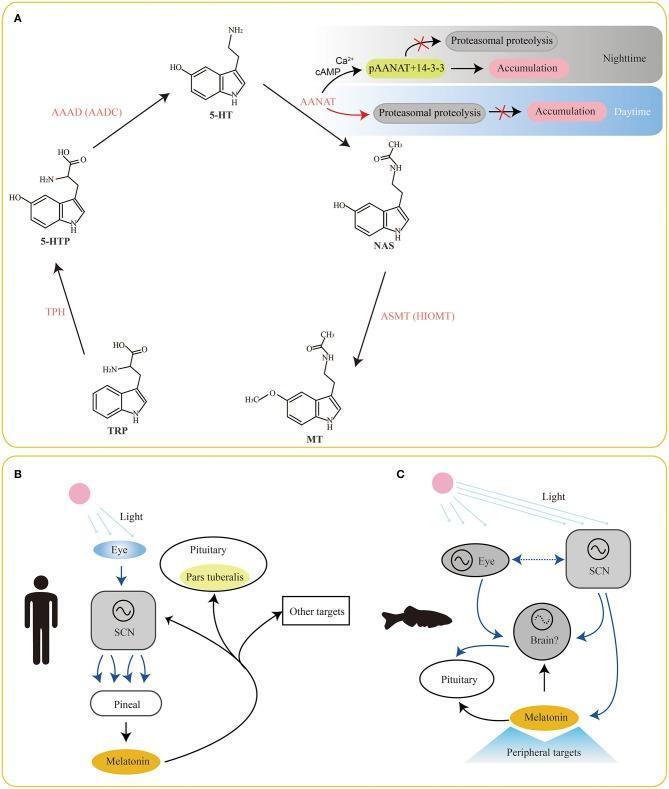
Educational diagram illustrating the biochemical and physiological pathways of melatonin in vertebrates. Panel A displays the enzymatic biosynthesis pathway: Tryptophan (TRP) is hydroxylated by Tryptophan Hydroxylase (TPH) to 5-Hydroxytryptophan (5-HTP), converted to Serotonin (5-HT) by Aromatic L-Amino Acid Decarboxylase (AAAD/AADC), then to N-Acetylserotonin (NAS) by Aralkylamine N-Acetyltransferase (AANAT), and finally to Melatonin (MT) by Acetylserotonin O-Methyltransferase (ASMT/HIOMT). It also highlights circadian regulation of AANAT via phosphorylation (pAANAT) and 14-3-3 protein binding, which protects the enzyme from proteasomal proteolysis during nighttime. Panel B shows the human/mammalian circadian system: light perceived by the eye signals the suprachiasmatic nucleus (SCN), which regulates the pineal gland's melatonin secretion, subsequently affecting the pituitary (pars tuberalis) and other targets. Panel C contrasts this with the fish circadian system, featuring direct photoreception by the pineal organ and complex signaling between the eye, SCN, brain, and pituitary. This resource is designed for physiology and endocrinology students to understand neurohormonal regulation and comparative anatomy.
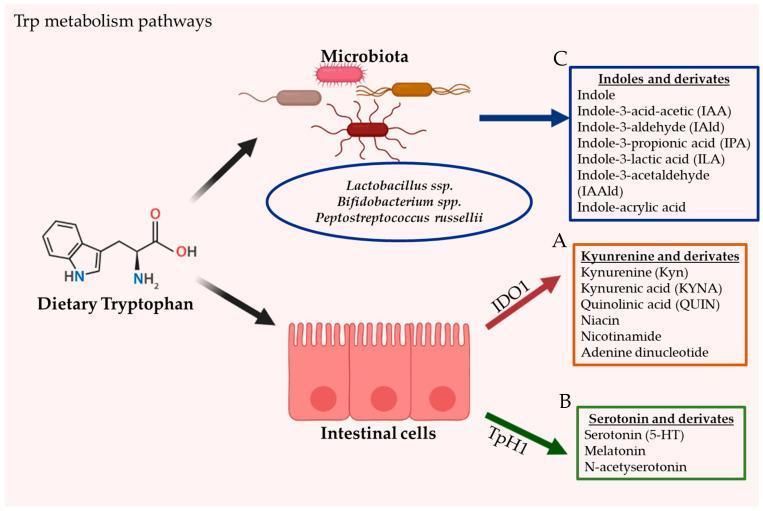
A pathophysiology diagram illustrating the three primary metabolic pathways of dietary tryptophan (Trp) within the gastrointestinal tract. The diagram begins with the chemical structure of dietary tryptophan, which is processed via three distinct routes: (A) The Kynurenine pathway (KP), occurring in intestinal cells (epithelial/immune cells) via the enzyme indoleamine 2,3-dioxygenase 1 (IDO1), resulting in kynurenine (Kyn), kynurenic acid (KYNA), quinolinic acid (QUIN), niacin, nicotinamide, and adenine dinucleotide. (B) The Serotonin production pathway, occurring in intestinal enterochromaffin cells via tryptophan hydroxylase 1 (TpH1), leading to serotonin (5-HT), melatonin, and N-acetylserotonin. (C) The direct conversion by gut microbiota (including Lactobacillus ssp., Bifidobacterium spp., and Peptostreptococcus russellii) into various indoles and derivatives such as Indole-3-acetic acid (IAA), Indole-3-aldehyde (IAld), and Indole-propionic acid (IPA). This diagram serves as a medical educational resource for understanding the interplay between diet, host enzymes, and the microbiome in human metabolic signaling.
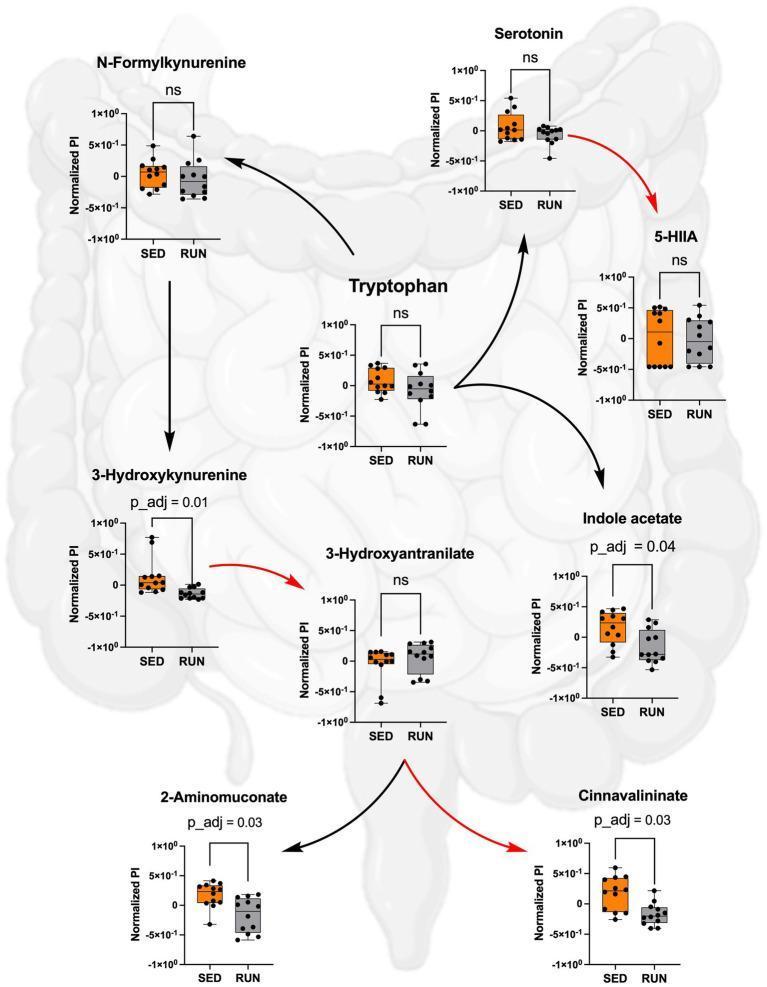
This pathophysiology diagram illustrates the metabolic pathways of Tryptophan (TRP) in the gut, comparing Sedentary (SED) and Running (RUN) experimental groups. The visual integrates a biochemical flowchart with individual bar plots for key metabolites, set against an anatomical background of the intestinal tract. The central TRP node branches into three primary pathways: the kynurenine pathway (leading to N-Formylkynurenine, 3-Hydroxykynurenine, 2-Aminomuconate, and 3-Hydroxyantranilate), the serotonin pathway (leading to Serotonin and 5-HIIA), and the indole pathway (leading to Indole acetate and Cinnavalininate). Each metabolite is accompanied by a normalized peak intensity (PI) box plot. Red arrows denote direct conversions, while black arrows indicate multi-step pathways. Statistically significant decreases in the RUN group (indicated by p_adj < 0.05) are observed for 3-Hydroxykynurenine, 2-Aminomuconate, Indole acetate, and Cinnavalininate. TRP, Serotonin, 5-HIIA, and 3-Hydroxyantranilate show no significant (ns) change. This image demonstrates the impact of physical exercise on gut microbial metabolism and neuroactive metabolite homeostasis.
Regulation of Gene Expression in Prokaryotes
Overview
A. The Operon Model
| Element | Location | Function |
|---|---|---|
| Promoter | Upstream of operator | Binding site for RNA polymerase |
| Operator | Between promoter and structural genes | Binding site for repressor protein |
| Structural genes | Downstream | Encode the functional proteins |
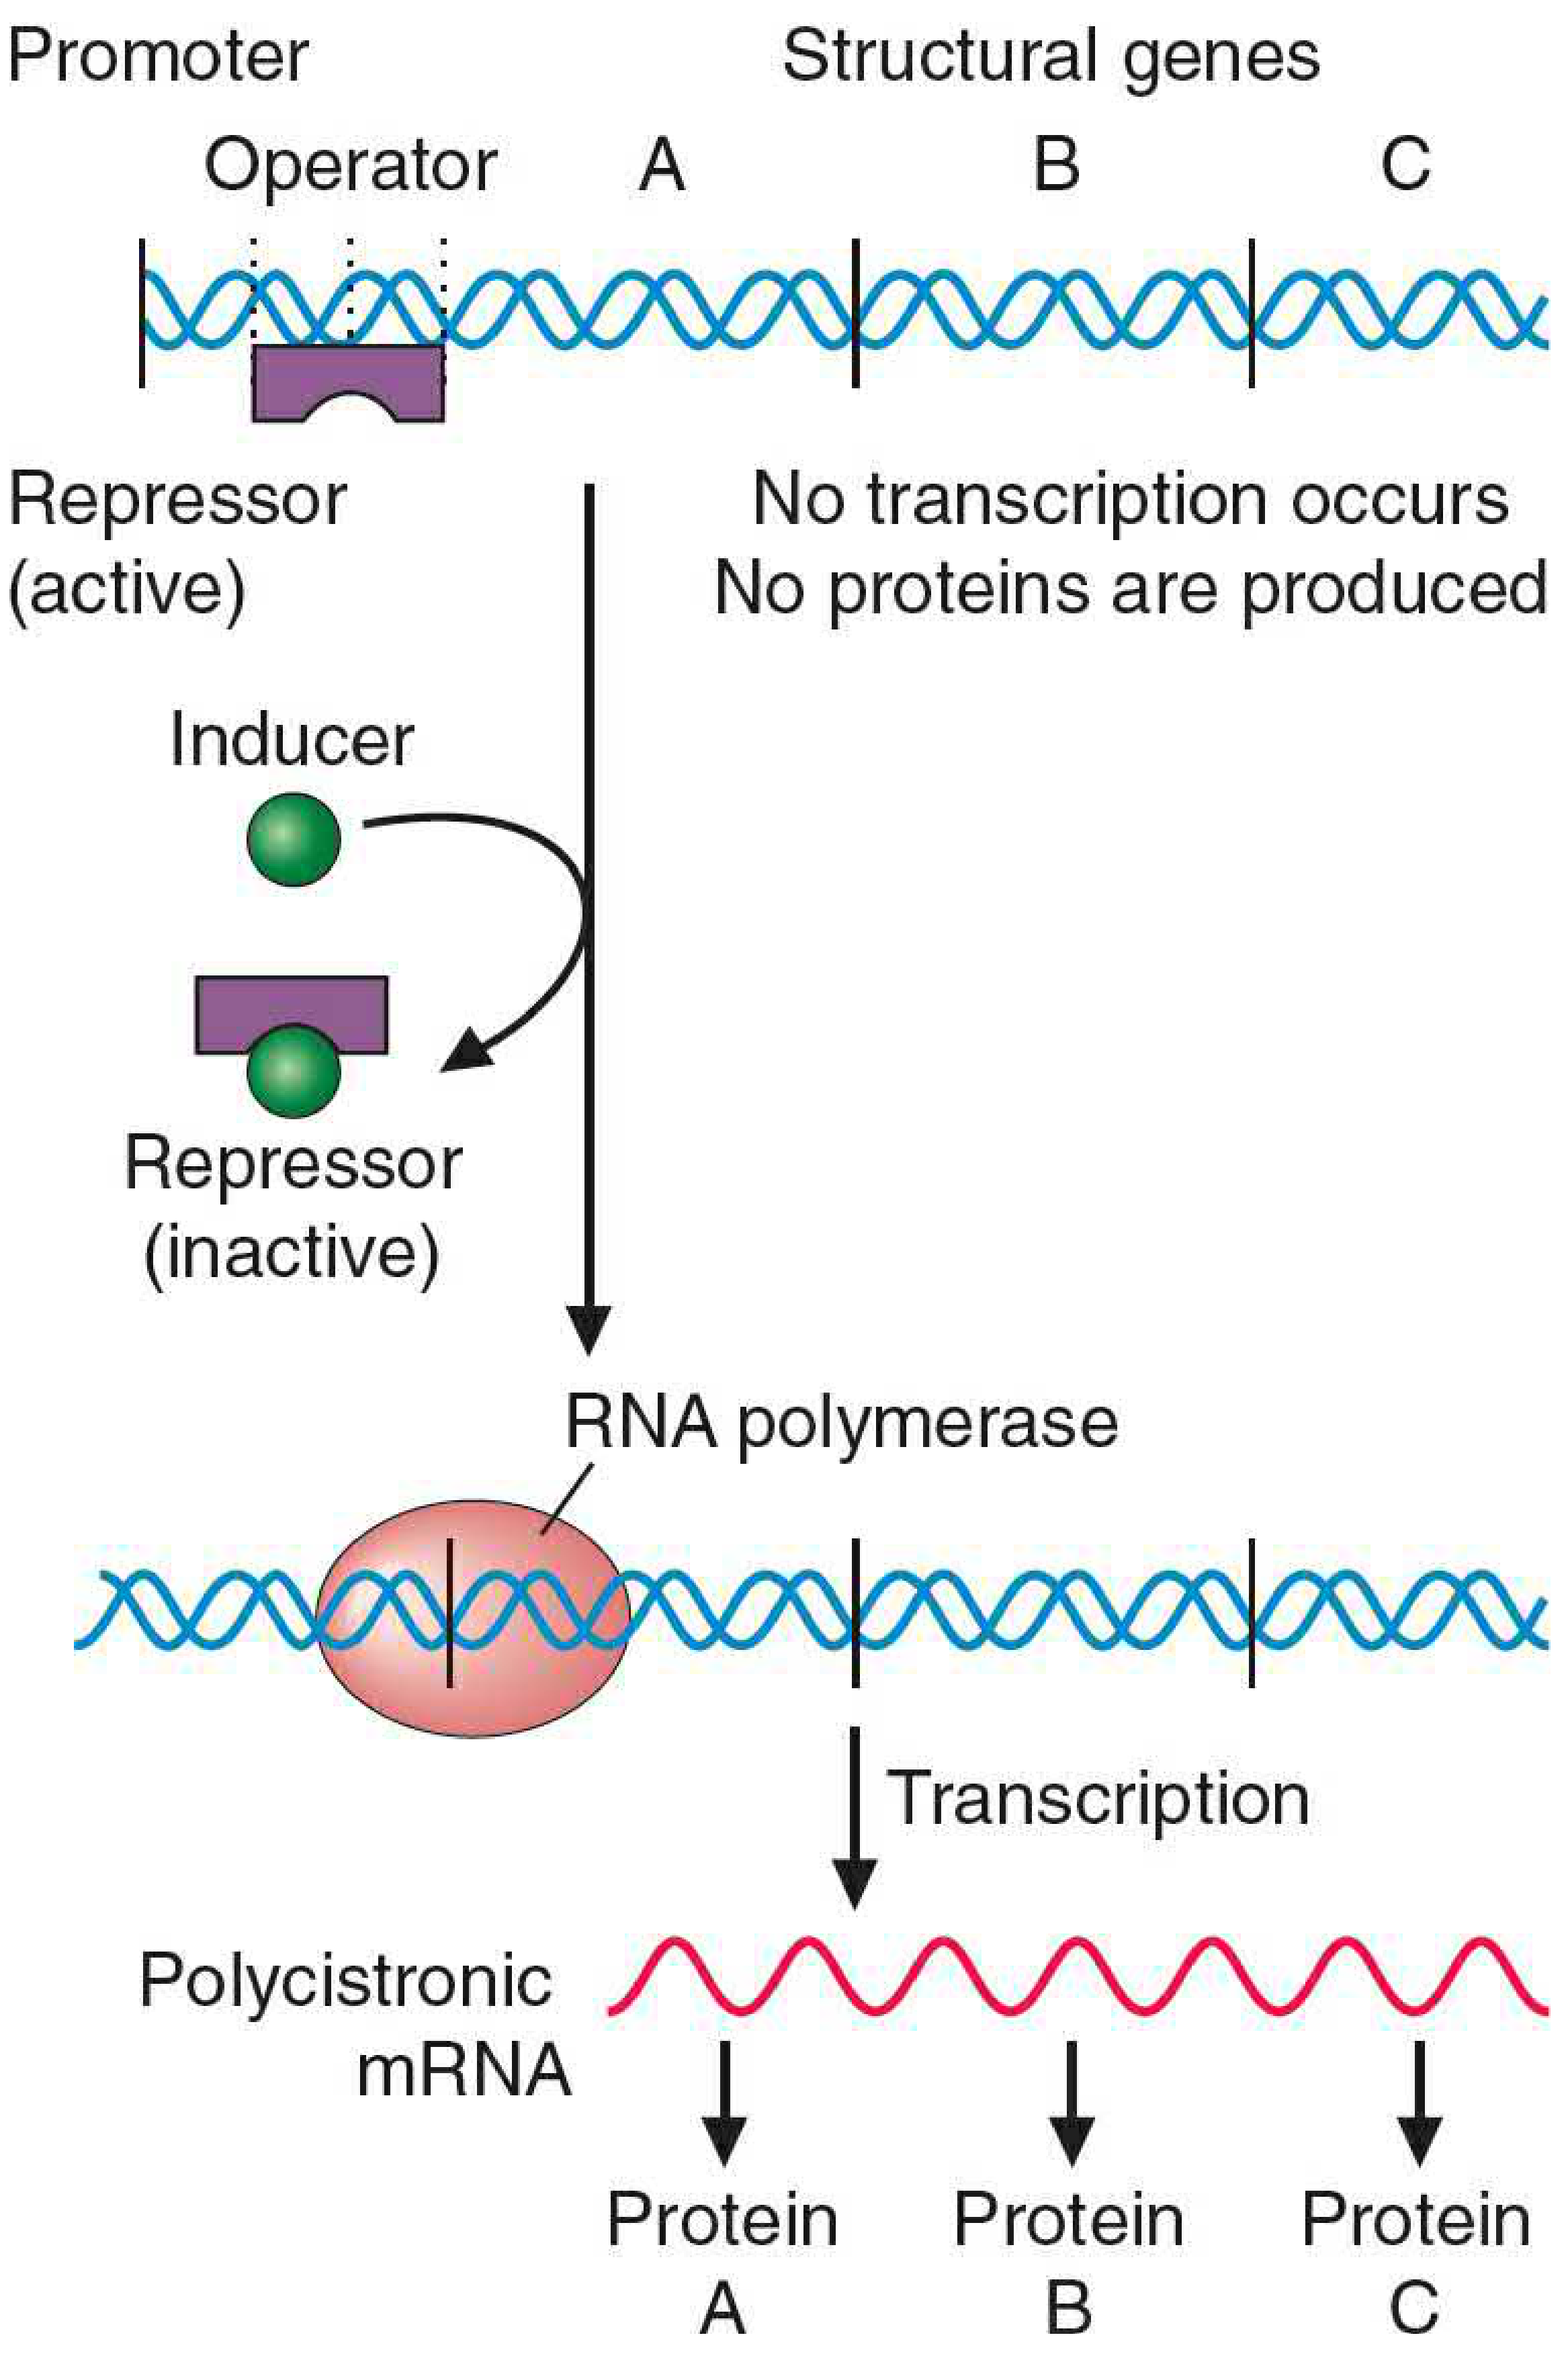
B. Two Types of Negative Control
1. Inducible Systems (substrate available → genes turned ON)
- Repressor is active by default and blocks the operator
- An inducer (a substrate or its metabolite) binds the repressor, inactivating it
- RNA polymerase can now bind the promoter and transcribe the genes
- Example: lac operon
2. Repressible Systems (end product available → genes turned OFF)
- Repressor is inactive by default
- A corepressor (the end product) binds the inactive repressor, activating it
- The repressor-corepressor complex then blocks the operator
- Example: trp operon
The lac Operon (Inducible System)
Structure
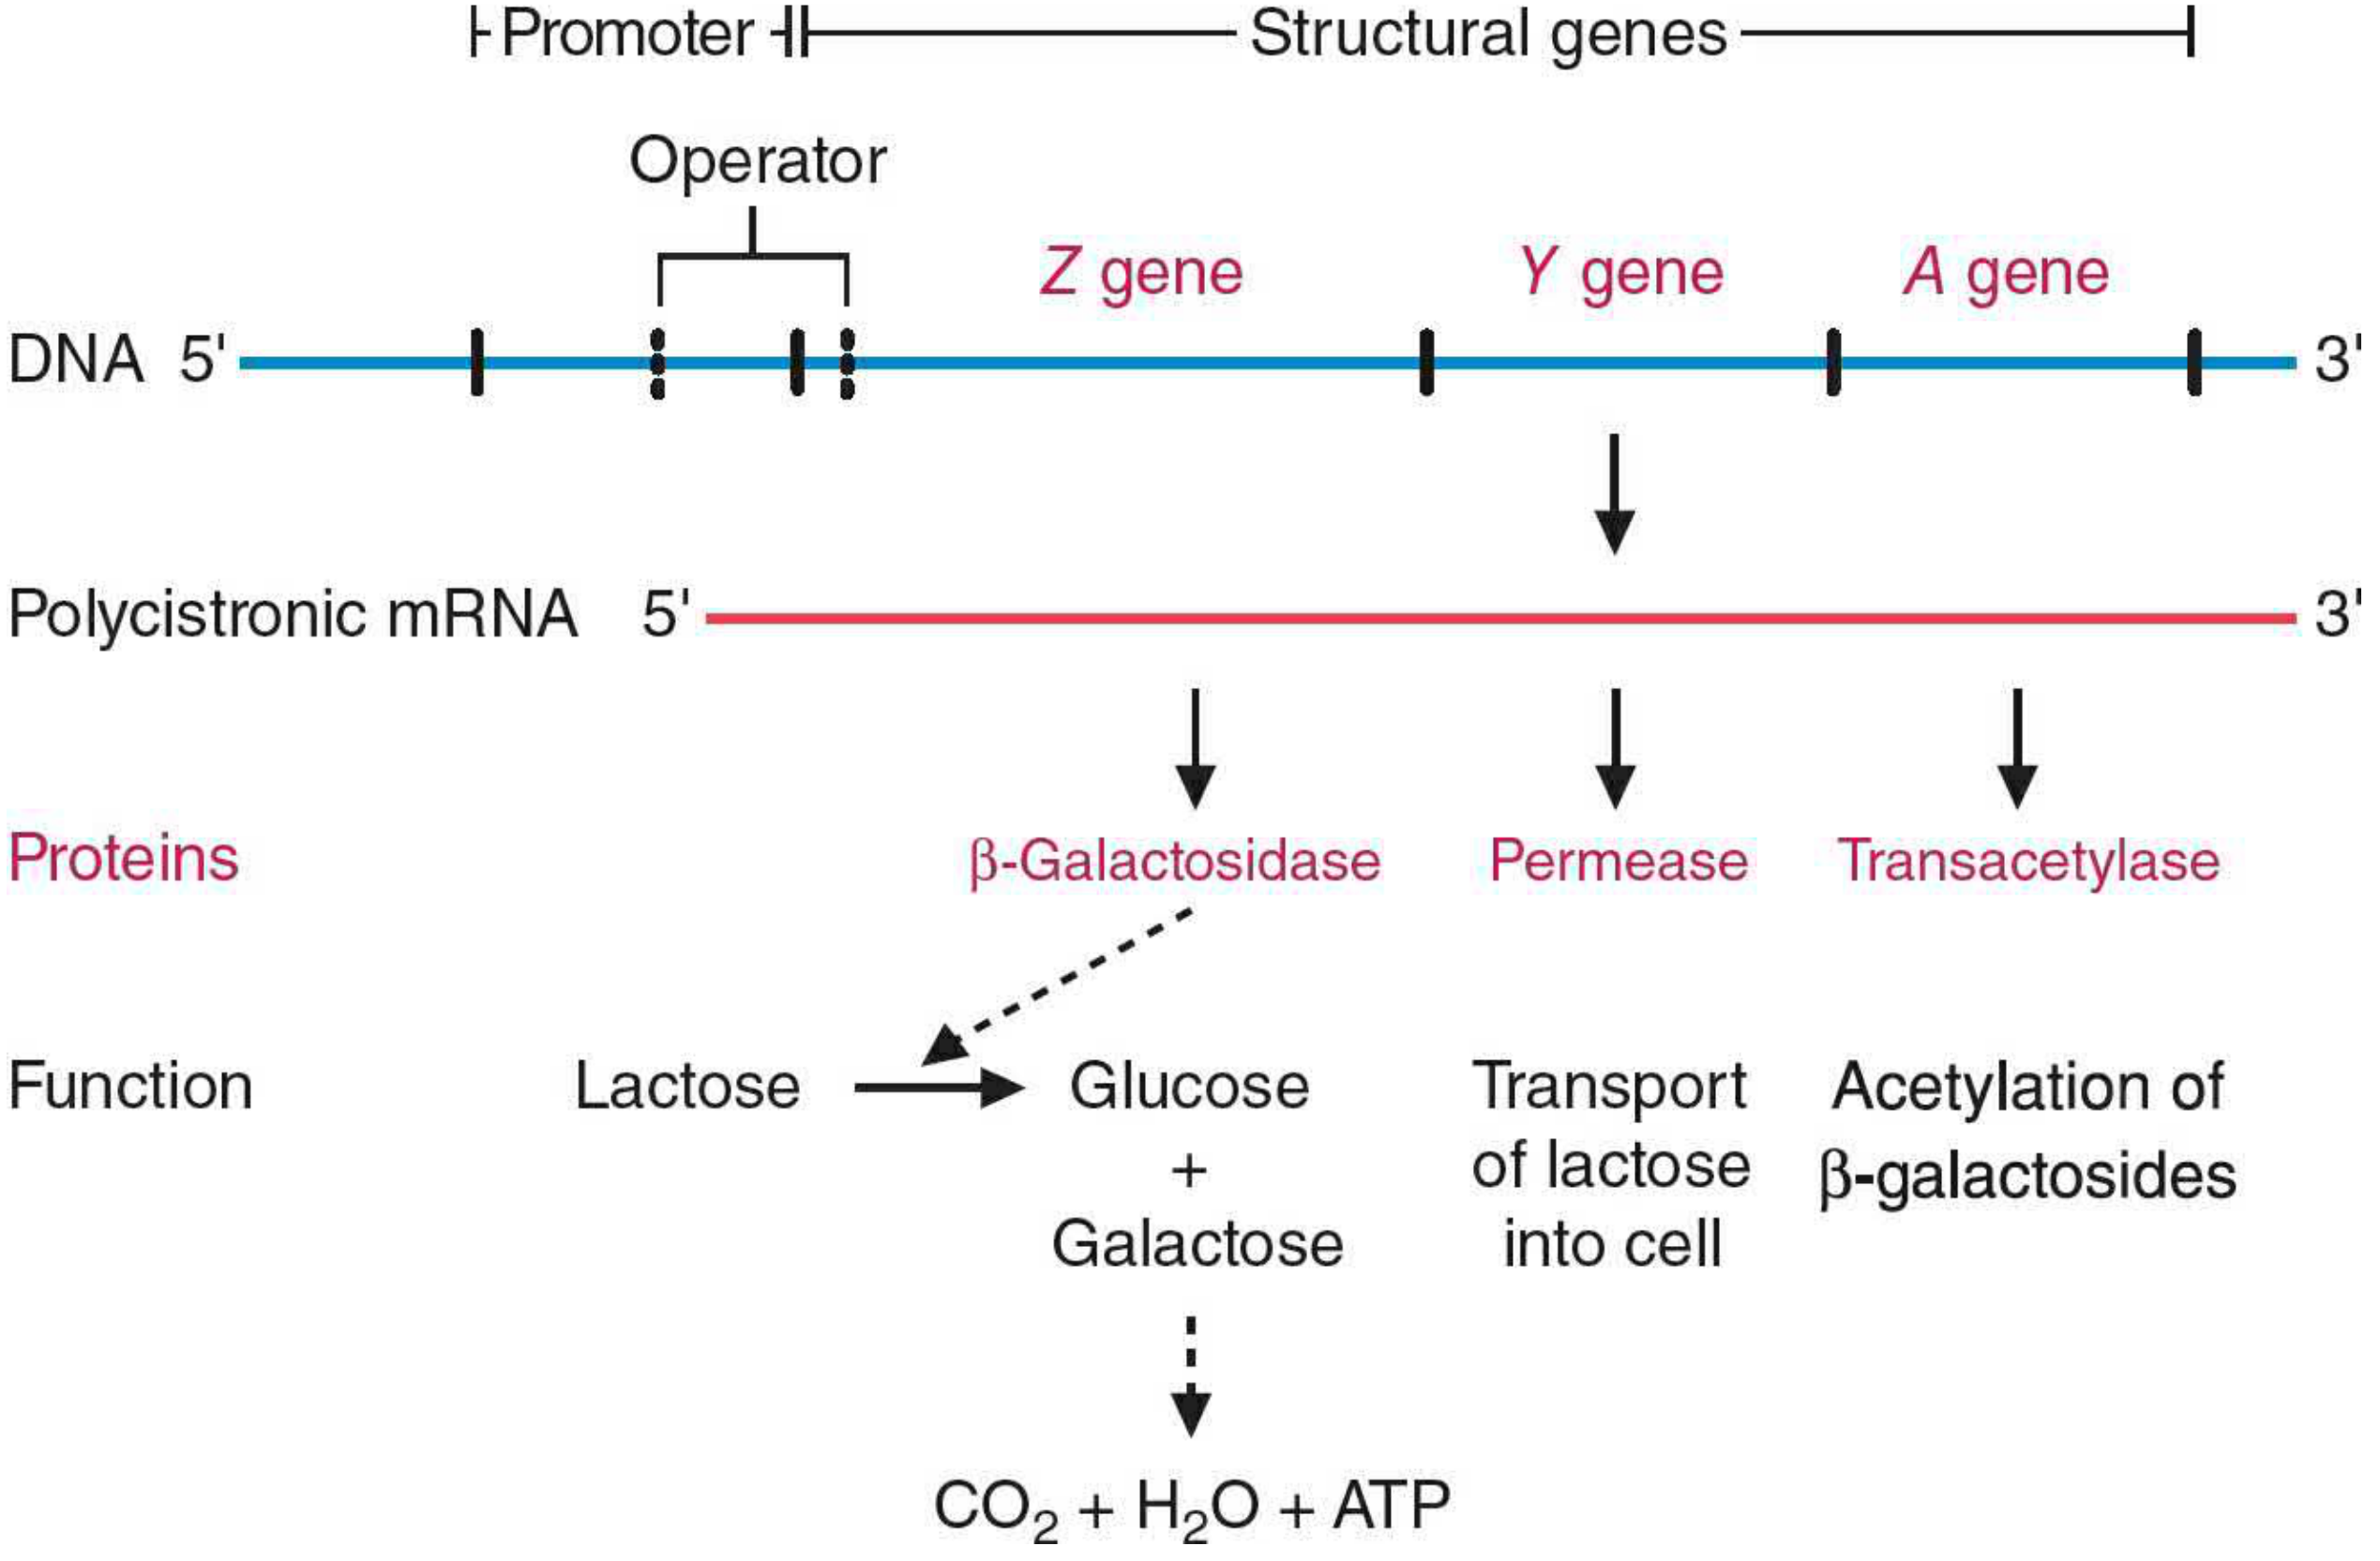
| Gene | Protein | Function |
|---|---|---|
| lacZ | β-Galactosidase | Hydrolyzes lactose → glucose + galactose |
| lacY | Permease | Transports lactose into the cell |
| lacA | Transacetylase | Acetylates β-galactosides (function unclear) |
Negative Control: Repressor-Inducer Mechanism
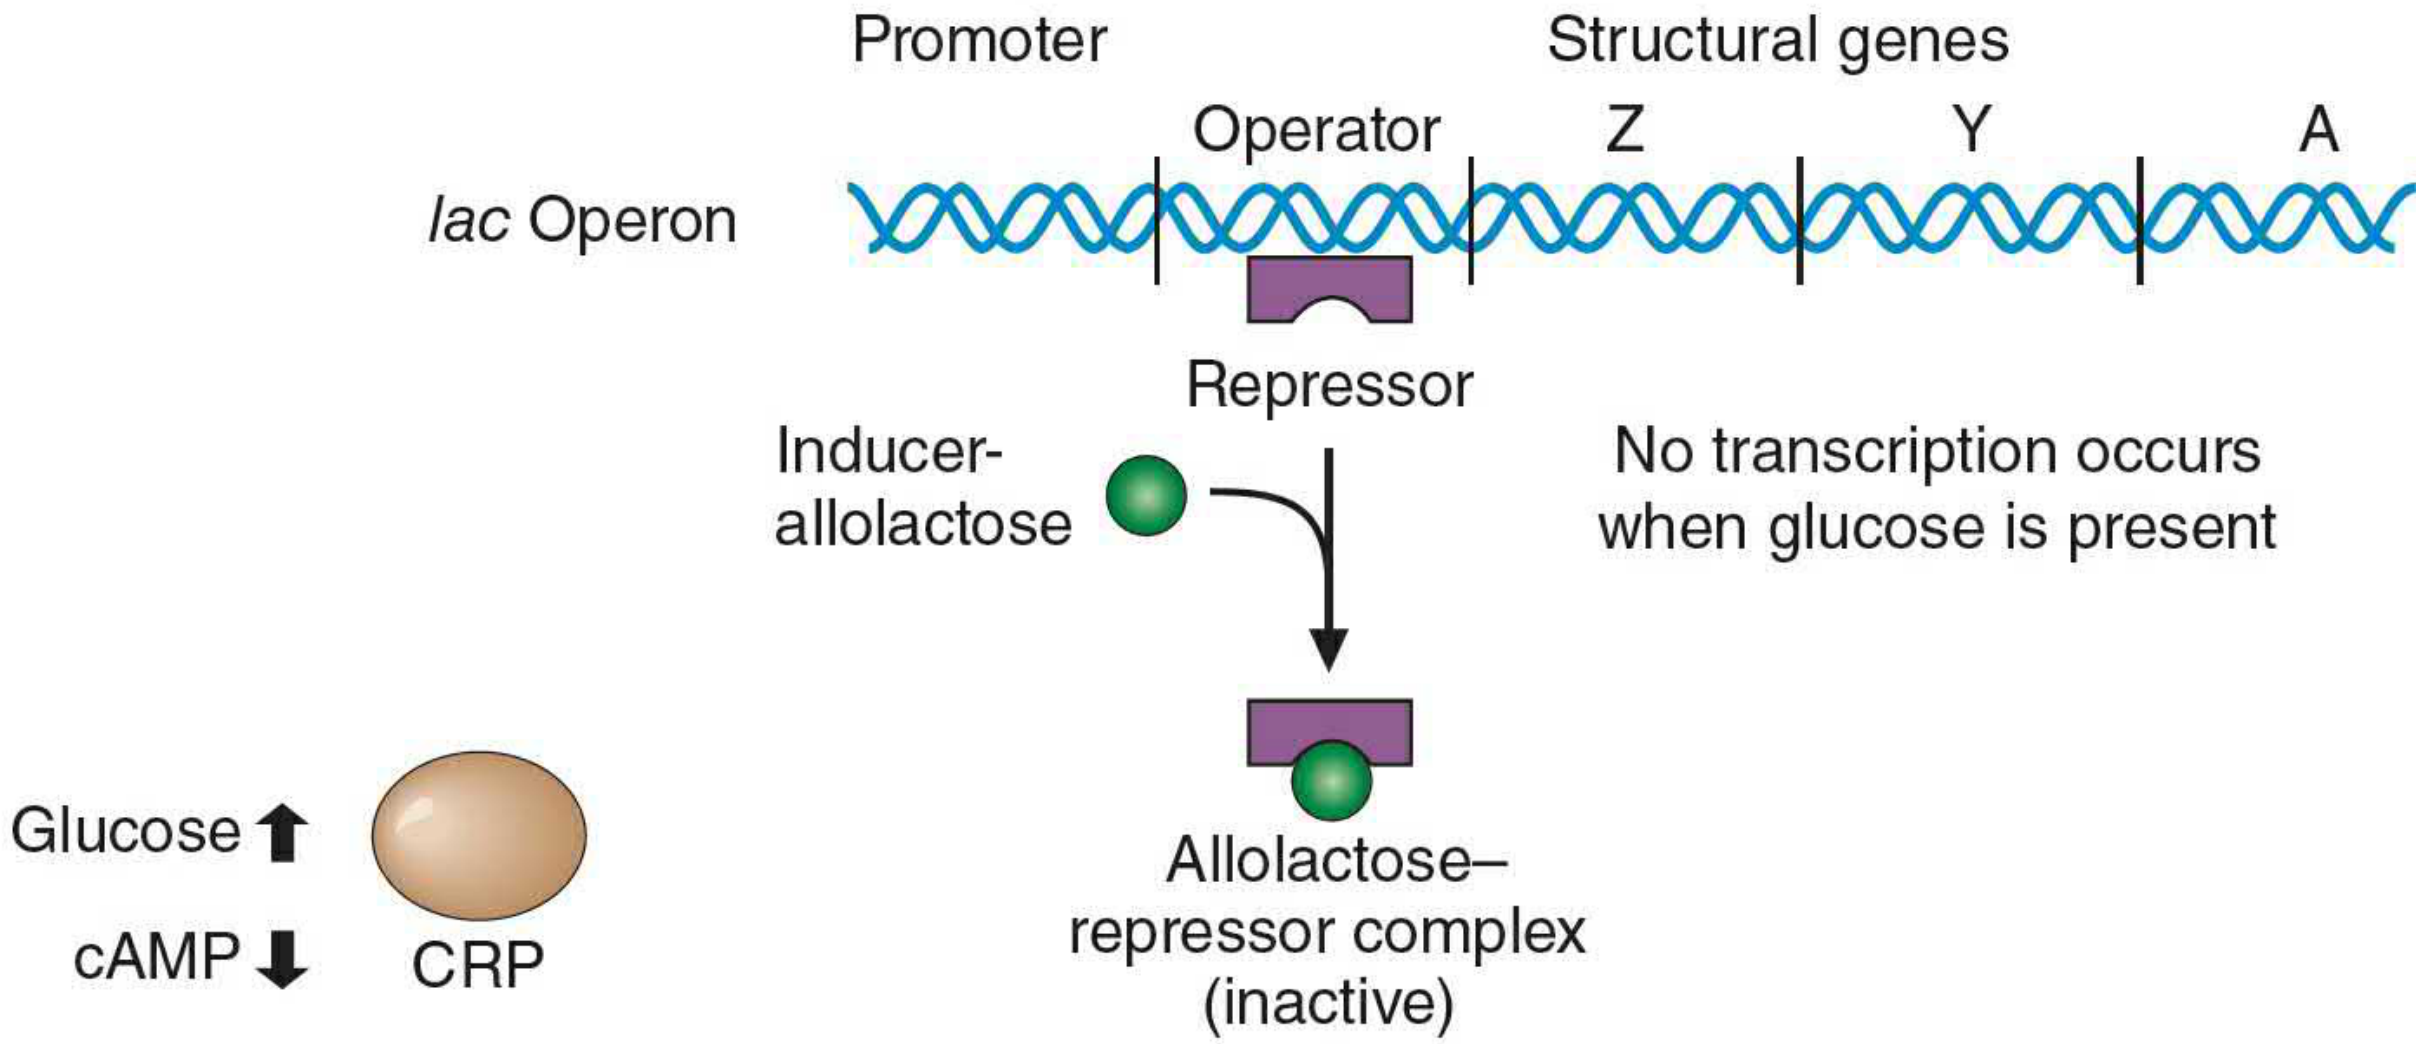
- The lac repressor (encoded by lacI, a separate regulatory gene) is active by default and binds the operator
- In the absence of lactose: repressor sits on operator → no transcription
- When lactose is present: a small amount of lactose enters via basal-level permease and is converted to allolactose (the actual inducer)
- Allolactose binds the lac repressor → repressor changes conformation → can no longer bind the operator → RNA polymerase transcribes lacZ, lacY, lacA
This basal level of permease (produced even without lactose) is why the cell can always "sense" lactose arriving in the environment.
Positive Control: Catabolite Activation (CRP/CAP)
- When glucose is absent: adenylyl cyclase is active → intracellular cAMP rises → cAMP binds CRP (cAMP Receptor Protein, also called CAP/Catabolite Activator Protein) → the cAMP-CRP complex binds a site on the lac promoter → stimulates RNA polymerase binding → maximal transcription
- When glucose is present: cAMP levels fall → CRP remains inactive → reduced RNA polymerase recruitment → reduced (or no) transcription
| Lactose | Glucose | Allolactose | cAMP/CRP | Transcription |
|---|---|---|---|---|
| Absent | Present | Absent | Inactive | None |
| Present | Present | Present | Inactive | Minimal |
| Absent | Absent | Absent | Active | None |
| Present | Absent | Present | Active | Maximum |
The trp Operon (Repressible System)
Structure
Level 1: Repressor-Corepressor Mechanism
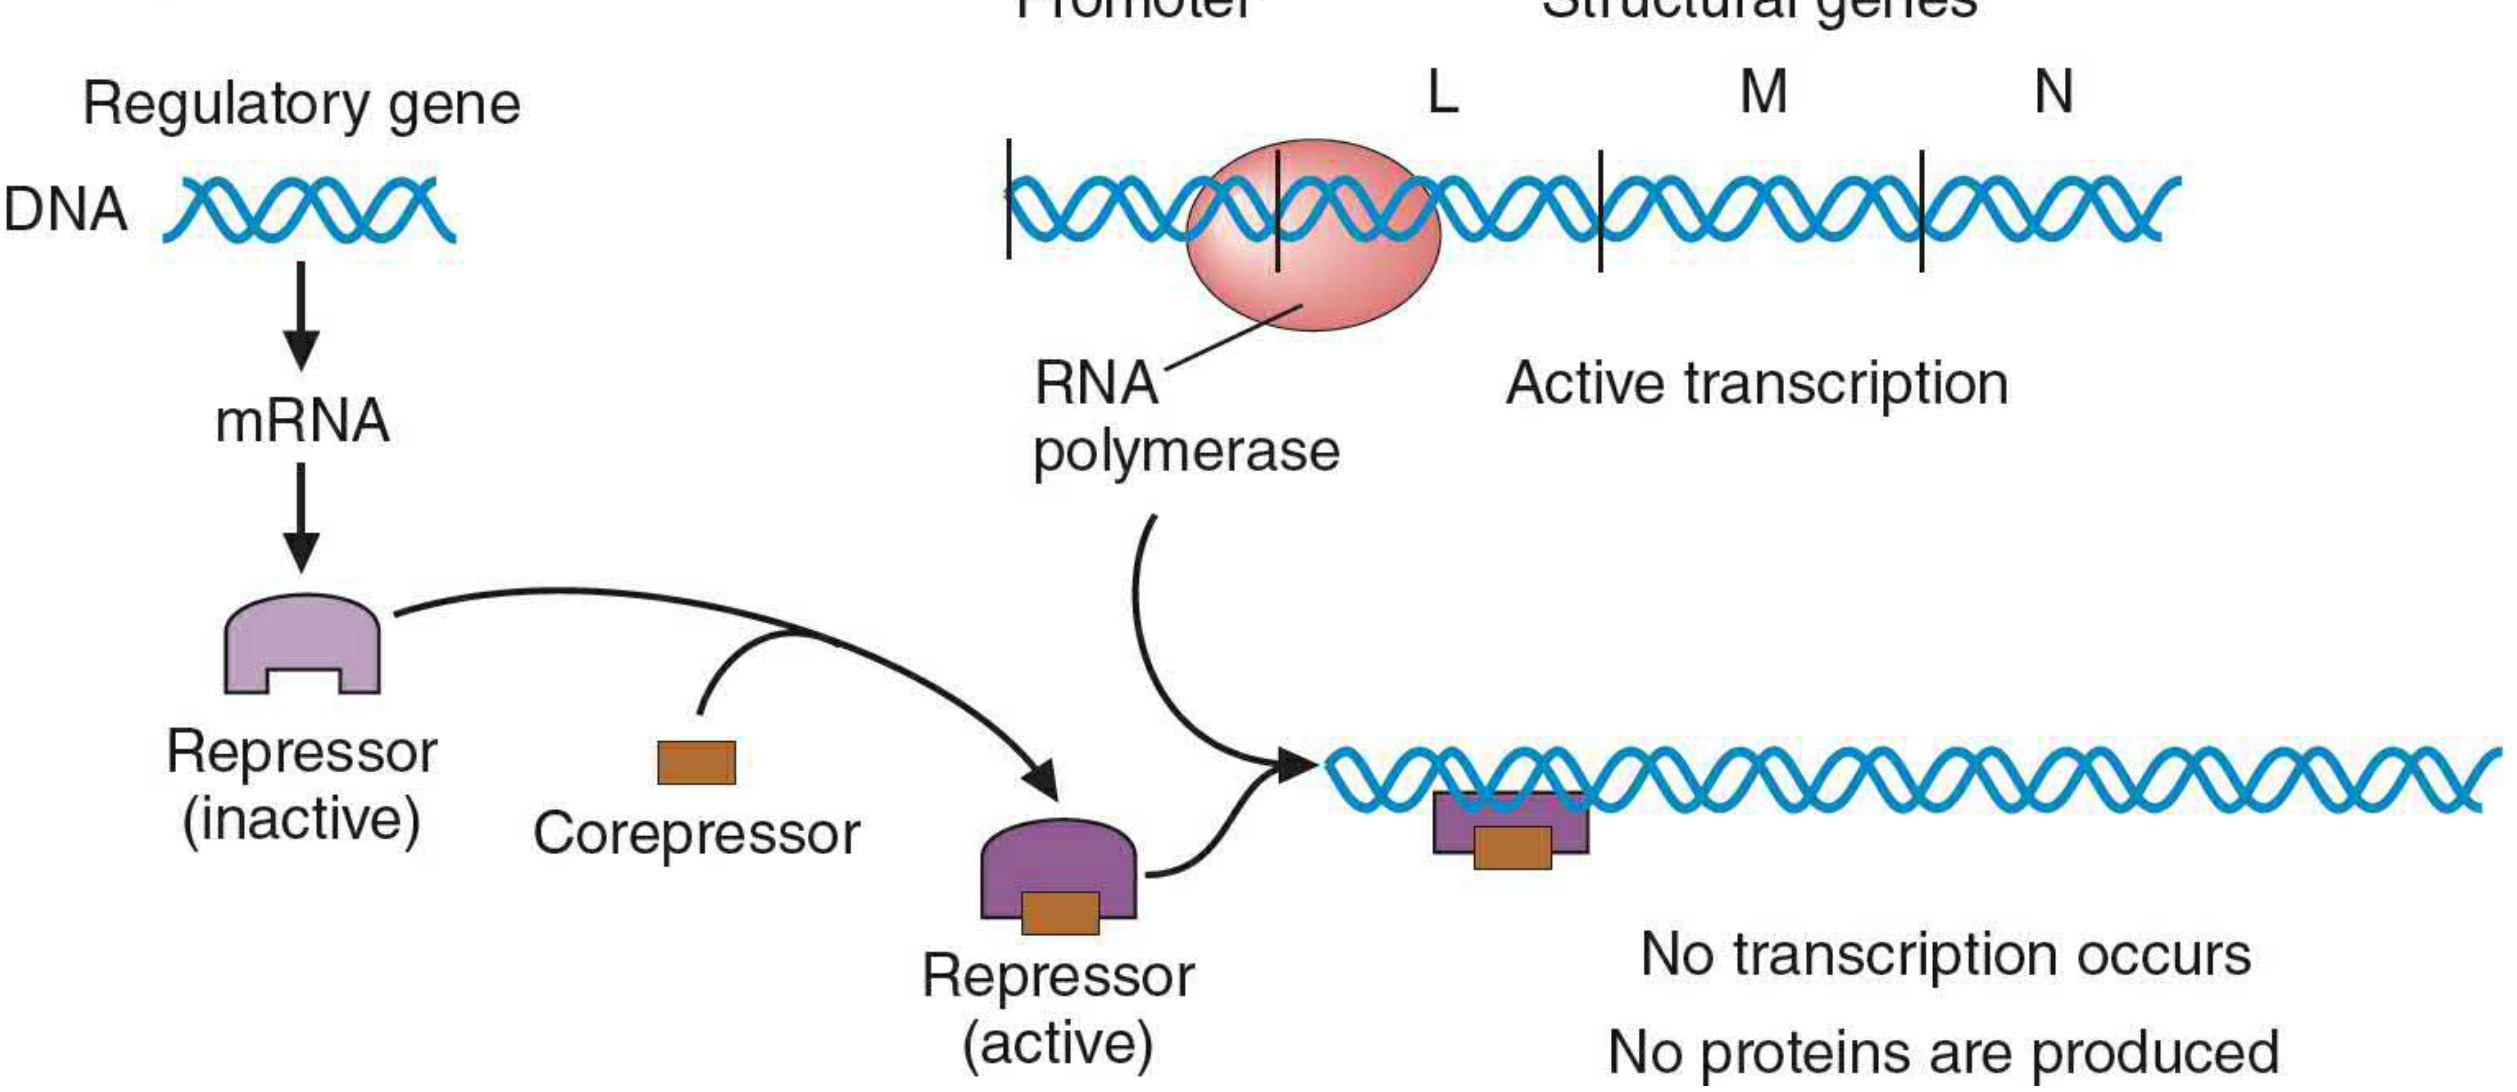
- The trp repressor (encoded by trpR) is inactive (aporepressor) by default
- When tryptophan levels are high, tryptophan acts as a corepressor: it binds the inactive repressor, causing a conformational change to an active state
- The active repressor-tryptophan complex binds the trp operator → blocks RNA polymerase → no transcription of the five trp biosynthetic genes
- When tryptophan is scarce, the aporepressor cannot bind the operator → transcription proceeds → tryptophan biosynthesis resumes
Level 2: Attenuation - A Translational Fine-Tuning Mechanism
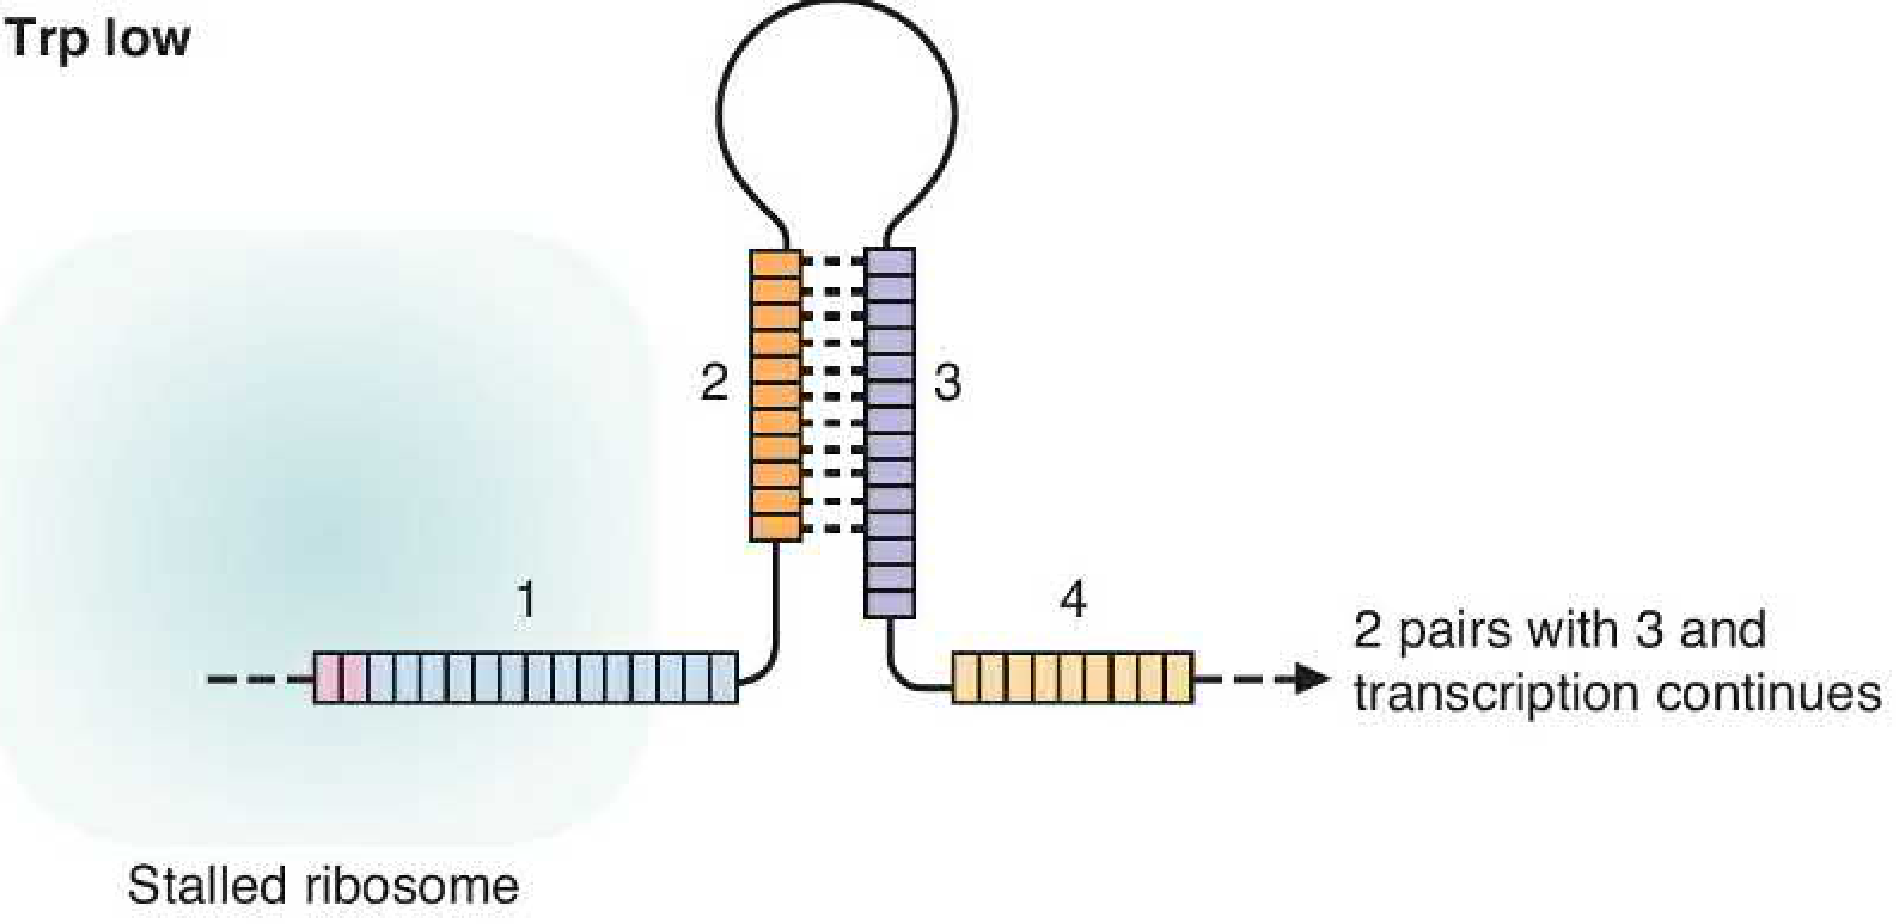
- A short coding region with two consecutive Trp codons (sequence 1)
- Four complementary sequence segments (1, 2, 3, 4) that can form alternative hairpin loops
- Trp-tRNA^Trp is abundant → ribosome translates the leader peptide rapidly
- Ribosome occupies sequence 1 → blocks formation of the 2-3 hairpin
- Sequences 3 and 4 pair → forms a transcription terminator hairpin (rho-independent terminator)
- RNA polymerase stalls and falls off → transcription terminates early
- Trp-tRNA^Trp is scarce → ribosome stalls at the Trp codons in sequence 1
- Sequence 1 is blocked by the stalled ribosome → sequences 2 and 3 pair → forms an anti-terminator hairpin
- The 3-4 terminator loop cannot form → RNA polymerase reads through → full trp mRNA is produced
Attenuation depends entirely on coupled transcription-translation. It does not occur in eukaryotes, where transcription and translation are spatially separated.
C. Summary Comparison
| Feature | lac Operon | trp Operon |
|---|---|---|
| Type | Inducible | Repressible |
| Substrate/end-product | Lactose (catabolic) | Tryptophan (anabolic) |
| Repressor default state | Active (blocks operator) | Inactive (cannot bind operator) |
| Regulatory molecule | Allolactose (inducer) | Tryptophan (corepressor) |
| Effect of molecule on repressor | Inactivates repressor | Activates repressor |
| When genes are ON | Lactose present + glucose absent | Tryptophan absent |
| Secondary regulation | Catabolite activation (cAMP-CRP) | Attenuation (ribosome stalling) |
| Regulation level | Transcription initiation | Transcription initiation + attenuation |
D. Other Regulatory Mechanisms in Prokaryotes
- Sigma factors (σ): RNA polymerase uses different sigma factors to recognize different promoter sequences, allowing a global switch in which genes are transcribed. For example, σ^32 recognizes promoters of heat-shock protein genes, increasing their transcription at elevated temperatures.
- Attenuation also regulates the his, leu, phe, and thr operons (amino acid biosynthetic operons) by the same ribosome-stalling mechanism.