
Explain me 10 common heert diseases with ECG changes and ECG images of those diseases
Reading File
Searching sources...
Finding Sources
Searching the Web
ECG changes 10 common heart diseases STEMI atrial fibrillation heart block images
Finding Sources
Finding Sources
Searching the Web
ECG images STEMI atrial fibrillation heart block bundle branch block LVH site:litfl.com OR site:ecgwaves.com
Finding Sources
Searching the Web
ECG images atrial fibrillation ventricular tachycardia complete heart block Wolff-Parkinson-White hypertrophic cardiomyopathy site:litfl.com
Finding Sources
Reading Web Page
https://litfl.com/atrial-fibrillation-ecg-library
Reading File
Searching the Web
ECG examples STEMI anterior inferior lateral WPW hypertrophic cardiomyopathy pericarditis site:ecgwaves.com OR site:litfl.com
Finding Sources
Loading Image
Loading Image
Loading Image
Loading Image
Loading Image
Loading Image
Loading Image
Loading Image
Loading Image
Searching the Web
ECG atrial flutter complete heart block ventricular tachycardia Wolff-Parkinson-White pericarditis images ecg-guru.com OR ecgpedia.org
Loading Image
Here is a thorough guide to 10 common heart diseases with their ECG changes and available ECG images.
10 Common Heart Diseases: ECG Changes & Images
1. ST-Elevation Myocardial Infarction (STEMI)
What it is
Complete occlusion of a coronary artery causing full-thickness (transmural) myocardial injury.
ECG Changes
- Hyperacute T-waves - the earliest sign; tall, broad, symmetrical T-waves before ST elevation
- ST elevation ≥1 mm in ≥2 contiguous limb leads, or ≥2 mm in ≥2 contiguous precordial leads
- Reciprocal ST depression in opposite leads (e.g., ST elevation in II, III, aVF with reciprocal depression in I, aVL for inferior STEMI)
- Pathological Q waves develop within hours - indicate transmural necrosis (>40 ms wide, >25% of R wave height)
- T-wave inversion after the acute phase
- Lead localisation:
- Anterior: V1-V4 (LAD occlusion)
- Inferior: II, III, aVF (RCA or LCx)
- Lateral: I, aVL, V5-V6 (LCx)
- Posterior: ST depression V1-V3 with dominant R waves (mirror image)
ECG Image - Anterior-Lateral STEMI
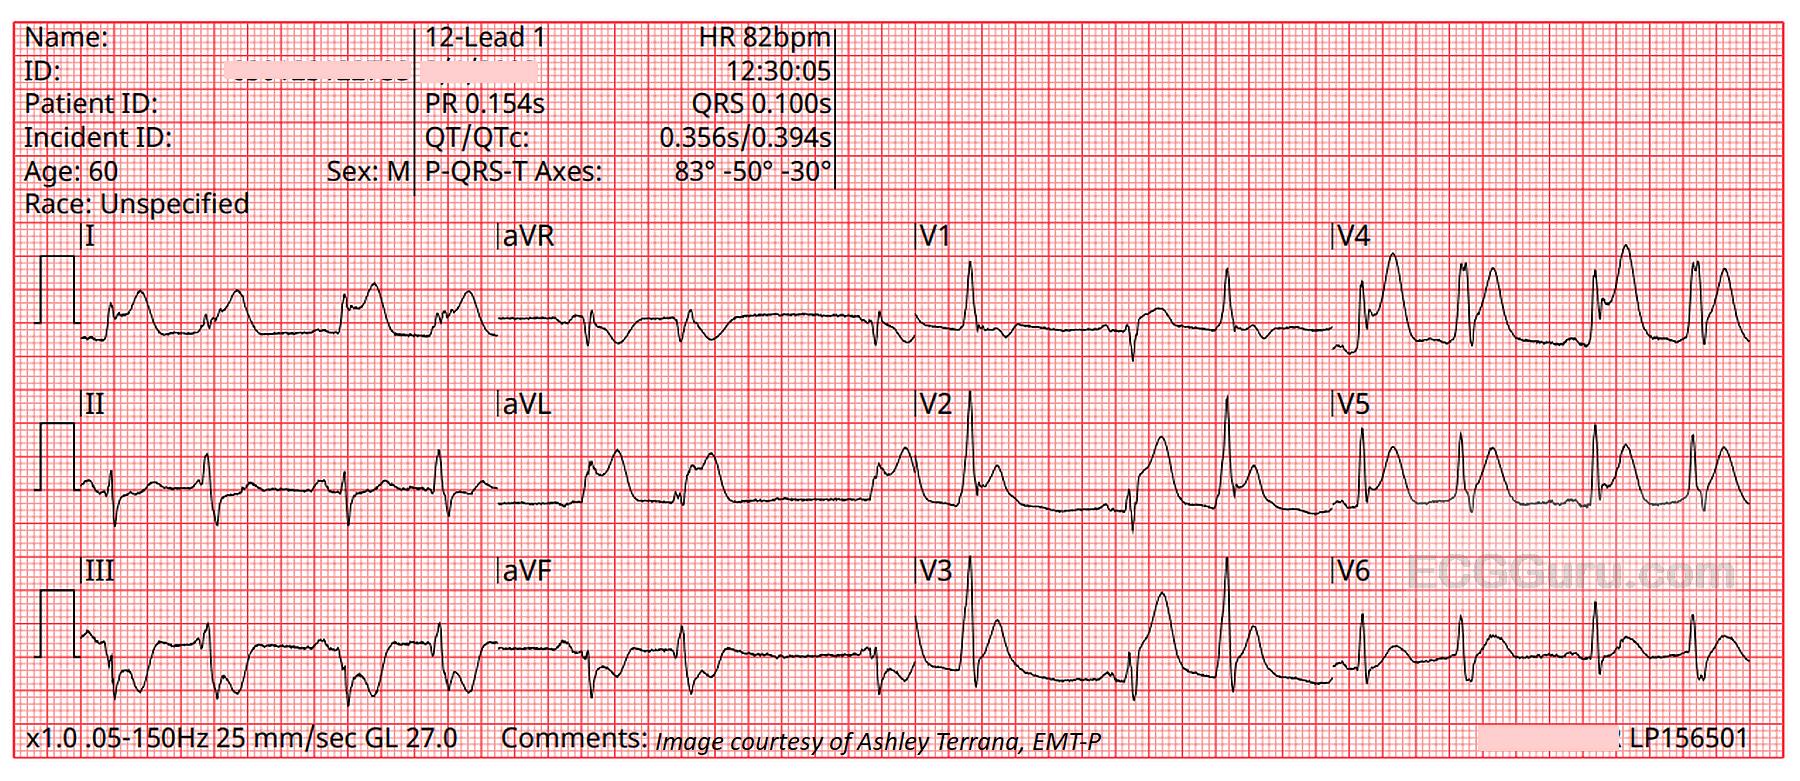
Anterior-lateral STEMI: ST elevation across V2-V6 with Q waves developing in anterior leads. Note left axis deviation (-50°). Source: ECG Guru
Here is a useful reference showing evolving ECG patterns in acute STEMI (Wellens patterns, De Winter T-waves, hyperacute T-waves):

2. Atrial Fibrillation (AF)
What it is
The most common sustained arrhythmia. Chaotic disorganised atrial electrical activity at 350-600 impulses/min with irregular ventricular response.
ECG Changes
- Absent P waves - replaced by fibrillatory (f) waves: irregular, low-amplitude baseline undulations
- Irregularly irregular R-R intervals - the hallmark finding
- Ventricular rate varies (typically 100-180 bpm if uncontrolled; <60 bpm if over-rate-controlled)
- Narrow QRS (unless aberrant conduction or pre-existing bundle branch block)
- Coarse AF - large f-waves (often seen with rheumatic mitral disease)
- Fine AF - small f-waves (common in ischaemic/hypertensive disease)
ECG Image
(LITFL AF example - irregular R-R intervals with absent P waves)
Reference: LITFL Atrial Fibrillation ECG Library
3. Atrial Flutter
What it is
Organised macro-reentrant atrial tachycardia, typically around the tricuspid valve annulus at ~300 bpm.
ECG Changes
- Sawtooth flutter waves at ~300 bpm - best seen in II, III, aVF (negative/inverted sawtooth) and V1 (positive)
- Regular R-R intervals with fixed AV block ratio: most commonly 2:1 (ventricular rate ~150 bpm), 3:1, or 4:1
- No true isoelectric baseline between flutter waves
- Narrow QRS (unless aberrant conduction)
- Classic clue: regular tachycardia at exactly 150 bpm = flutter with 2:1 block until proven otherwise
4. Complete (Third-Degree) Heart Block
What it is
Complete dissociation between atrial and ventricular conduction - no atrial impulses reach the ventricles.
ECG Changes
- P waves and QRS complexes are completely independent (AV dissociation)
- P-wave rate > QRS rate (e.g., P at 80/min, QRS at 35/min)
- No constant PR interval - PR interval varies randomly
- Escape rhythm determines QRS morphology:
- Junctional escape: narrow QRS, rate 40-60/min
- Ventricular escape: wide, bizarre QRS, rate 20-40/min
- Regular P-P intervals and regular (but slow) R-R intervals - both are regular but completely independent
5. Left Bundle Branch Block (LBBB)
What it is
Failure of conduction down the left bundle branch, forcing the left ventricle to be activated slowly via the right ventricle.
ECG Changes (using the WiLLiaM MaRRoW mnemonic)
- QRS duration ≥120 ms (broad QRS)
- Broad, notched ("M-shaped") R wave in lateral leads I, aVL, V5, V6 - the "W" pattern
- Deep S wave (or rS pattern/QS) in V1 - the "M" pattern in right leads
- No septal Q waves in leads I, V5, V6 (normally present)
- Discordant ST-T changes: ST depression and T-wave inversion in leads with dominant R waves (I, V5, V6); ST elevation in leads with deep S waves (V1-V3)
- Left axis deviation common
- New LBBB in context of chest pain = STEMI equivalent - apply Sgarbossa criteria
ECG Image
(LBBB - broad QRS with M-shaped R in lateral leads and deep S in V1)
Reference: LITFL LBBB ECG Library
6. Right Bundle Branch Block (RBBB)
What it is
Failure of conduction down the right bundle branch; right ventricle is activated late via the left ventricle.
ECG Changes (using the WiLLiaM MaRRoW mnemonic)
- QRS duration ≥120 ms
- RSR' ("rabbit ears" or M-shaped) pattern in V1 - the dominant terminal R' in V1
- Wide S wave in lateral leads I, V5, V6 - deep, slurred terminal S wave
- ST depression and T-wave inversion in V1-V3 (appropriate discordance)
- Right axis deviation common
- Incomplete RBBB: same morphology with QRS 100-120 ms
7. Left Ventricular Hypertrophy (LVH)
What it is
Thickening of the left ventricular wall due to chronic pressure overload (hypertension, aortic stenosis) or volume overload.
ECG Changes
- Increased QRS voltage - the primary finding:
- Sokolow-Lyon: S in V1 + R in V5 or V6 ≥35 mm
- Cornell criteria: R in aVL + S in V3 >28 mm (men) or >20 mm (women)
- R in aVL ≥11-12 mm
- Left axis deviation
- LV strain pattern: ST depression + T-wave inversion in lateral leads (I, aVL, V4-V6)
- Prolonged QRS (not >120 ms, but approaching)
- Left atrial enlargement pattern: P mitrale (broad, notched P in II; biphasic P in V1)
8. Wolff-Parkinson-White (WPW) Syndrome
What it is
Pre-excitation syndrome with an accessory pathway (Bundle of Kent) bypassing the AV node, predisposing to tachyarrhythmias.
ECG Changes
- Short PR interval (<120 ms) - due to bypass of AV node delay
- Delta wave - slurred upstroke at the start of the QRS (pre-excitation of ventricle via accessory pathway)
- Widened QRS (≥120 ms) - combination of delta wave + normal conduction
- Secondary ST-T changes - discordant to QRS direction
- Type A: dominant R wave in V1 (left-sided pathway)
- Type B: negative delta wave/QS in V1 (right-sided pathway)
- AF in WPW: chaotic wide-complex tachycardia with varying QRS morphology - life-threatening (can degenerate to VF)
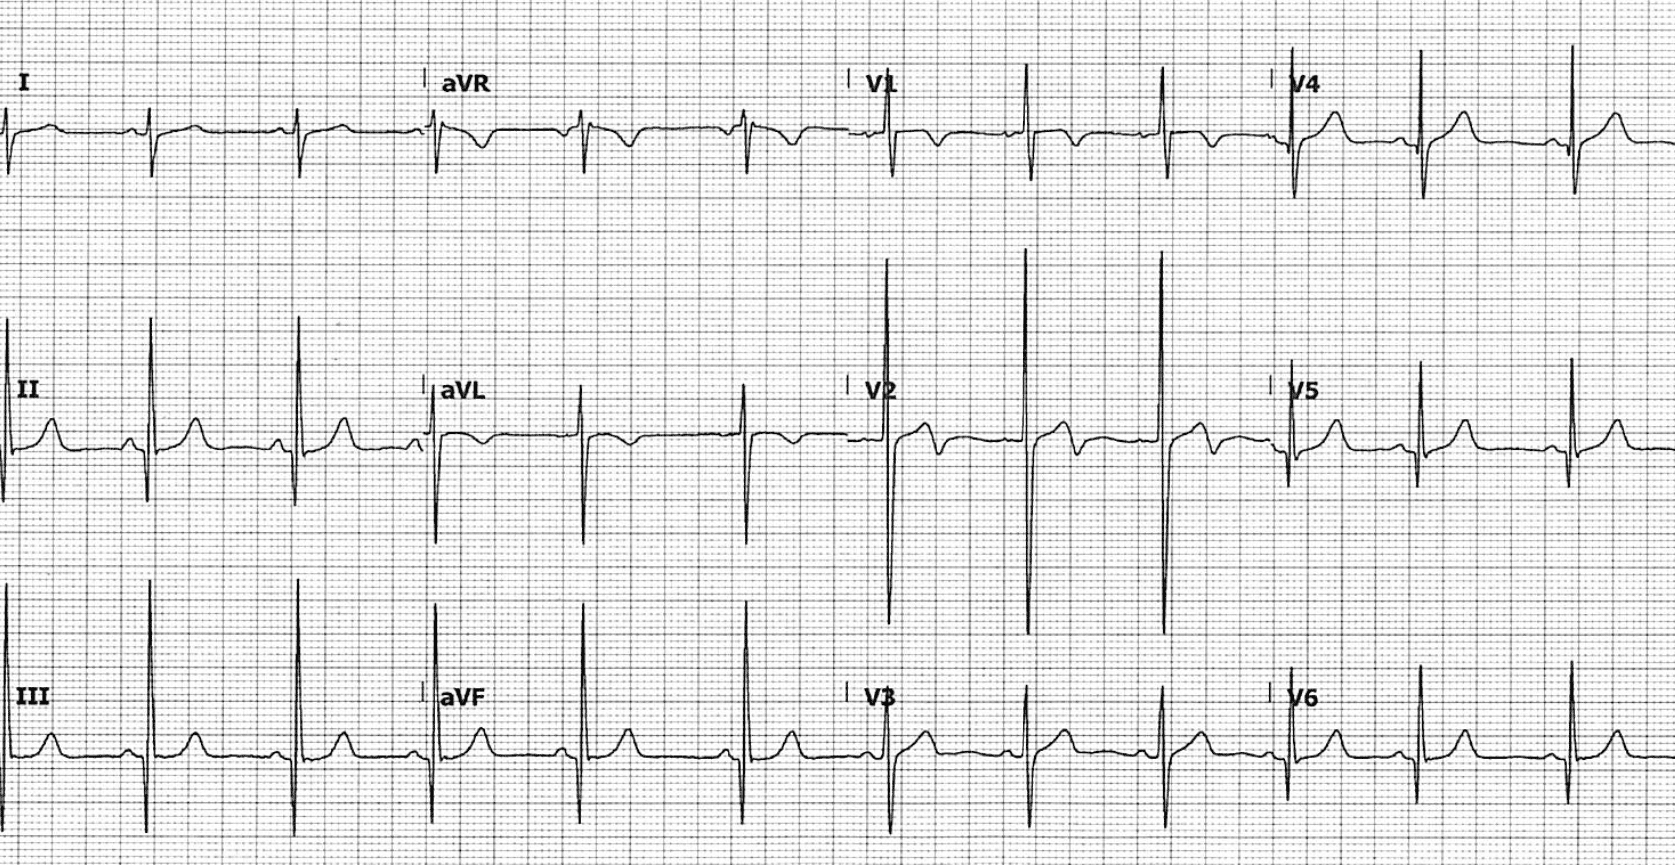
- The HCM ECG shown below is from LITFL and demonstrates deep, widespread T-wave inversions:
9. Hypertrophic Cardiomyopathy (HCM)
What it is
Genetic disorder causing asymmetric (usually septal) myocardial hypertrophy, often in young patients. Leading cause of sudden cardiac death in athletes.
ECG Changes
- LVH voltage criteria in most patients (tall R waves, deep S waves)
- Deep, widespread T-wave inversions - especially striking in lateral and inferior leads; can be giant in apical HCM (Yamaguchi syndrome)
- Asymmetric septal Q waves: deep, narrow ("dagger") Q waves in lateral (I, aVL, V5-V6) and inferior leads - caused by septal hypertrophy
- Left atrial enlargement pattern
- Left axis deviation
- Apical HCM: massive T-wave inversions V1-V6 with high voltage
- 5% of HCM patients have a normal ECG
The ECG shown above (HCM image) demonstrates the asymmetric septal hypertrophy pattern with deep lateral T-wave inversions and LVH voltage.
10. Acute Pericarditis
What it is
Inflammation of the pericardium, typically from viral, autoimmune, or idiopathic causes. Presents with pleuritic chest pain, friction rub.
ECG Changes (four stages)
| Stage | Timing | Findings |
|---|---|---|
| Stage 1 | Hours-days | Widespread concave ("saddle-shaped") ST elevation in most leads except aVR and V1 (which show ST depression); PR depression in most leads, PR elevation in aVR |
| Stage 2 | Days | ST returns to baseline; T waves flatten |
| Stage 3 | Weeks | T-wave inversions develop |
| Stage 4 | Months | ECG normalises |
Key differentiators from STEMI:
- ST elevation is diffuse (not in a coronary territory)
- Concave/saddle-shaped ST elevation (vs. convex in STEMI)
- PR depression present (pathognomonic for pericarditis)
- No reciprocal ST depression except aVR and V1
- No pathological Q waves
- Spodick's sign: downsloping TP segment (best seen in II)
Summary Table
| # | Disease | Key ECG Findings |
|---|---|---|
| 1 | STEMI | Hyperacute T, ST elevation, Q waves, reciprocal changes |
| 2 | Atrial Fibrillation | No P waves, irregularly irregular QRS |
| 3 | Atrial Flutter | Sawtooth P waves ~300/min, 2:1 conduction |
| 4 | Complete Heart Block | P-QRS dissociation, bradycardia, escape rhythm |
| 5 | LBBB | Wide QRS, M-shaped R in lateral, rS in V1, discordant ST-T |
| 6 | RBBB | Wide QRS, RSR' in V1, broad S in I/V6 |
| 7 | LVH | High voltage, left axis, strain pattern (ST depression/T inversion lateral) |
| 8 | WPW | Short PR, delta wave, wide QRS, secondary ST-T changes |
| 9 | HCM | LVH, deep Q waves, widespread T inversion, possible giant T inversion |
| 10 | Pericarditis | Diffuse concave ST elevation, PR depression, no Q waves |
Additional STEMI ECG Patterns Reference (Wellens, De Winter T-waves, posterior OMI and other ischemic equivalents):
Anterior-Lateral STEMI example (ST elevation V2-V6, Q waves, left axis deviation):
HCM ECG (deep T-wave inversions + LVH voltage - classic asymmetric septal hypertrophy pattern):
Sources:
- Braunwald's Heart Disease, Textbook of Cardiovascular Medicine (Braunwald's Heart Disease, 2 Vol Set)
- Tintinalli's Emergency Medicine: A Comprehensive Study Guide
- Goldman-Cecil Medicine International Edition
- LITFL ECG Library - Life in the Fast Lane
- ECGwaves.com - Clinical ECG Interpretation
- ECG Guru
Clinical Note: ECG interpretation always requires clinical context. These ECG patterns are diagnostic aids - never substitute for a complete clinical assessment. Some conditions (e.g., posterior STEMI, STEMI with LBBB) can be easily missed and require high clinical suspicion.Here's a quick recap of what was covered:
The 10 common heart diseases with ECG changes are:
- STEMI - Hyperacute T-waves, ST elevation in a coronary territory, reciprocal depression, Q waves
- Atrial Fibrillation - Absent P waves, irregularly irregular QRS
- Atrial Flutter - Sawtooth flutter waves at ~300/min, 2:1 or 3:1 ventricular response
- Complete Heart Block - Full P-QRS dissociation, slow escape rhythm
- Left Bundle Branch Block (LBBB) - Wide QRS, M-shaped R in lateral leads, rS in V1
- Right Bundle Branch Block (RBBB) - Wide QRS, RSR' ("rabbit ears") in V1, broad S in I/V6
- Left Ventricular Hypertrophy (LVH) - Tall voltage, left axis, lateral strain pattern
- Wolff-Parkinson-White (WPW) - Short PR, delta wave, wide QRS
- Hypertrophic Cardiomyopathy (HCM) - LVH voltage, septal Q waves, giant T-wave inversions
- Acute Pericarditis - Diffuse concave ST elevation, PR depression, no Q waves
Three ECG images are embedded in the answer above - a detailed STEMI pattern chart (Wellens/De Winter/posterior OMI), a real 12-lead anterior-lateral STEMI example, and a classic HCM ECG with deep T-wave inversions. All descriptions are sourced from Braunwald's Heart Disease, Tintinalli's Emergency Medicine, Goldman-Cecil Medicine, and validated ECG libraries (LITFL, ECGwaves).
This is a shared conversation. Sign in to Orris to start your own chat.