
Epidemiological problem solving place, person distribution of disease
Reading File
Quick answer: In epidemiology, "place, person, and time" are the three classic dimensions of descriptive epidemiology used to characterize disease distribution. "Person" covers who gets the disease (age, sex, occupation, etc.) and "place" covers where it occurs (geographic distribution, urban/rural, etc.). Together they help generate hypotheses about etiology.
Searching sources...
Finding Sources
Finding Sources
Park's Textbook has dedicated sections. Let me pull them both.
Reading File
Reading File
Good. Now let me pull the detailed "Describing the disease" section (person and place variables) from Park's.
Reading File
I can see the time distribution section. Now let me get the PLACE and PERSON distribution sections.
Reading File
Excellent content obtained. Now let me get the PERSON distribution section.
Reading File
I now have comprehensive content from Park's Textbook. Let me also get the start of the PERSON distribution section (which should be a bit before offset 6558).
Reading File
I have all the content I need. Let me now compile a comprehensive, well-structured answer covering place and person distribution of disease in epidemiology.
Epidemiological Problem Solving: Place and Person Distribution of Disease
In descriptive epidemiology, disease occurrence is analyzed along three dimensions - time, place, and person. These variables help generate aetiological hypotheses and guide prevention. The primary objective is to describe the distribution and magnitude of disease within defined populations.
"The epidemiologist examines whether there is a higher concentration of disease in one geographic area than in others; whether the disease occurs more often in men or in a particular age-group; and whether most characteristics or behaviour of those affected are different from those not affected."
- Park's Textbook of Preventive and Social Medicine, p. 76
Table of Variables Examined in Descriptive Studies
| Time | Place | Person |
|---|---|---|
| Year, season | Climatic zones | Age |
| Month, week | Country, region | Sex |
| Day, hour of onset | Urban/rural, local community | Marital state |
| Duration | Towns, cities, institutions | Occupation, social status, education |
| Birth order, family size, height, weight, blood pressure, personal habits |
PLACE DISTRIBUTION (Geographical Comparisons)
Study of the geography of disease (geographical pathology) is one of the most important dimensions of descriptive epidemiology. Geographic patterns provide clues about disease causes, spread, and aetiological factors.
Classifications of Geographic Variations
a. International Variations
- Disease patterns differ markedly between countries.
- Examples:
- Cancer of the stomach - very common in Japan, unusual in the USA
- Cancers of the oral cavity and uterine cervix - exceedingly common in India compared to industrialized countries
- Breast cancer - lowest prevalence in Japan, highest in Western countries
- These variations suggest the role of dietary, cultural, and environmental factors
- The finding that Japanese migrants to the USA acquire cancer rates closer to American rates over time points strongly to environmental rather than genetic causation
b. National Variations
- Disease rates vary significantly within a single country
- Examples: Burkitt's lymphoma in Africa correlates with rainfall and altitude; endemic goitre correlates with iodine-deficient soil; dental fluorosis corresponds to fluoride content in water
c. Rural-Urban Variations
- Certain diseases cluster in urban areas (e.g., cardiovascular disease, road traffic accidents, air pollution-related lung disease)
- Others are predominantly rural (e.g., zoonoses, malaria, occupational agricultural hazards)
d. Local Distributions
- Disease clustering within communities, neighborhoods, or institutions
- Spot maps (as used by John Snow in the 1854 cholera outbreak in London) are the classic tool - by mapping cases and overlaying the Broad Street pump, Snow identified the contaminated water source, founding modern epidemiology
Migration Studies
A powerful tool for separating genetic vs. environmental factors:
- Method 1: Compare migrants' disease rates with those of kin who stayed at home (same genetics, different environment)
- Method 2: Compare migrants' rates with the host population (different genetics, same environment)
- If migrants adopt the disease pattern of their new country over time, environment is implicated
- Classic example: Japanese migrants to USA showed rising colorectal cancer rates and falling gastric cancer rates - consistent with dietary/environmental causation
Clues from Place Distribution
- Identifies the source of disease (e.g., contaminated water supply, toxic factory)
- Reveals mode of spread (waterborne, airborne, vector-borne)
- Suggests the role of climate, geography, socioeconomic conditions
- Guides prevention: the clinician benefits from knowing a patient's geographic origin for rare diseases (e.g., leishmaniasis, yaws)
PERSON DISTRIBUTION
"Person" variables describe who is affected. This helps identify high-risk groups and points toward causal mechanisms.
(a) Age
- The single most important personal characteristic in epidemiology
- Disease frequency almost always varies with age
- Examples:
- Infectious diseases: high attack rates in children (no prior immunity)
- Chronic diseases (cancer, atherosclerosis): progressive increase with age - reflects cumulative exposure to risk factors
- Meningitis: peaks in infancy and again in young adults
- Uniform attack rate across all ages in an epidemic implies no prior immunity in the population
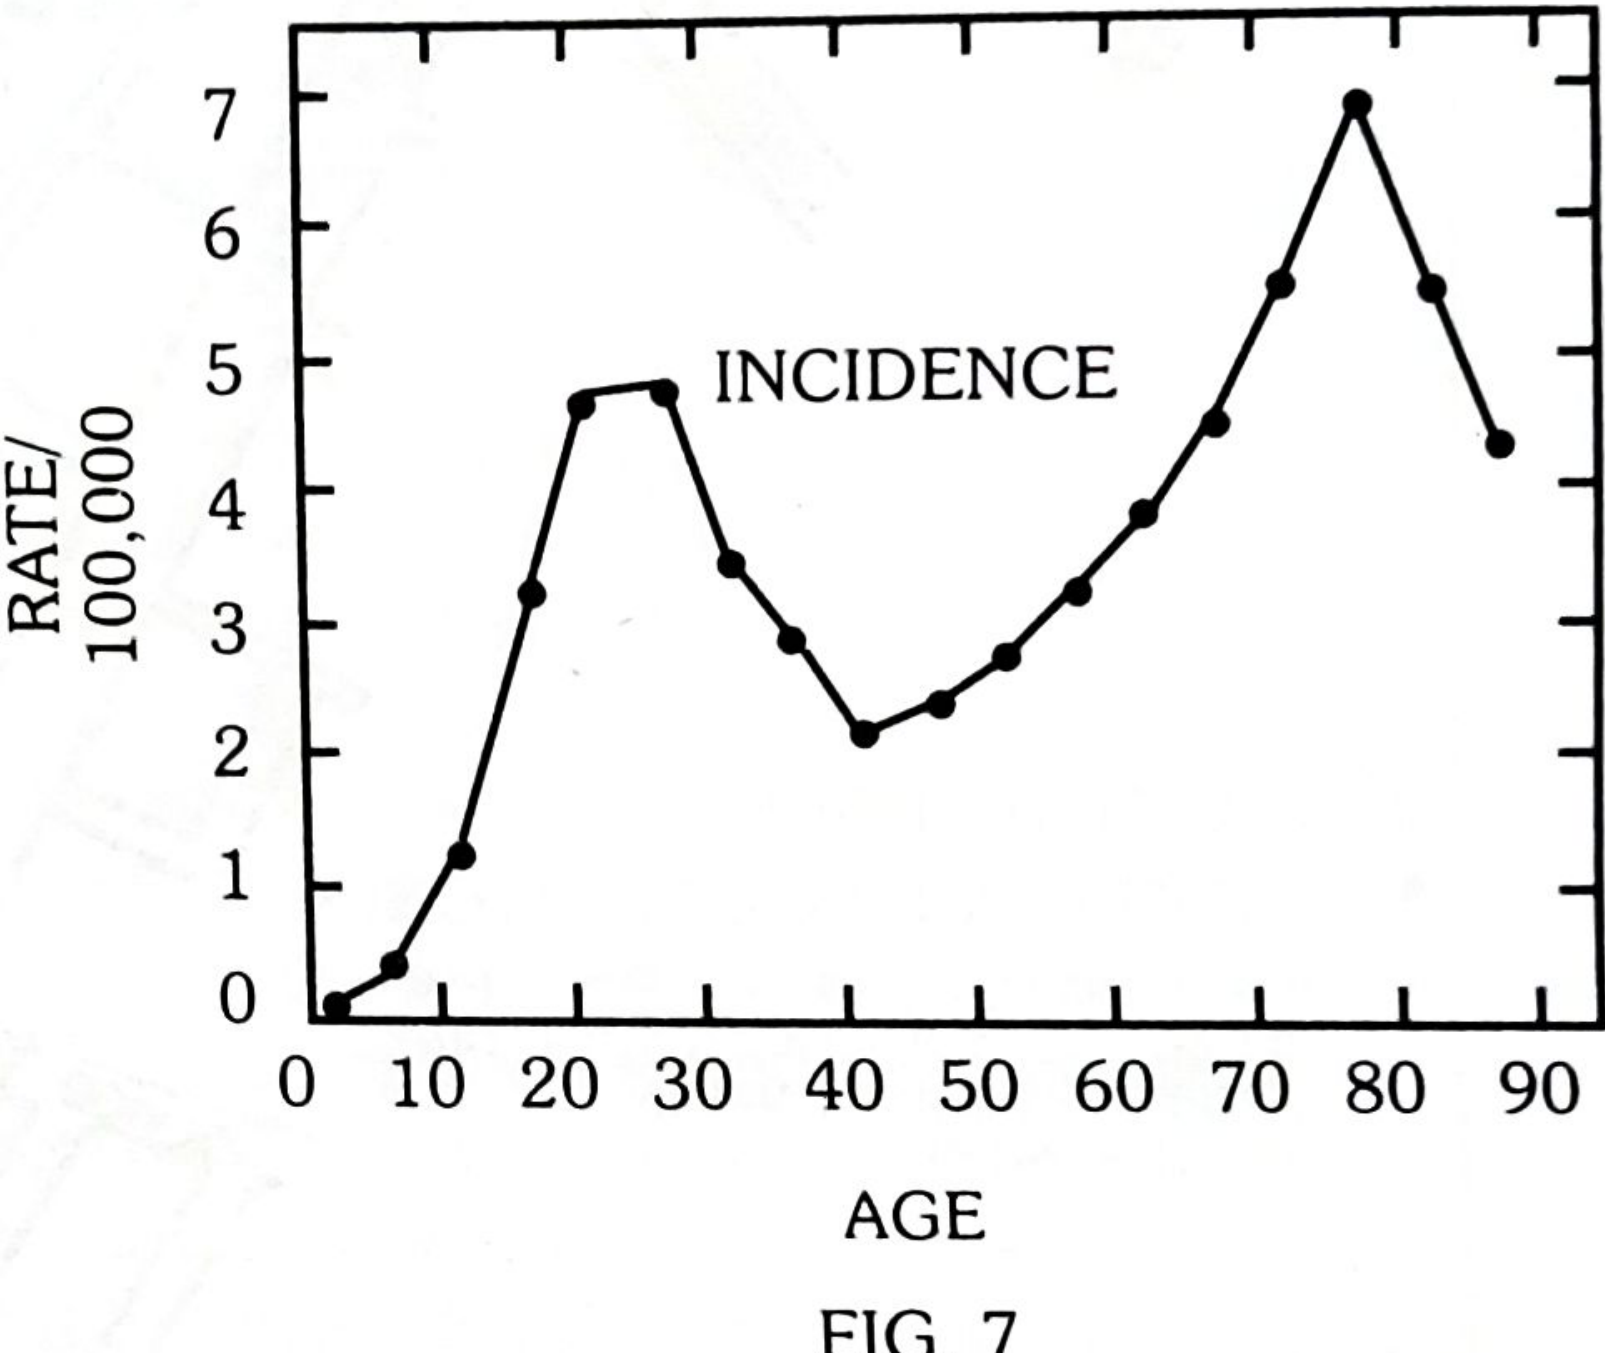
- Bimodality: Two separate peaks in the age-incidence curve (e.g., Hodgkin's disease peaks at 15-35 years AND again after age 50; also female breast cancer and leukaemia). Bimodality suggests two distinct aetiological subsets even if clinical presentation is the same
(b) Sex
- Disease frequency is compared using sex ratio, sex-specific morbidity and mortality rates
- More common in women: Diabetes, hyperthyroidism, obesity, autoimmune diseases, gallstones
- More common in men: Lung cancer, coronary heart disease, duodenal ulcer, gout
- Causes of sex differences:
- Biological: Sex-linked genetic inheritance, hormonal differences
- Behavioural/Cultural: Smoking, alcohol use, occupational exposure, risk-taking behaviour
- Example: The 4:1 male-to-female ratio in lung cancer helped incriminate cigarette smoking as a causal factor
(c) Ethnicity / Race
- Differences in disease frequency between racial/ethnic groups
- Examples:
- Hypertension: higher rates in Black populations
- Sickle cell disease: almost exclusive to populations of sub-Saharan African, Mediterranean, and Middle Eastern origin (malaria-endemic zones - heterozygote advantage)
- Type 2 diabetes: higher rates in South Asian populations
(d) Occupation
- One of the first identified disease causes (Ramazzini, 1700s)
- Examples:
- Mesothelioma - asbestos exposure (miners, insulation workers)
- Bladder cancer - aniline dye workers
- Silicosis - stone cutters, miners
- Noise-induced hearing loss - factory workers
- "Phossy jaw" (phosphorus necrosis) - matchmakers in the 19th century
(e) Social Class / Socioeconomic Status
- Measured by indices: income, education, housing, occupation
- Inverse gradient: Most infectious and many chronic diseases are more prevalent in lower socioeconomic groups
- Exceptions: Historically, some cancers (breast, colon) were more common in higher-income groups (dietary fat, delayed childbearing)
- Explains much of the health inequalities within nations
(f) Marital Status
- Married individuals generally have lower mortality rates than unmarried/divorced
- Mental illness, suicide, and certain cancers vary with marital status
(g) Religion and Culture
- Example: Circumcision practices and penile/cervical cancer rates
- Seventh-Day Adventists (vegetarian, non-smoking, non-drinking) have lower rates of cardiovascular disease and certain cancers
- Jewish women have lower rates of cervical cancer
(h) Personal Habits and Lifestyle
- Smoking: Lung cancer, COPD, cardiovascular disease, bladder cancer
- Alcohol: Liver cirrhosis, head/neck cancers, fetal alcohol syndrome
- Diet: Colorectal cancer (low fiber, high fat), cardiovascular disease (saturated fats), dental caries (sugar)
- Physical inactivity: Type 2 diabetes, obesity, cardiovascular disease
Summary: Why Person and Place Distribution Matter in Problem Solving
| Dimension | Key Question | Epidemiological Utility |
|---|---|---|
| Place | Where is the disease concentrated? | Identifies source, mode of spread, environmental/geographic risk factors |
| Person | Who gets the disease? | Identifies high-risk groups, biological and behavioral risk factors, aetiological hypotheses |
Problem-Solving Approach
- Map the cases (spot maps, choropleth maps) - visualize place clustering
- Calculate rates by subgroups (age-specific, sex-specific, occupation-specific rates)
- Compare rates between groups and regions
- Generate hypotheses - what exposure links affected people/places?
- Test hypotheses with analytical epidemiology (cohort, case-control studies)
"Geographic patterns and person characteristics provide an important source of clues about the causes of disease... It is only an initial separation or grouping of variables according to time, place and person and NOT a classification of causal factors."
- Park's Textbook of Preventive and Social Medicine, p. 76
Sources: Park's Textbook of Preventive and Social Medicine (23rd ed.); Campbell Walsh Wein Urology; Kaplan & Sadock's Comprehensive Textbook of Psychiatry
This is a shared conversation. Sign in to Orris to start your own chat.