Explain me ECG in simple
Reading File
Finding Sources
Searching Images
normal ECG waveform labeled P wave QRS T wave
Reading File
Finding Sources
Searching Images
ECG paper speed segments intervals PR QRS QT explained diagram
Loading Image
Loading Image
Here's a simple breakdown of ECG (Electrocardiogram).
What is an ECG?
An ECG is a recording of the electrical activity of the heart picked up by electrodes placed on the skin. Every time the heart beats, a tiny electrical signal travels through it — the ECG captures that signal as a wave on paper.
Think of it like this: the heart is a pump, but it needs electrical signals to know when to squeeze. The ECG is a recording of those signals.
The ECG Waveform — What Each Part Means
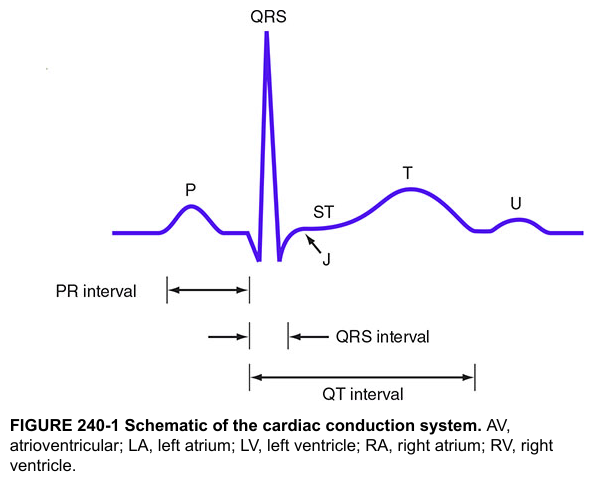
Harrison's Principles of Internal Medicine — Schematic of the cardiac conduction system
| Wave / Segment | What's happening in the heart |
|---|---|
| P wave | The upper chambers (atria) are told to squeeze. Electrical signal fires from the SA node (the heart's natural pacemaker). |
| PR interval | The signal pauses at the AV node — a built-in delay so the atria finish squeezing before the ventricles start. |
| QRS complex | The lower chambers (ventricles) squeeze hard to push blood out to the body and lungs. This is the biggest spike on the ECG. |
| ST segment | The ventricles are contracting — electrically "flat" in a healthy heart. Any elevation or depression here is a red flag (think: heart attack). |
| T wave | The ventricles electrically "reset" (repolarize) to prepare for the next beat. |
| U wave | A small wave sometimes seen after T — not always present; its exact cause is debated. |
The Electrical Journey — Step by Step
SA node (fires) → Atria contract (P wave)
        ↓
AV node (delays signal) → PR interval
        ↓
Bundle of His → Left & Right bundle branches → Purkinje fibers
        ↓
Ventricles contract (QRS complex)
        ↓
Ventricles reset (T wave)
        ↓
Ready for the next beat...
How ECG Relates to the Heartbeat (Mechanical Events)
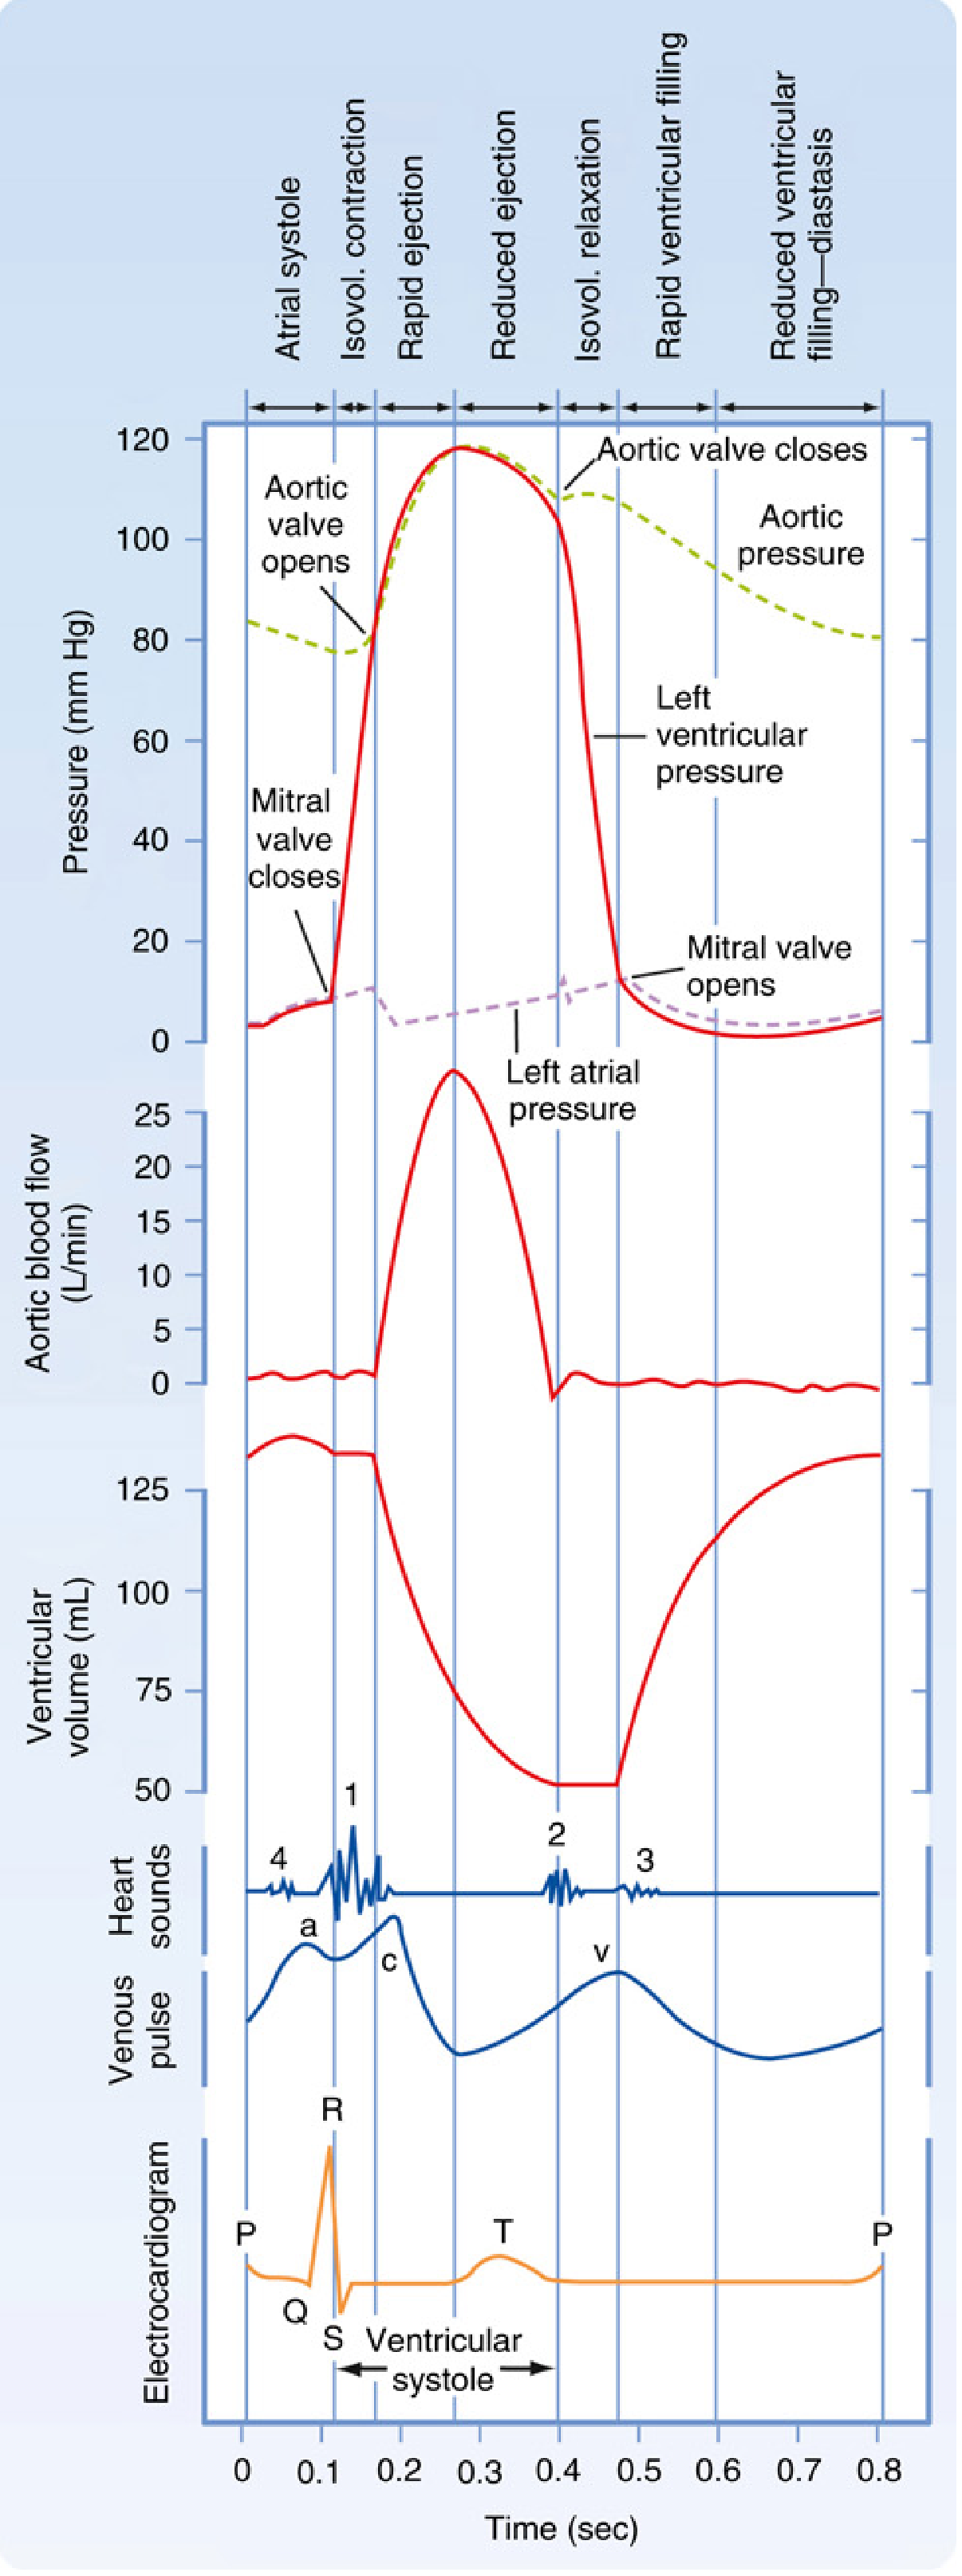
Miller's Anesthesia — Electrical and mechanical events during a single cardiac cycle
The diagram above perfectly shows how the electrical events (ECG at bottom) trigger the mechanical events — pressure changes, valve opening/closing, and blood flow.
- P wave → atrial kick (final ~25% of ventricular filling)
- QRS → mitral/tricuspid valves close → ventricles start squeezing (systole begins)
- T wave → aortic/pulmonic valves close → ventricles relax (diastole begins)
Key Intervals to Know
| Interval | Normal Value | What it checks |
|---|---|---|
| PR interval | 120–200 ms | AV node conduction (prolonged = heart block) |
| QRS duration | < 120 ms | Ventricular conduction (wide = bundle branch block) |
| QT interval | < 440 ms (men), < 460 ms (women) | Ventricular repolarization (prolonged = risk of dangerous arrhythmia) |
What Can ECG Diagnose?
- Heart attack (MI) — ST elevation or depression, Q waves
- Arrhythmias — irregular R-R intervals, absent P waves (atrial fibrillation), etc.
- Heart block — prolonged PR, dropped beats
- Bundle branch blocks — wide QRS
- Electrolyte abnormalities — e.g., high potassium widens QRS; low potassium prolongs QT
The ECG Paper
- Each small square = 0.04 sec (horizontal) and 0.1 mV (vertical)
- Each large square = 0.2 sec
- Standard speed: 25 mm/second
- Heart rate = 300 ÷ number of large squares between two R waves
Bottom line: The ECG is just a picture of the heart's electrical activity. Once you know which wave represents which event — P (atria), QRS (ventricles contracting), T (ventricles resetting) — everything else builds on that foundation.
Sources: Harrison's Principles of Internal Medicine, 21e; Miller's Anesthesia, 10e
This is a shared conversation. Sign in to Orris to start your own chat.