
Thyroid
What aspect of the thyroid are you interested in?
thyroid gland anatomy diagram
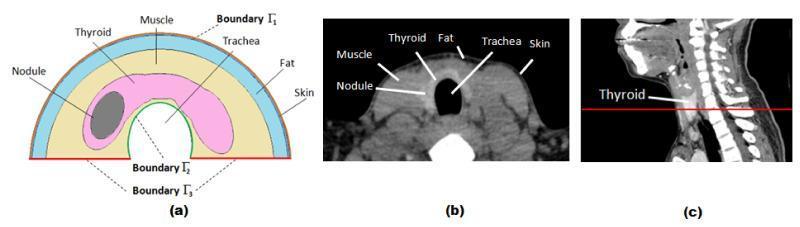
This composite educational graphic details the cross-sectional anatomy of the human neck for Finite Element (FE) thyroid simulation. (a) A 2D schematic diagram presents a simplified semicircular model of the neck. It labels the layers concentrically: skin (outermost), fat, and muscle. Inside the muscle layer, the thyroid gland is depicted in pink, containing an elliptical dark grey thyroid nodule. Boundaries are marked as Γ1 (skin surface), Γ2 (trachea boundary), and Γ3 (prescribed temperature base). (b) A corresponding axial CT scan image shows the actual anatomical cross-section, with labels identifying the skin, fat, muscle, thyroid gland, trachea (central air-filled void), and an internal nodule. The CT highlights varying tissue densities, from the dark fat layer to the intermediate density of muscle and thyroid tissue. (c) A sagittal CT view of the head and neck shows a red horizontal line indicating the anatomical plane of the axial slice in (b), positioned at the level of the thyroid gland. This visual serves as a reference for modeling heat transfer and infrared thermography in patients with thyroid nodules.
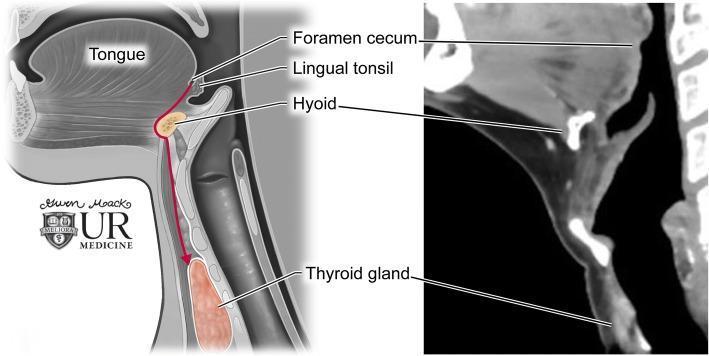
This dual-panel educational graphic illustrates thyroglossal duct anatomy and the embryological descent of the thyroid gland. On the left is a sagittal anatomical diagram showing the path of descent (indicated by a red arrow) from the foramen cecum at the base of the tongue, passing through the hyoid bone, to its final position at the thyroid gland anterior to the trachea. Key labeled structures include the tongue, lingual tonsil, foramen cecum, hyoid, and thyroid gland. The right panel displays a corresponding sagittal contrast-enhanced CT image of the neck. The CT scan highlights the radiologic appearance of these landmarks: the hyoid bone appears as a high-attenuation U-shaped structure, and the thyroid gland exhibits homogenous enhancement inferior to the thyroid cartilage. This comparison demonstrates the clinical relevance of embryological pathways in understanding the location of thyroglossal duct cysts, which can occur anywhere along this midline tract.
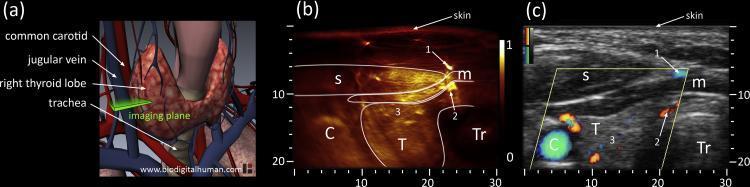
This composite educational graphic illustrates the cross-sectional anatomy of the anterior neck, focusing on the left thyroid lobe through three modalities: (a) a 3D anatomical diagram, (b) an optoacoustic image, and (c) a correlative ultrasound with Directional Power Doppler. The 3D diagram establishes the spatial orientation of the common carotid artery, jugular vein, trachea, and thyroid lobe. The optoacoustic cross-section (b) displays high-sensitivity vascular mapping, identifying the sternocleidomastoid (s) and infrahyoid (m) muscles, the carotid artery (C), and the trachea (Tr). Intraglandular vascularity (3) and superficial vessels (1, 2) are highlighted in a high-contrast heatmap. The corresponding ultrasound image (c) provides structural grayscale context with superimposed Doppler signals (red and blue) indicating blood flow direction. This multimodal comparison demonstrates how optoacoustic imaging provides superior visualization of microvascular networks within the thyroid gland (T) compared to standard Doppler ultrasound, while maintaining consistent anatomical landmarks such as the trachea's medial position and the lateral placement of the carotid artery.
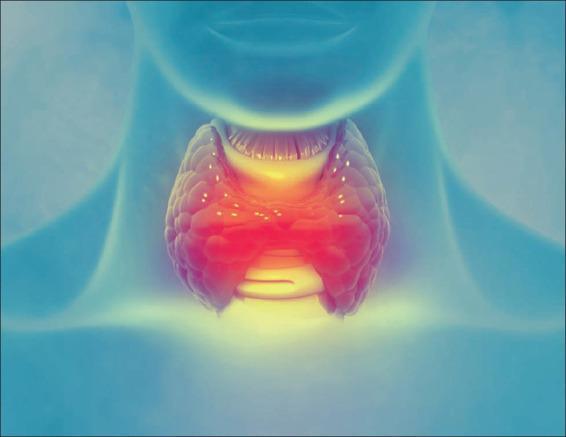
Anatomical diagram depicting the thyroid gland situated in the anterior neck, inferior to the larynx. The illustration utilizes a stylized, translucent blue silhouette of a human neck and torso as a background to provide anatomical context. The central focus is a bipedal, butterfly-shaped organ representing the thyroid gland, characterized by its right and left lobes connected by a central isthmus. The gland is rendered with a textured, lobulated surface and a vibrant color gradient ranging from deep red in the center to bright yellow at the superior and inferior margins, simulating metabolic activity or localized inflammation. Visible above the thyroid is the laryngeal prominence, and the tracheal rings are suggested beneath the isthmus. The image is designed for educational purposes to demonstrate the anatomical positioning of the thyroid gland within the endocrine system and its relationship to airway structures. It serves as a visual aid for discussions on thyroid disorders such as goiter, hyperthyroidism, or thyroiditis.
thyroid hormone synthesis TRH TSH feedback axis
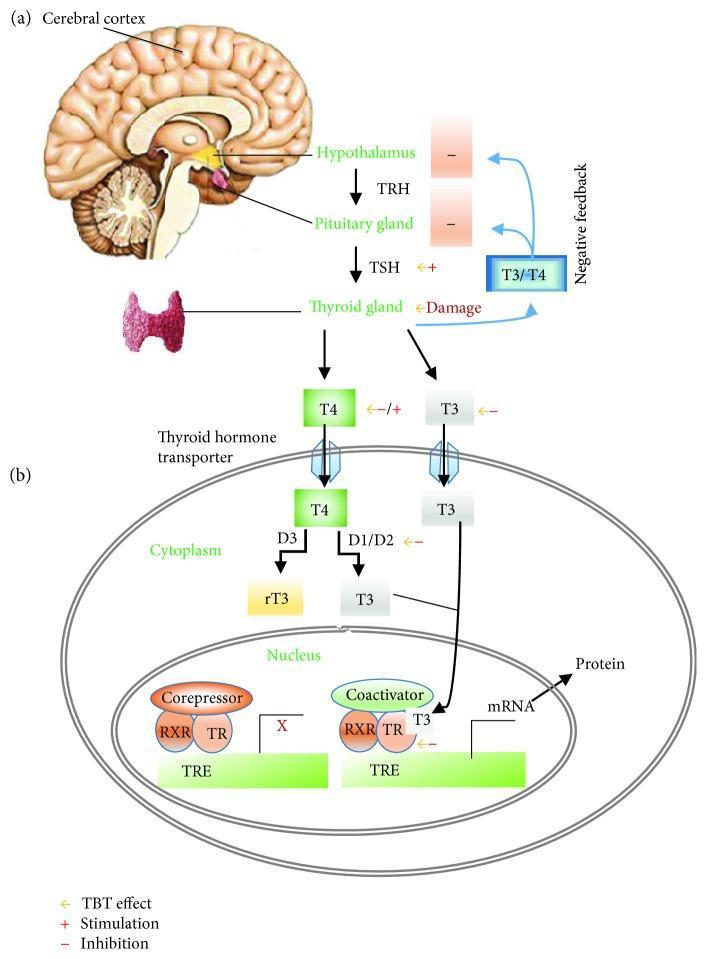
A two-part medical illustration depicting the pathophysiology of the Hypothalamic-Pituitary-Thyroid (HPT) axis and cellular thyroid hormone action. Section (a) shows the systemic HPT axis, beginning with the cerebral cortex and hypothalamus. The hypothalamus releases thyrotropin-releasing hormone (TRH), which stimulates the pituitary gland to secrete thyroid-stimulating hormone (TSH). TSH subsequently acts on the thyroid gland to stimulate the production of T4 and T3 hormones, which exert negative feedback on the hypothalamus and pituitary. Section (b) details the intracellular mechanism of action within a target cell. T4 and T3 enter the cell via thyroid hormone transporters. In the cytoplasm, deiodinases (D1/D2) convert T4 to T3, while D3 converts T4 to inactive reverse T3 (rT3). T3 enters the nucleus, binding to the thyroid hormone receptor (TR) which heterodimerizes with the retinoid X receptor (RXR). This complex binds to the thyroid hormone response element (TRE) on DNA, displacing corepressors and recruiting coactivators to initiate gene transcription (mRNA) and subsequent protein synthesis. The diagram also highlights potential sites of endocrine disruption (e.g., by Tributyltin/TBT), including receptor inhibition and deiodinase interference.
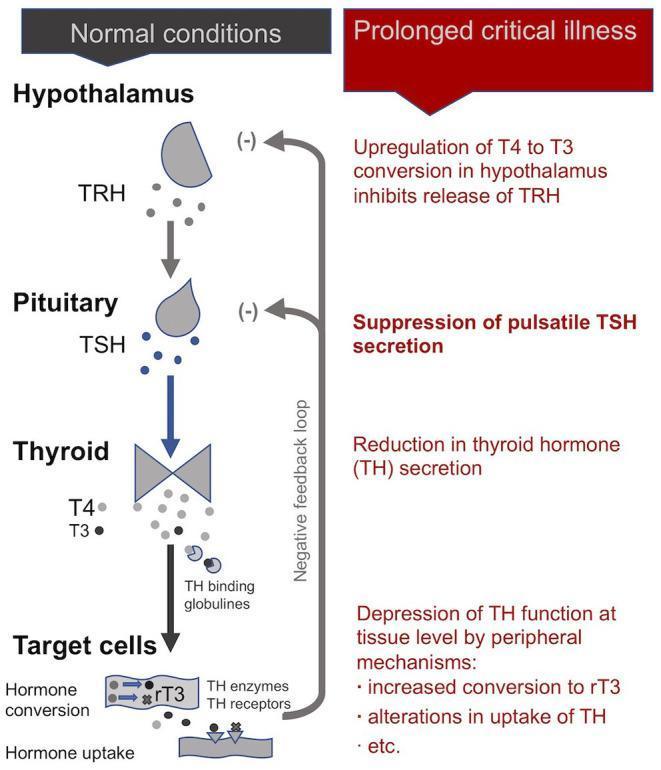
This pathophysiology diagram illustrates the Hypothalamic-Pituitary-Thyroid (HPT) axis, comparing normal physiological conditions with the alterations observed during prolonged critical illness. The 'Normal conditions' section shows the standard cascade: the Hypothalamus secretes TRH, which stimulates the Pituitary to release TSH, leading the Thyroid gland to produce T4 and T3. These hormones reach target cells via TH binding globulins for hormone conversion and uptake, with a negative feedback loop inhibiting TRH and TSH secretion. In contrast, the 'Prolonged critical illness' section details the central and peripheral suppression of the axis. Key pathological features include: upregulation of T4 to T3 conversion in the hypothalamus (inhibiting TRH release), suppression of pulsatile TSH secretion by the pituitary, reduced thyroid hormone secretion, and depression of thyroid function at the tissue level. Peripheral mechanisms shown include increased conversion to inactive rT3 and altered hormone uptake. This comparison illustrates the endocrine maladaptation typical of Non-Thyroidal Illness Syndrome (NTIS) in intensive care settings.
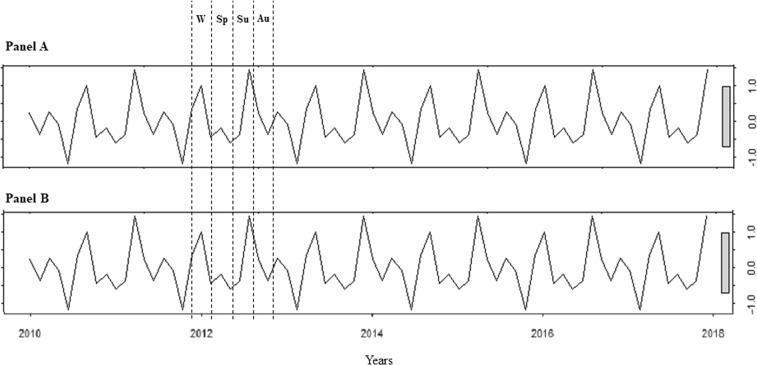
This Comparison Chart consists of two time-series plots (Panel A and Panel B) illustrating the seasonal distribution of Thyroid-stimulating hormone (TSH) levels from 2010 to 2018. Panel A represents data for males, while Panel B represents data for females. Both panels utilize an ARIMA (0, 0, 0) model to highlight cyclical patterns. The x-axis represents the time in years, and the right-hand y-axis shows a standardized scale ranging from -1.0 to 1.0. Vertical dashed lines around the year 2012 label the four seasons: 'W' (winter), 'Sp' (spring), 'Su' (summer), and 'Au' (autumn). The plots demonstrate a clear, repeating seasonal fluctuation in TSH serum levels, characterized by prominent peaks occurring during the summer and winter months and troughs typically observed in spring and autumn. The visual data indicates that despite individual variation, there is a consistent, statistically significant seasonal rhythm in thyroid function across both biological sexes, which is relevant for the clinical interpretation of thyroid function tests throughout the year.
Thyroid Gland - Anatomy & Physiology
Gross Anatomy
- Two lateral lobes - covering the anterolateral surfaces of the trachea, cricoid cartilage, and lower thyroid cartilage
- Isthmus - connects the two lobes across the anterior surfaces of the 2nd and 3rd tracheal cartilages
- Pyramidal lobe - a variable superior extension present in some individuals, arising from the isthmus along the path of the thyroglossal duct

Embryology
- The foramen cecum of the tongue marks the site of origin
- The thyroglossal duct traces the path of descent; it normally disappears, but remnants may persist as a thyroglossal duct cyst or fistula
- Ectopic thyroid tissue can occur anywhere along this path (lingual thyroid, cervical thyroid)

Vascular Supply
Arterial Supply
| Artery | Origin | Distribution |
|---|---|---|
| Superior thyroid artery | First branch of external carotid artery | Anterior & posterior glandular branches to superior pole |
| Inferior thyroid artery | Thyrocervical trunk (from subclavian artery) | Inferior and ascending branches; also supplies parathyroids |
| Thyroid ima artery (variable) | Brachiocephalic trunk or aortic arch | Ascends on anterior trachea; present in ~10% |
Venous Drainage
- Superior thyroid vein - drains into the internal jugular vein
- Middle thyroid vein - drains into the internal jugular vein
- Inferior thyroid veins - empty into the right and left brachiocephalic veins
Lymphatic Drainage
- Paratracheal nodes
- Deep cervical nodes inferior to the omohyoid, along the internal jugular vein
Important Anatomical Relations
Recurrent Laryngeal Nerves (RLN)
- Right RLN: loops around the right subclavian artery
- Left RLN: loops around the arch of the aorta (longer course)
External Laryngeal Nerve
Parathyroid Glands
Histology
- Each follicle is a rounded structure lined by simple follicular epithelium (thyrocytes)
- The central lumen is filled with colloid - a gelatinous acidophilic material consisting largely of thyroglobulin (a 660 kDa glycoprotein), the precursor for thyroid hormones
- The thyroid is the only endocrine gland that stores its secretory product extracellularly, in the colloid - enough to supply the body for up to 3 months
- The gland is covered by a fibrous capsule with septa carrying blood vessels, nerves, and lymphatics
Two Cell Types
| Cell Type | Location | Function |
|---|---|---|
| Thyrocytes (follicular cells) | Wall of follicle | Synthesize T3 and T4; shape varies from squamous (inactive) to columnar (active) |
| Parafollicular C cells | Within or between follicles | Secrete calcitonin (polypeptide involved in calcium metabolism) |
Hormone Synthesis & Physiology
- T4 (thyroxine / tetraiodothyronine) - major secretory product; a pro-hormone
- T3 (triiodothyronine) - 3-4x more biologically active than T4; largely produced by peripheral conversion of T4
HPT Axis (Hypothalamic-Pituitary-Thyroid)

- Hypothalamus releases TRH (thyrotropin-releasing hormone)
- TRH stimulates the anterior pituitary to release TSH (thyroid-stimulating hormone)
- TSH stimulates the thyroid to produce and release T3 and T4
- Negative feedback: T3/T4 inhibit both hypothalamus and pituitary to regulate levels
Intracellular Mechanism
- T3/T4 are lipophilic - they cross cell membranes and bind intracellular receptors
- T4 is converted to T3 in peripheral tissues by deiodinases (D1/D2)
- T3 binds thyroid hormone receptors (TR) that heterodimerize with RXR, bind to thyroid hormone response elements (TRE) on DNA, and regulate gene transcription
Key Physiological Actions of Thyroid Hormones
| System | Effect |
|---|---|
| Metabolism | Increase BMR; increase O2 consumption |
| Cardiovascular | Increase heart rate and cardiac output |
| CNS | Essential for normal brain development (fetal/neonatal) |
| Bone | Required for normal growth and ossification |
| GI | Increase gut motility |
| Thermogenesis | Increase heat production |
- Gray's Anatomy for Students, pp. 1157-1159
- Junqueira's Basic Histology, pp. 1034-1036
- Robbins, Cotran & Kumar Pathologic Basis of Disease