
axillary nerve explain ,
axillary nerve anatomy brachial plexus diagram
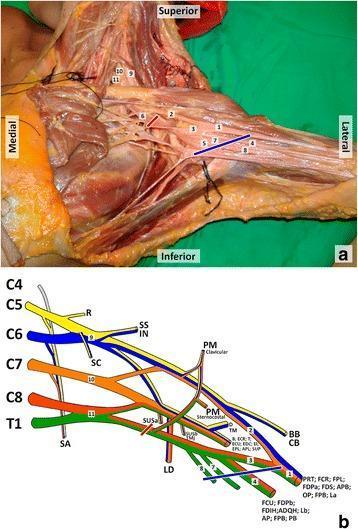
This composite educational resource details the anatomy and innervation of the brachial plexus. Panel (a) is a cadaveric dissection of the left axillary region. Key structures are labeled numerically: the median nerve (1), lateral and medial roots of the median nerve (2, 3), ulnar nerve (4), axillary artery (5), and axillary vein (6), alongside the medial cutaneous nerves of the arm (7) and forearm (8). In the supraclavicular region, the upper (9), middle (10), and lower (11) trunks are identified. Red and blue lines indicate proximal and distal bounds of a clinical lesion site. Panel (b) is a color-coded schematic diagram illustrating the brachial plexus architecture from roots (C5-T1) to terminal branches. It maps specific nerves to their target muscles, including the serratus anterior, deltoid, biceps brachii, and the intrinsic muscles of the hand. This content is designed for medical students and surgical residents to understand the relationship between neuroanatomical structures, their physiological territories, and the clinical correlation of axillary nerve injuries.
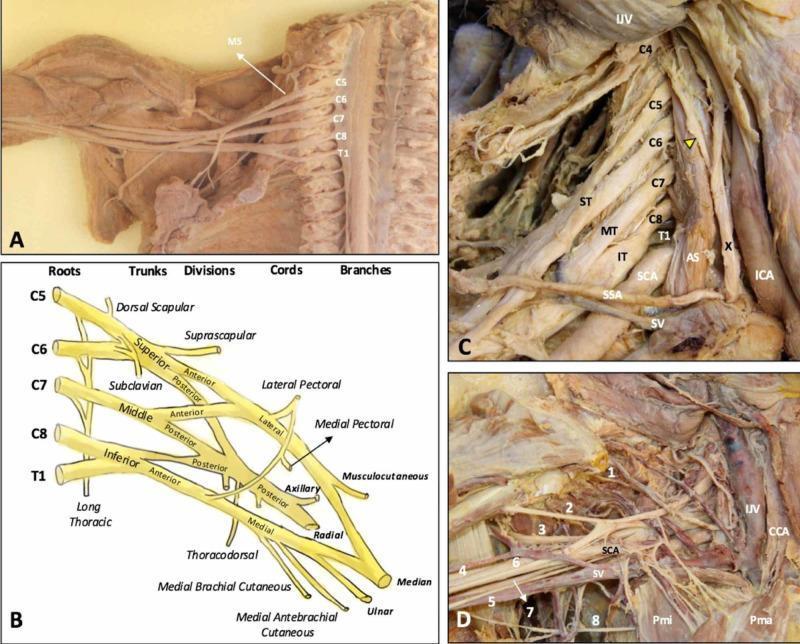
This composite educational graphic details the anatomy of the human brachial plexus (BP) through cadaveric dissections and a schematic diagram. (A) Cadaveric dissection of the cervical spine and axilla with the anterior scalene muscle removed, exposing the C5-T1 nerve roots emerging laterally to the middle scalene muscle (MS). (B) A structured schematic diagram illustrating the hierarchical organization of the BP from roots (C5-T1), trunks (Superior, Middle, Inferior), divisions (Anterior, Posterior), and cords (Lateral, Posterior, Medial) to terminal branches. (C) Dissection showing the roots in situ within the scalene triangle, formed between the anterior (AS) and middle scalene muscles, alongside major vessels including the subclavian artery (SCA) and internal jugular vein (IJV). The phrenic nerve (yellow arrowhead) is seen traversing the anterior scalene. (D) Detailed view of the infraclavicular and axillary regions showing terminal branches (1-8: suprascapular, musculocutaneous, axillary, radial, medial brachial cutaneous, median, ulnar, and intercostobrachial nerves) in relationship to the pectoralis minor (Pmi), pectoralis major (Pma), and subclavian vessels. This content provides essential topographical and clinical anatomy for understanding thoracic outlet syndrome and regional anesthesia.
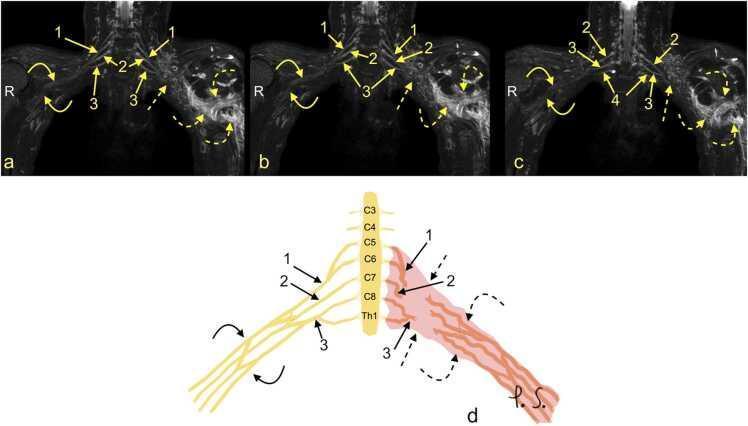
This composite educational resource comprises three Magnetic Resonance Neurography (MRN) coronal views (a, b, c) and a correlating schematic anatomical diagram (d) illustrating a severe traumatic brachial plexus injury. The right side of the images displays normal brachial plexus anatomy, with continuous nerve structures including the upper trunk (1), middle trunk (2), C8 root (3), and Th1 root (4). In contrast, the left side demonstrates a total rupture of the brachial plexus (dashed arrows). This injury is characterized by the complete discontinuity of the neural trunks and cords, accompanied by a large axillary cavity hematoma (curved dashed arrows). The schematic (d) highlights the side-to-side difference, showing the organized right-sided roots (C5-Th1) and trunks versus the disorganized, hemorrhagic area on the left. This material is designed for advanced medical education in radiology and neurosurgery, focusing on diagnostic imaging features of high-grade nerve trauma, specifically Seddon grade 3-5 injuries (neurotmesis) and the identification of postganglionic plexopathy.
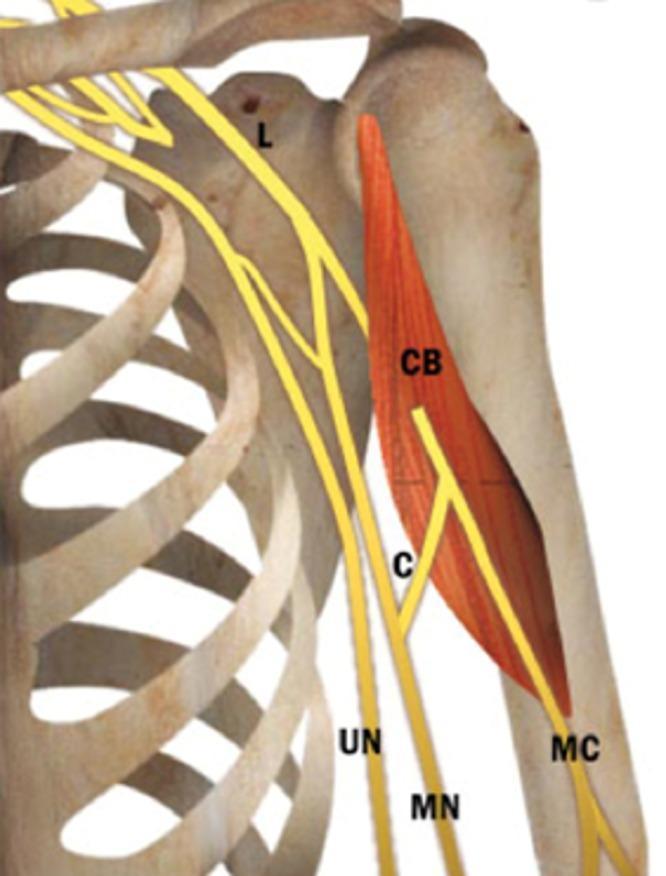
This anatomical diagram illustrates a common neuroanatomical variation of the brachial plexus in the upper limb, specifically the shoulder and proximal humerus region. The visual features the skeletal framework of the rib cage, clavicle, and humerus, with the coracobrachialis muscle (CB) highlighted in red. The neural structures are depicted in yellow, demonstrating the relationship between the musculocutaneous nerve (MC), median nerve (MN), and ulnar nerve (UN). A significant anatomical variant is shown: a communicating branch (C) originating from the musculocutaneous nerve distal to its exit from the coracobrachialis muscle. This branch travels medially and distally to join the median nerve. This illustration is an educational resource for medical students and clinicians to understand variations in peripheral nerve anatomy, which is critical for surgical planning in the axillary region and for interpreting unusual clinical presentations of peripheral nerve injuries.
axillary nerve injury deltoid wasting quadrangular space
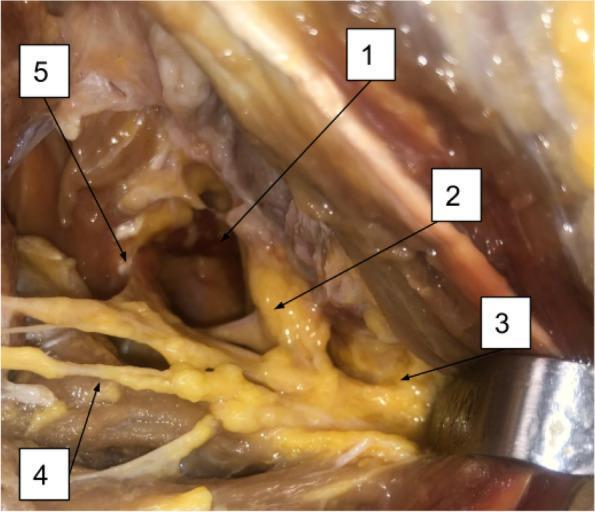
This clinical photograph displays a posterior surgical dissection of the human shoulder, highlighting the neurovascular anatomy of the quadrangular space (1). The primary structure shown is the axillary nerve (2), which is visualized traversing the quadrangular space. The image demonstrates the branching patterns of the axillary nerve, specifically identifying the muscular branch to the deltoid muscle (3) and the muscular branch to the teres minor muscle (4). Additionally, an articular branch of the axillary nerve (5) is visible, showing its course toward the glenohumeral joint. The dissection reveals the spatial relationships between these neural structures and the surrounding musculature, including the deltoid and teres minor. This anatomical view is essential for understanding the distribution of the axillary nerve and its potential sites of compression or injury during posterior surgical approaches to the shoulder or in quadrangular space syndrome.
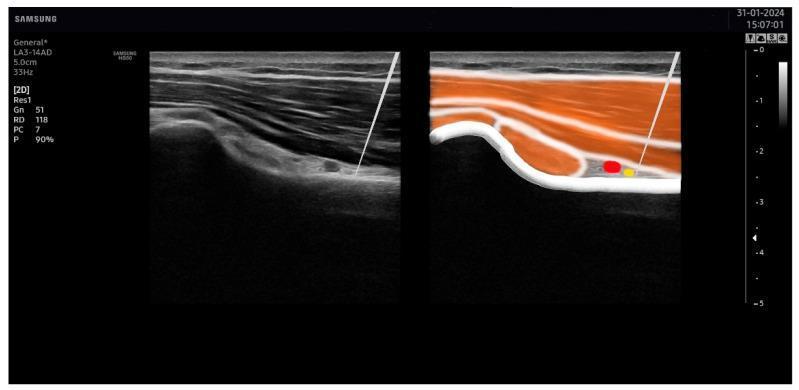
This dual-panel image displays an ultrasound-guided needle placement in the posterior shoulder region, specifically targeting the axillary nerve. The left panel shows a grayscale 2D ultrasound in a longitudinal view of the deltoid muscle and transverse view of the quadrangular space. A hyperechoic, straight line representing the needle is visible using an 'in-plane' technique, penetrating through the moderately echogenic, striated muscle layers. The right panel provides a corresponding color-coded anatomical illustration overlaid on the ultrasound scan to identify key structures: the deltoid and teres minor muscles (orange), the humerus cortical bone (white hyperechoic curve), the axillary artery (red), and the axillary nerve (yellow). The needle tip is precisely positioned adjacent to the yellow-coded axillary nerve, demonstrating the correct clinical procedure for percutaneous electrical nerve stimulation (PENS) or regional anesthesia while avoiding vascular puncture. This educational visual aids in understanding musculoskeletal ultrasound anatomy and needle-to-nerve proximity.
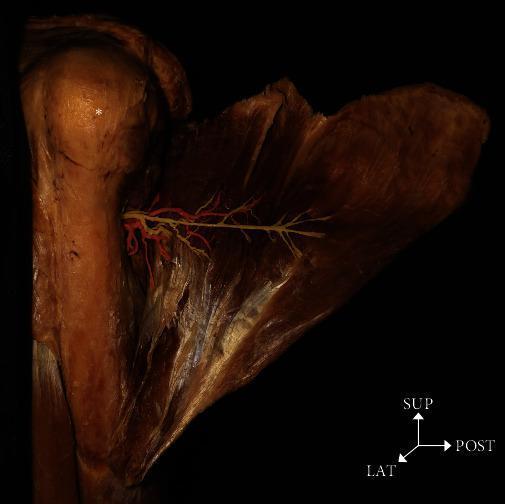
This clinical anatomical photograph displays a deep dissection of a left shoulder from a posterior-lateral perspective, illustrating the neurovascular supply to the deltoid muscle. The head of the humerus is visible superiorly (marked with an asterisk). The dissection reveals the axillary nerve and the posterior circumflex humeral artery (PCHA) emerging through the quadrangular space to traverse the medial surface of the deltoid. For educational clarity, the axillary nerve is color-coded yellow and sits superior to the PCHA, which is color-coded red. Both structures exhibit a horizontal branching pattern across the striated muscle fibers. Orientation indicators (SUP: superior, LAT: lateral, POST: posterior) are provided to establish the spatial context of the surgical neck region. This image serves as a high-fidelity anatomical reference for understanding the spatial relationships and branching density of neurovascular structures during orthopedic or surgical approaches to the humerus and shoulder joint.
Axillary Nerve
Origin and Root Value
- Adams and Victor's Principles of Neurology, 12th Ed
- Gray's Anatomy for Students
Course and Relations
-
In the axilla - Initially lies superficial to the subscapularis muscle, running for about 3.5 cm from its origin to the lateral border of subscapularis. It is unbranched at this stage and is composed of a single monofascicular segment.
-
Quadrangular (Quadrilateral) Space - The nerve exits the axilla by passing through the quadrangular space in the posterior wall of the axilla. This space is bounded by:
- Superiorly: teres minor
- Inferiorly: teres major
- Medially: long head of triceps brachii
- Laterally: surgical neck of humerus
-
Around the Surgical Neck - Together with the posterior circumflex humeral artery and vein, the nerve winds closely around the posterior surface of the surgical neck of the humerus. This is its most clinically vulnerable point.
-
Terminal branching - The nerve divides about 3.5 cm proximal to the quadrangular space into anterior and posterior divisions.
- Gray's Anatomy for Students, p. 839
- Imaging Anatomy: Bones, Joints, Vessels and Nerves
Branches and Motor Supply
Anterior Branch
- Runs anterolaterally within the deep surface of the deltoid
- Supplies the anterior, middle, and occasionally the posterior deltoid
- Measures approximately 5.5 cm to the tip of the humerus
- Also frequently provides an articular branch to the glenohumeral joint capsule
Posterior Branch
- Gives a branch to teres minor (typically 2 cm long, usually 2 fascicles)
- Gives branches to the posterior deltoid
- Terminates as the superior (superolateral) lateral cutaneous nerve of the arm - the sensory branch
Summary of Motor Supply
| Muscle | Action |
|---|---|
| Deltoid (anterior, middle, posterior heads) | Shoulder abduction, flexion, extension, rotation |
| Teres minor | External rotation; stabilizes humeral head (part of rotator cuff) |
Sensory Supply
- The cutaneous branch traverses the deltoid fascia approximately 6.3-10.9 cm below the posterolateral corner of the acromion, along the medial border of the deltoid.
Clinical Anatomy - Injury
Common Causes
-
Fractures of the surgical neck of the humerus - the nerve's direct relation to this bone makes it vulnerable
-
Anterior dislocation of the shoulder joint - nerve is stretched as the humeral head displaces anteroinferiorly
-
Direct blows to the shoulder
-
Penetrating wounds
-
Iatrogenic injury - posterior surgical approach to the shoulder, shoulder arthroscopy
-
Campbell's Operative Orthopaedics, 15th Ed 2026, p. 3866
Features of Axillary Nerve Palsy
- Deltoid paralysis - inability to actively abduct the arm
- Important note: full abduction is still possible in complete deltoid paralysis due to supraspinatus action and scapular rotation. Therefore, always palpate and observe the deltoid for contraction during examination.
- Teres minor weakness - impaired external rotation
- Wasting of deltoid - shoulder loses its normal rounded contour, producing a "flattened shoulder"
- Sensory loss - over the lateral deltoid region ("regimental badge" area). However, sensory loss may be absent in some lesions, so diagnosis must sometimes rest solely on deltoid function.
Quadrangular Space Syndrome
- Fibrous bands, muscle hypertrophy, or fibrosis at the muscle edges
- Aggravated by abduction and external rotation of the humerus
- Chronic shoulder pain and paresthesia (aggravated by forward flexion or abduction + external rotation)
- Atrophy of teres minor (more common) and/or deltoid in chronic cases
- Usually no loss of sensation or strength in early cases
- EMG may be normal
- Gray's Anatomy for Students, p. 839 ("In the Clinic" box)
- Imaging Anatomy, Vol. 3
- Campbell's Operative Orthopaedics, 15th Ed
Examination of Axillary Nerve
-
Ask the patient to abduct the shoulder (elbow flexed at right angle) against resistance
-
Palpate the deltoid simultaneously to detect contraction (important because full abduction can occur even with deltoid paralysis)
-
Test sensation over the lateral shoulder (regimental badge area)
-
EMG/nerve conduction - electrical stimulation along the posterior border of the deltoid
-
S. Das Manual on Clinical Surgery, 13th Ed
Summary Table
| Feature | Detail |
|---|---|
| Root value | C5, C6 |
| Origin | Posterior cord of brachial plexus |
| Key relation | Surgical neck of humerus + posterior circumflex humeral artery |
| Passes through | Quadrangular space |
| Motor supply | Deltoid, teres minor |
| Sensory supply | Lateral shoulder ("regimental badge") via superior lateral cutaneous nerve of arm |
| Common injury | Shoulder dislocation, surgical neck fracture |
| Key clinical sign | Deltoid wasting + loss of shoulder abduction + sensory loss over lateral deltoid |
- Gray's Anatomy for Students - posterior scapular region anatomy
- Adams and Victor's Principles of Neurology, 12th Ed - clinical neurology
- Imaging Anatomy: Bones, Joints, Vessels and Nerves, Vol. 3 - detailed fascicular anatomy
- Campbell's Operative Orthopaedics, 15th Ed 2026 - surgical approach and injury management
- S. Das Manual on Clinical Surgery, 13th Ed - clinical examination
Breast explain as 10mark question anatomy
breast anatomy diagram lobes lymphatic drainage
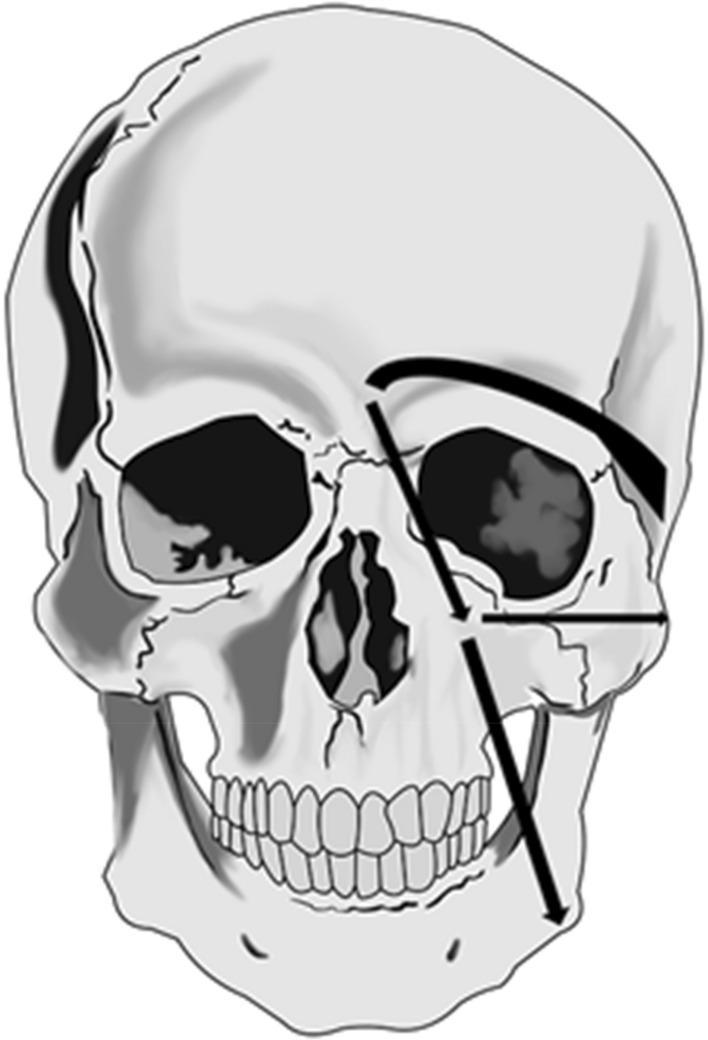
This anatomical diagram presents an anterior view of a human skull overlaid with schematic arrows illustrating facial lymphatic drainage pathways. The illustration focuses on the primary drainage routes from two specific injection sites on the left side of the face (viewer's right). The supra-ocular pathway is shown as a superiorly arching arrow originating above the orbit and directing toward the pre-auricular lymph nodes. The para-nasal pathway originates near the nasal bridge and divides into three distinct directions: inferiorly toward the sub-mandibular lymph nodes, laterally toward the parotid lymph nodes, and superior-laterally toward the pre-auricular lymph nodes. This diagram is utilized in nuclear medicine and clinical anatomy to demonstrate typical patterns of lymphoscintigraphy tracer movement and to highlight the anatomical landmarks (orbit, nasal cavity, mandible) used to map lymphatic flow in patients with facial edema or lymphedema.
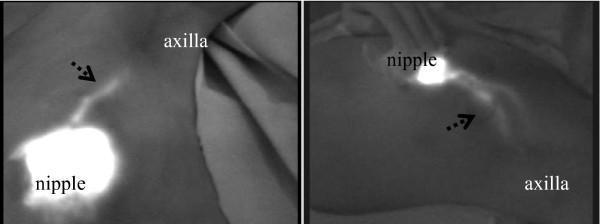
This diagnostic fluorescence image displays two patterns of subcutaneous lymphatic drainage pathways in the human breast, visualized using Indocyanine Green (ICG) fluorescence. Both images demonstrate a high-intensity fluorescent signal at the nipple/subareolar region, representing the injection site. From this origin, linear and slightly tortuous fluorescent streams—indicated by dashed arrows—course towards the axilla (axillary basin). The left image depicts a relatively direct and well-defined pathway, while the right image shows a more diffuse and wider lymphatic channel, potentially illustrating variations in individual anatomy or the merging of multiple lymphatic vessels. The clinical significance of this imagery is the real-time identification of sentinel lymph node drainage pathways, essential for oncological surgical planning and staging. These findings highlight the primary lymphatic flow from the mammary gland towards the axillary lymph nodes, which is a key concept in surgical oncology and breast cancer management.
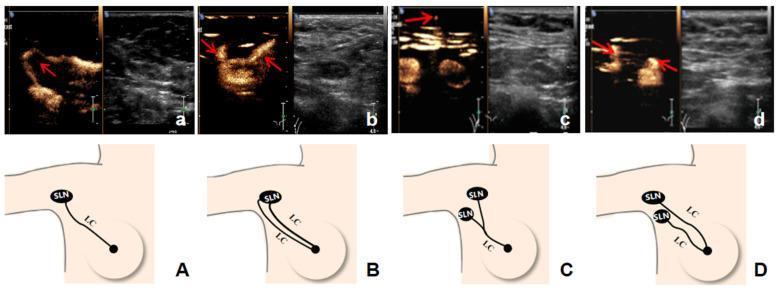
This composite educational graphic illustrates four distinct patterns of axillary lymphatic drainage from the breast to sentinel lymph nodes (SLNs), using Contrast-Enhanced Ultrasound (CEUS) imaging and corresponding anatomical diagrams. The visual material is divided into four sets (A–D), each featuring a split-screen ultrasound image (CEUS and B-mode) alongside a schematic illustration. The primary components described are Lymphatic Channels (LC) and Sentinel Lymph Nodes (SLN). The four patterns shown are: (A) a single LC draining to a single SLN; (B) multiple LCs converging into a single SLN; (C) a single LC branching to multiple SLNs; and (D) multiple LCs draining to multiple separate SLNs. In the CEUS images, the LCs and SLNs are identified by high echogenicity (bright contrast enhancement) indicated by red arrows, facilitating real-time visualization of the drainage pathway. This content is intended for surgical oncology and radiology education, specifically regarding preoperative sentinel lymph node biopsy (SLNB) mapping in breast cancer staging. It demonstrates how CEUS can be used to identify complex lymphatic anatomy that may impact surgical planning.
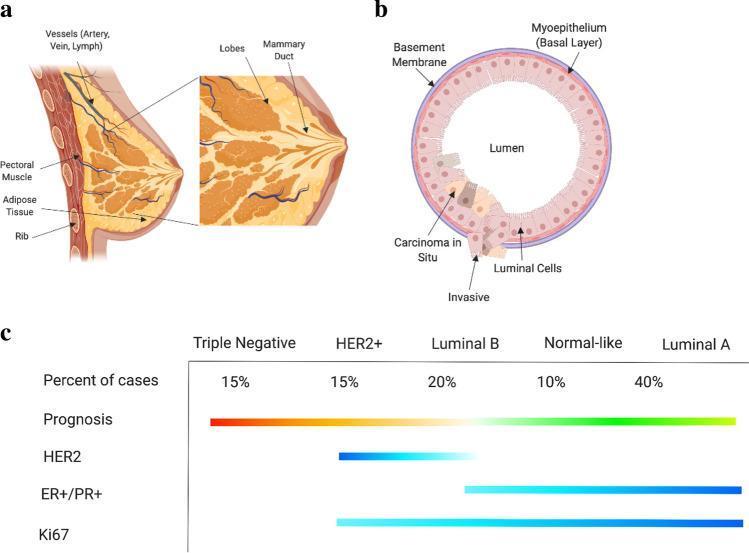
This composite educational infographic illustrates the anatomy of the human breast, its cellular structure, and the molecular subtyping of breast cancer. Panel (a) presents an anatomical diagram of the whole breast in cross-section, labeling the pectoral muscle, ribs, adipose tissue, and the functional unit consisting of lobes and mammary ducts. Panel (b) depicts the cellular anatomy of a mammary duct in cross-section, showing the basement membrane, myoepithelium (basal layer), and luminal cells surrounding a central lumen. It highlights pathological progression from carcinoma in situ to invasive carcinoma, demonstrating the breach of basement membrane integrity. Panel (c) is a comparison chart of breast cancer molecular subtypes: Triple Negative, HER2+, Luminal B, Normal-like, and Luminal A. It correlates these subtypes with clinical and pathological features, including percentage of cases, prognosis (gradient from poor/red to good/green), and the expression levels of key biomarkers such as HER2, ER+/PR+, and Ki67. The visual is designed for medical education regarding oncology subtyping and pathophysiology.
breast lymphatic drainage axillary nodes levels internal mammary
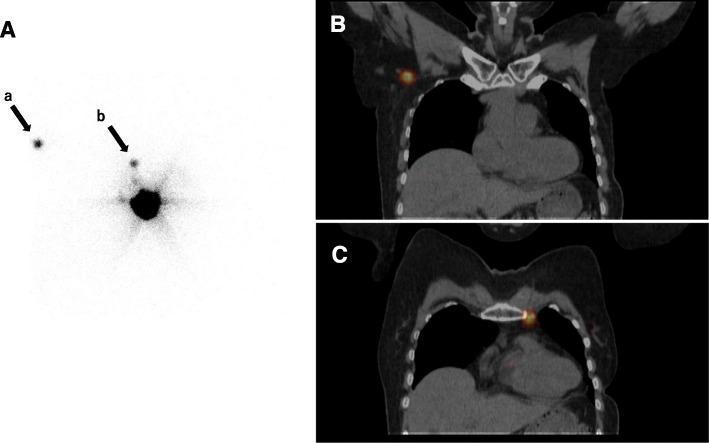
This three-panel composite image displays diagnostic nuclear medicine imaging demonstrating aberrant lymphatic drainage in a patient with ipsilateral breast tumor recurrence (IBTR). Panel A is a planar lymphoscintigraphy image showing a large central area of radiotracer uptake at the injection site. Two secondary foci of uptake are visible: arrow 'a' indicates drainage to the contralateral axilla, and arrow 'b' indicates drainage to the ipsilateral internal mammary chain (IMC). Panels B and C show coronal SPECT/CT fusion images providing anatomical localization for these findings. Panel B demonstrates a 'hot spot' (focal radiotracer uptake) in the right axillary region adjacent to the thoracic wall. Panel C illustrates a 'hot spot' localized to the left internal mammary chain, situated lateral to the sternum. These images illustrate the utility of SPECT/CT in identifying sentinel lymph nodes in non-axillary or contralateral basins, which is clinically significant for staging and surgical planning in recurrent breast cancer cases where normal lymphatic pathways may be surgically disrupted.
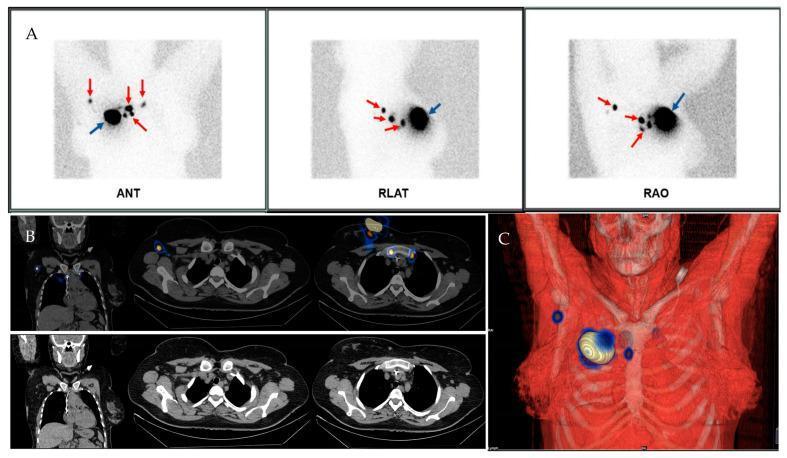
This composite diagnostic image demonstrates sentinel lymph node (SLN) mapping in a 45-year-old female patient with Stage II invasive ductal breast carcinoma. Panel A presents planar lymphoscintigraphy in anterior (ANT), right lateral (RLAT), and right anterior oblique (RAO) views. These views show a high-intensity peritumoural injection site (blue arrow) and multiple smaller, discrete spots of radiotracer uptake representing SLNs (red arrows). Panel B displays fused SPECT/CT imaging in coronal and axial planes, providing anatomical localization of the tracer uptake. This diagnostic modality identifies a complex drainage pattern involving one SLN in the right axillary region and bilateral internal mammary involvement, specifically two nodes on the right and one on the left internal mammary chain. Panel C provides a 3D volumetric rendering, illustrating the spatial relationship between the primary injection site and the lymphatic nodes relative to the thoracic skeletal structures (ribs and sternum). The combination of these modalities highlights the utility of SPECT/CT in resolving complex or ambiguous drainage patterns seen on planar imaging, crucial for precise surgical staging and biopsy planning.
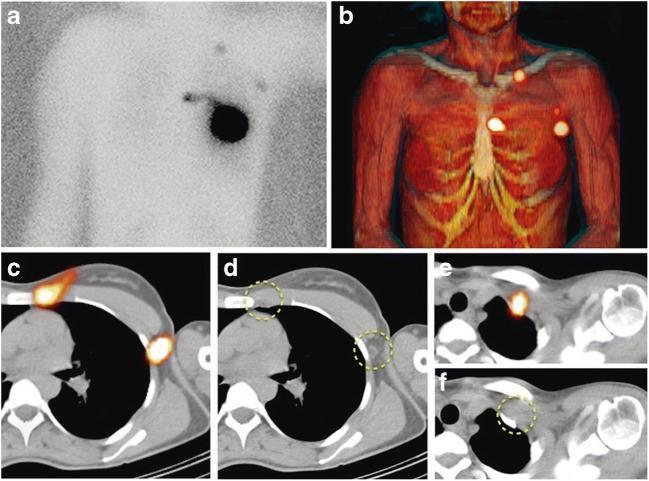
This composite diagnostic image demonstrates preoperative sentinel lymph node (SLN) mapping using 99mTc-nanocolloid SPECT/CT in a 63-year-old woman with breast cancer. Panel (a) shows planar lymphoscintigraphy with body contouring, revealing an intense area of tracer uptake at the intratumoral injection site in the left breast and weaker focal uptake indicating lymphatic drainage to the axillary, periclavicular, and internal mammary chains. Panel (b) presents a 3D surface volume rendering SPECT/CT, which provides a topographic view of the SLNs (bright orange foci) localized relative to the skin surface and skeletal structures. Lower panels (c-f) provide transaxial SPECT/CT and corresponding CT slices, allowing for precise anatomical correlation. These sections localize specific SLNs to the second intercostal space (internal mammary chain), level I of the left axilla, and the retroclavicular region, with yellow dashed circles highlighting the anatomical correlates on the CT images. The study illustrates the incremental value of SPECT/CT in providing high-resolution anatomical localization of sentinel nodes compared to planar scintigraphy.
Anatomy of the Breast (10 Marks)
1. Introduction
2. Position and Surface Anatomy
- Pectoralis major (medially and superiorly)
- Serratus anterior (inferolaterally)
- External abdominal oblique (inferiorly)
- Upper rectus sheath (inferiorly)
- Gray's Anatomy for Students
- Mulholland and Greenfield's Surgery, 7th Ed
3. Structure - Breast Parenchyma
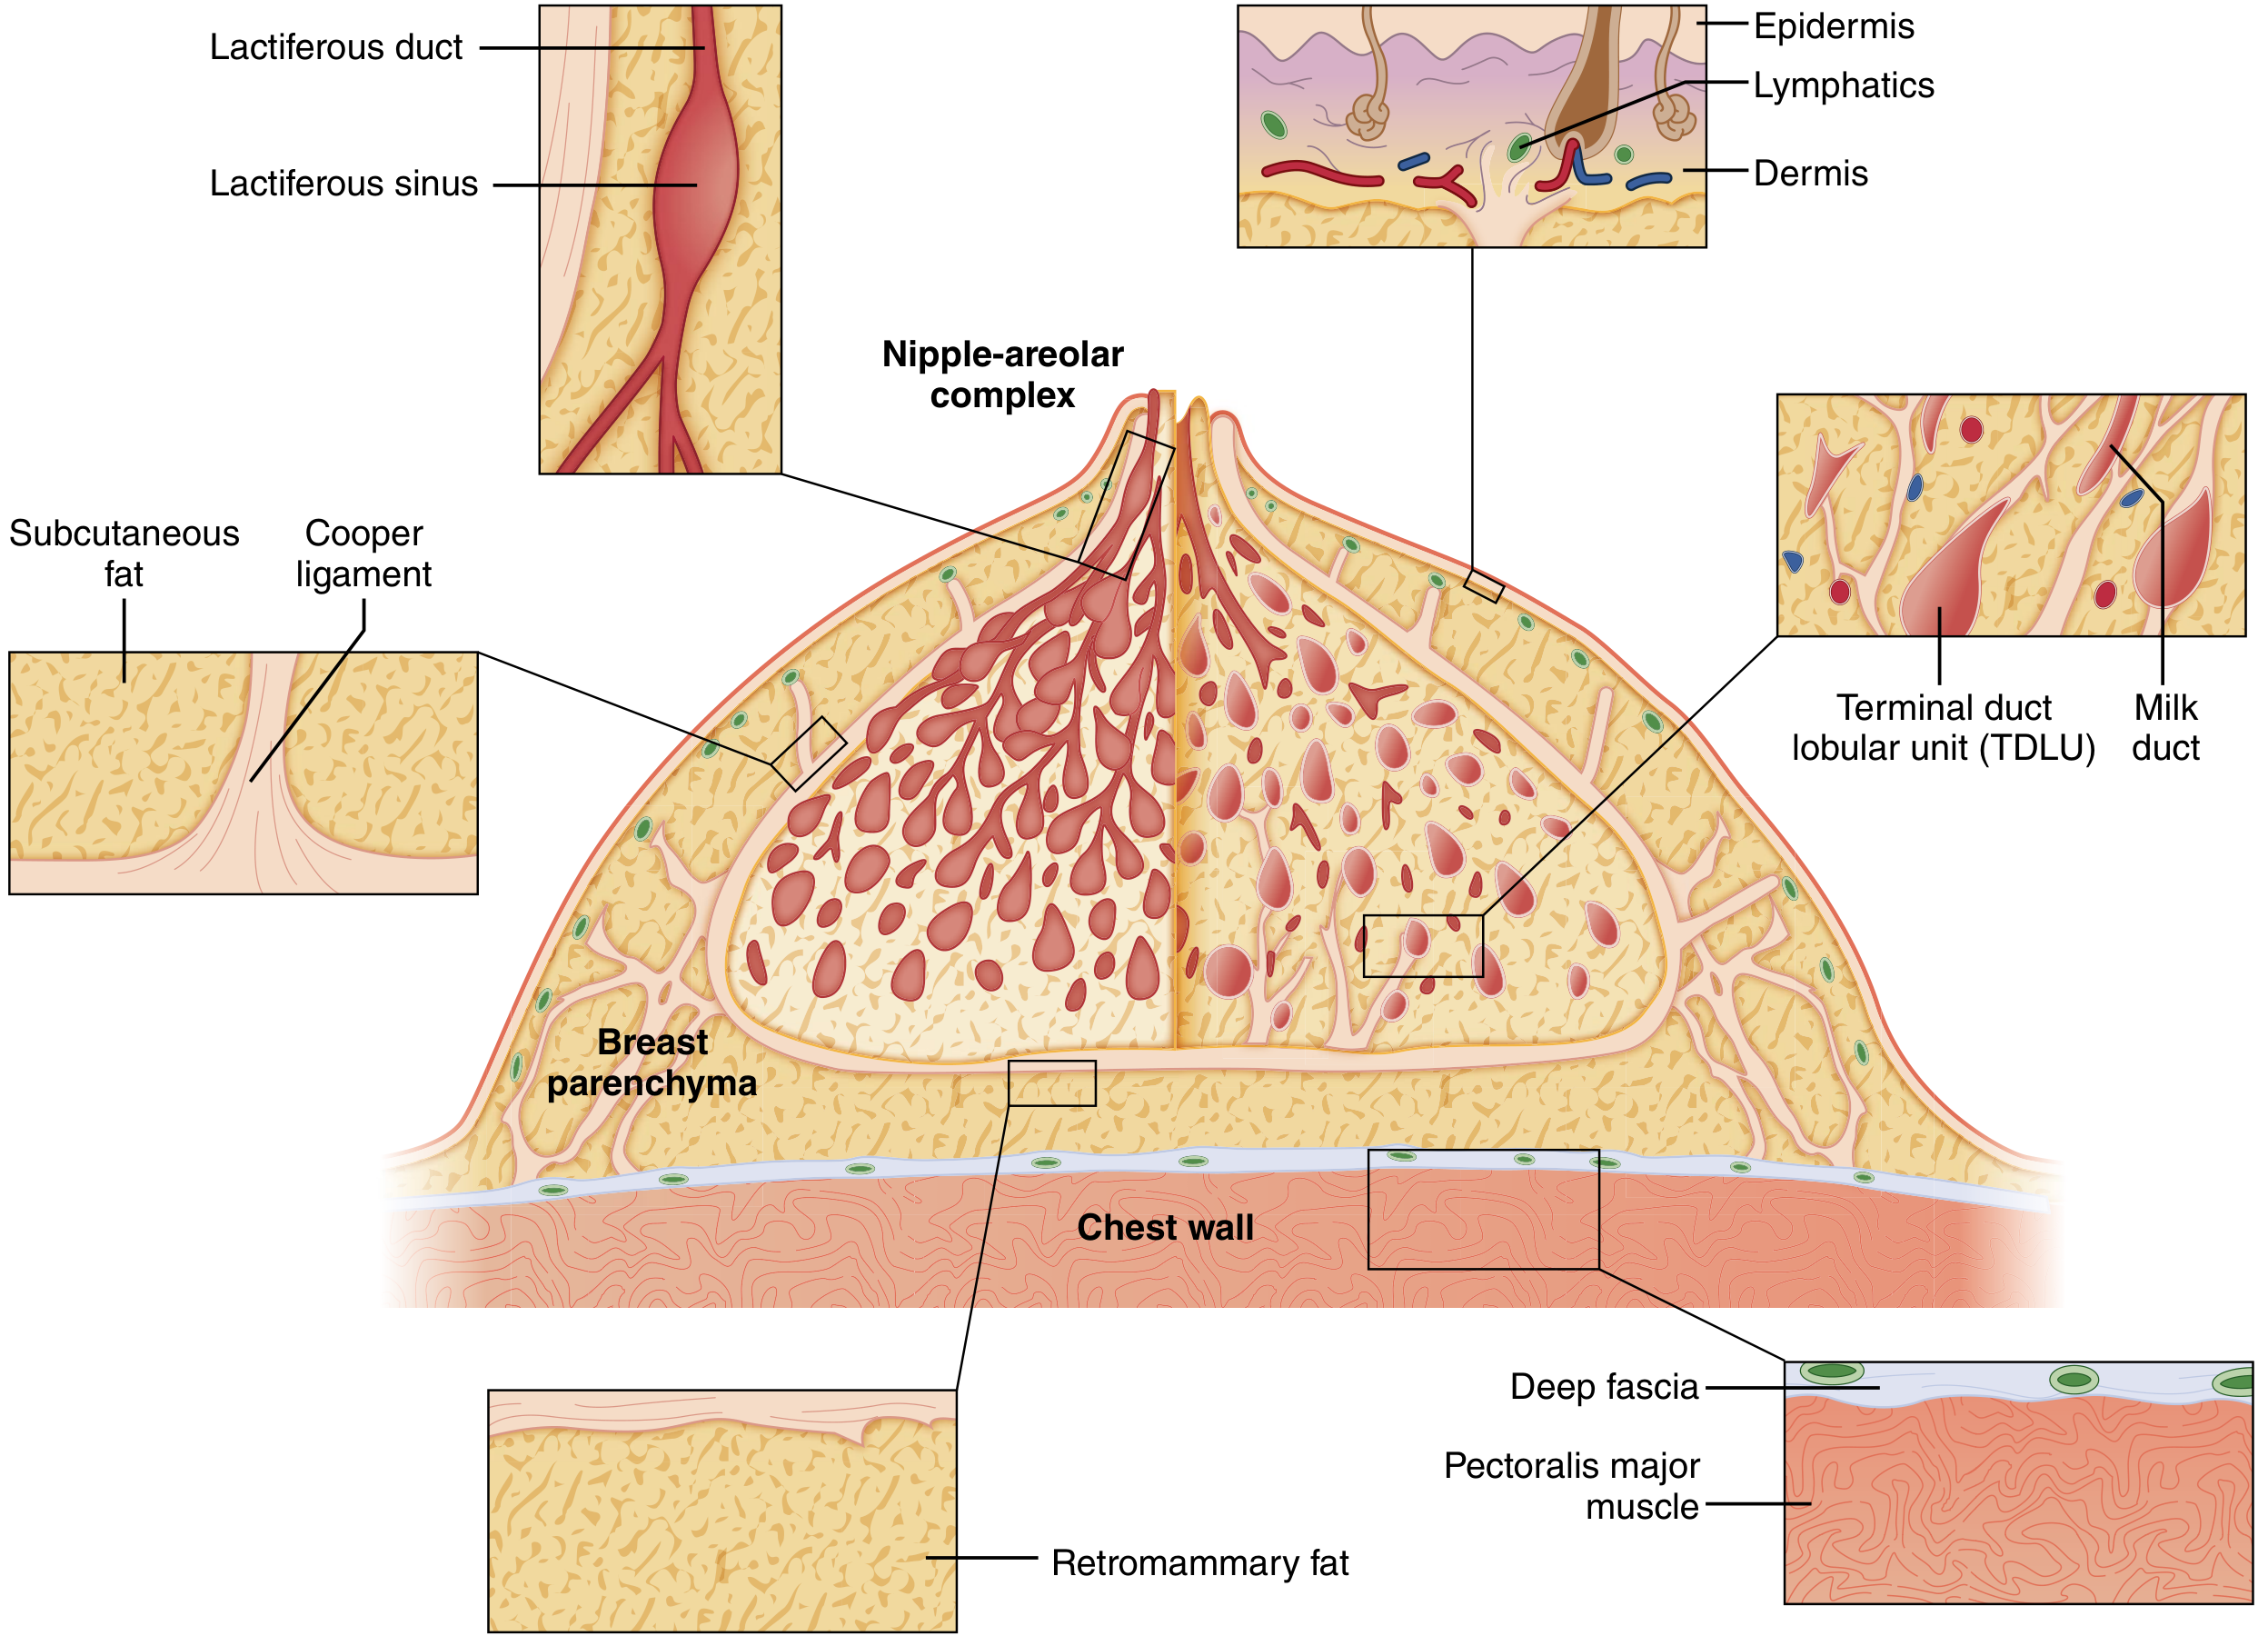
- Glandular epithelium - the functional milk-producing tissue
- Fibrous stroma - connective tissue framework
- Adipose tissue - fills spaces between lobes
Lobes and Lobules
- There are 15-20 lobes of glandular tissue arranged radially around the nipple, separated by connective tissue septa
- Each lobe is composed of 20-40 lobules
- Each lobule contains 10-100 alveoli (acini)
Ductal System
- Each lobe ends in a lactiferous duct
- Just beneath the nipple, each duct dilates to form a lactiferous sinus (ampulla), then constricts again before opening at the nipple surface
- There are 15-20 lactiferous duct openings at the nipple
- The duct system is arranged like an inverted tree, with the largest ducts subareolar and successively smaller ducts at the periphery
Terminal Duct Lobular Unit (TDLU)
- The TDLU (one lobule + its terminal duct) is the basic secretory unit of the breast
- Most malignant breast tumors originate from the TDLU
- Thieme Atlas of Anatomy - General Anatomy and Musculoskeletal System
4. Nipple-Areolar Complex (NAC)
-
The nipple is a cylindrical projection containing 15-20 lactiferous duct openings, numerous free sensory nerve endings, and Meissner corpuscles
-
The areola surrounds the nipple; contains sebaceous glands, sweat glands, and Montgomery glands (accessory areolar glands with nodular elevations called tubercles of Morgagni)
-
Deep to the NAC are bundles of smooth muscle arranged radially, circumferentially, and longitudinally - these allow nipple erection
-
The areola contains Ruffini-like endings and Krause end-bulbs (sensory receptors)
-
The skin of the NAC is highly pigmented stratified squamous epithelium
-
Mulholland and Greenfield's Surgery
5. Suspensory Ligaments of Cooper
-
Fibrous bands that run between the deep fascia (pectoral fascia) and the dermis of the overlying skin
-
They provide shape, support, and mobility to the breast
-
Clinically: infiltration by carcinoma causes puckering/dimpling of the skin
-
Lymphatic obstruction by cancer causes peau d'orange (skin resembles orange peel) due to edema tethered by these ligaments
-
Sabiston Textbook of Surgery
6. Relations and Spaces
- Anteriorly: skin, subcutaneous fat
- Posteriorly: pectoral fascia over pectoralis major; a layer of loose areolar tissue called the retromammary space allows the breast to move freely over the pectoralis fascia
- Deep to pectoralis major: pectoralis minor enclosed in clavipectoral fascia, which fuses laterally with axillary fascia
7. Blood Supply
Arterial Supply
| Artery | Contribution |
|---|---|
| Perforating branches of internal mammary (thoracic) artery | Medial mammary branches from 2nd-4th intercostal spaces; main supply (~60%) |
| Lateral thoracic artery (branch of axillary artery) | Lateral mammary branches |
| Posterior intercostal arteries (2nd-5th) | Direct mammary branches |
| Thoracoacromial artery (pectoral branch) | Minor contribution |
| Superior thoracic artery | Minor contribution |
Venous Drainage
-
Internal mammary veins
-
Posterior intercostal veins (drain to azygos/vertebral venous plexus - route for bone metastasis)
-
Axillary vein tributaries
-
Thieme Atlas; Sabiston; Schwartz's Principles of Surgery
8. Lymphatic Drainage
- Glandular plexus - within the interlobular spaces along lactiferous ducts
- Subareolar plexus - drains skin, nipple, areola, and central gland
- Deep plexus - on the posterior surface of the breast, communicates with deep fascia
Drainage Routes:
- >75% drains to axillary lymph nodes (main route)
- Remaining drains to parasternal (internal mammary) nodes
- Drainage is NOT quadrant-dependent - any quadrant can drain to either axillary or parasternal nodes
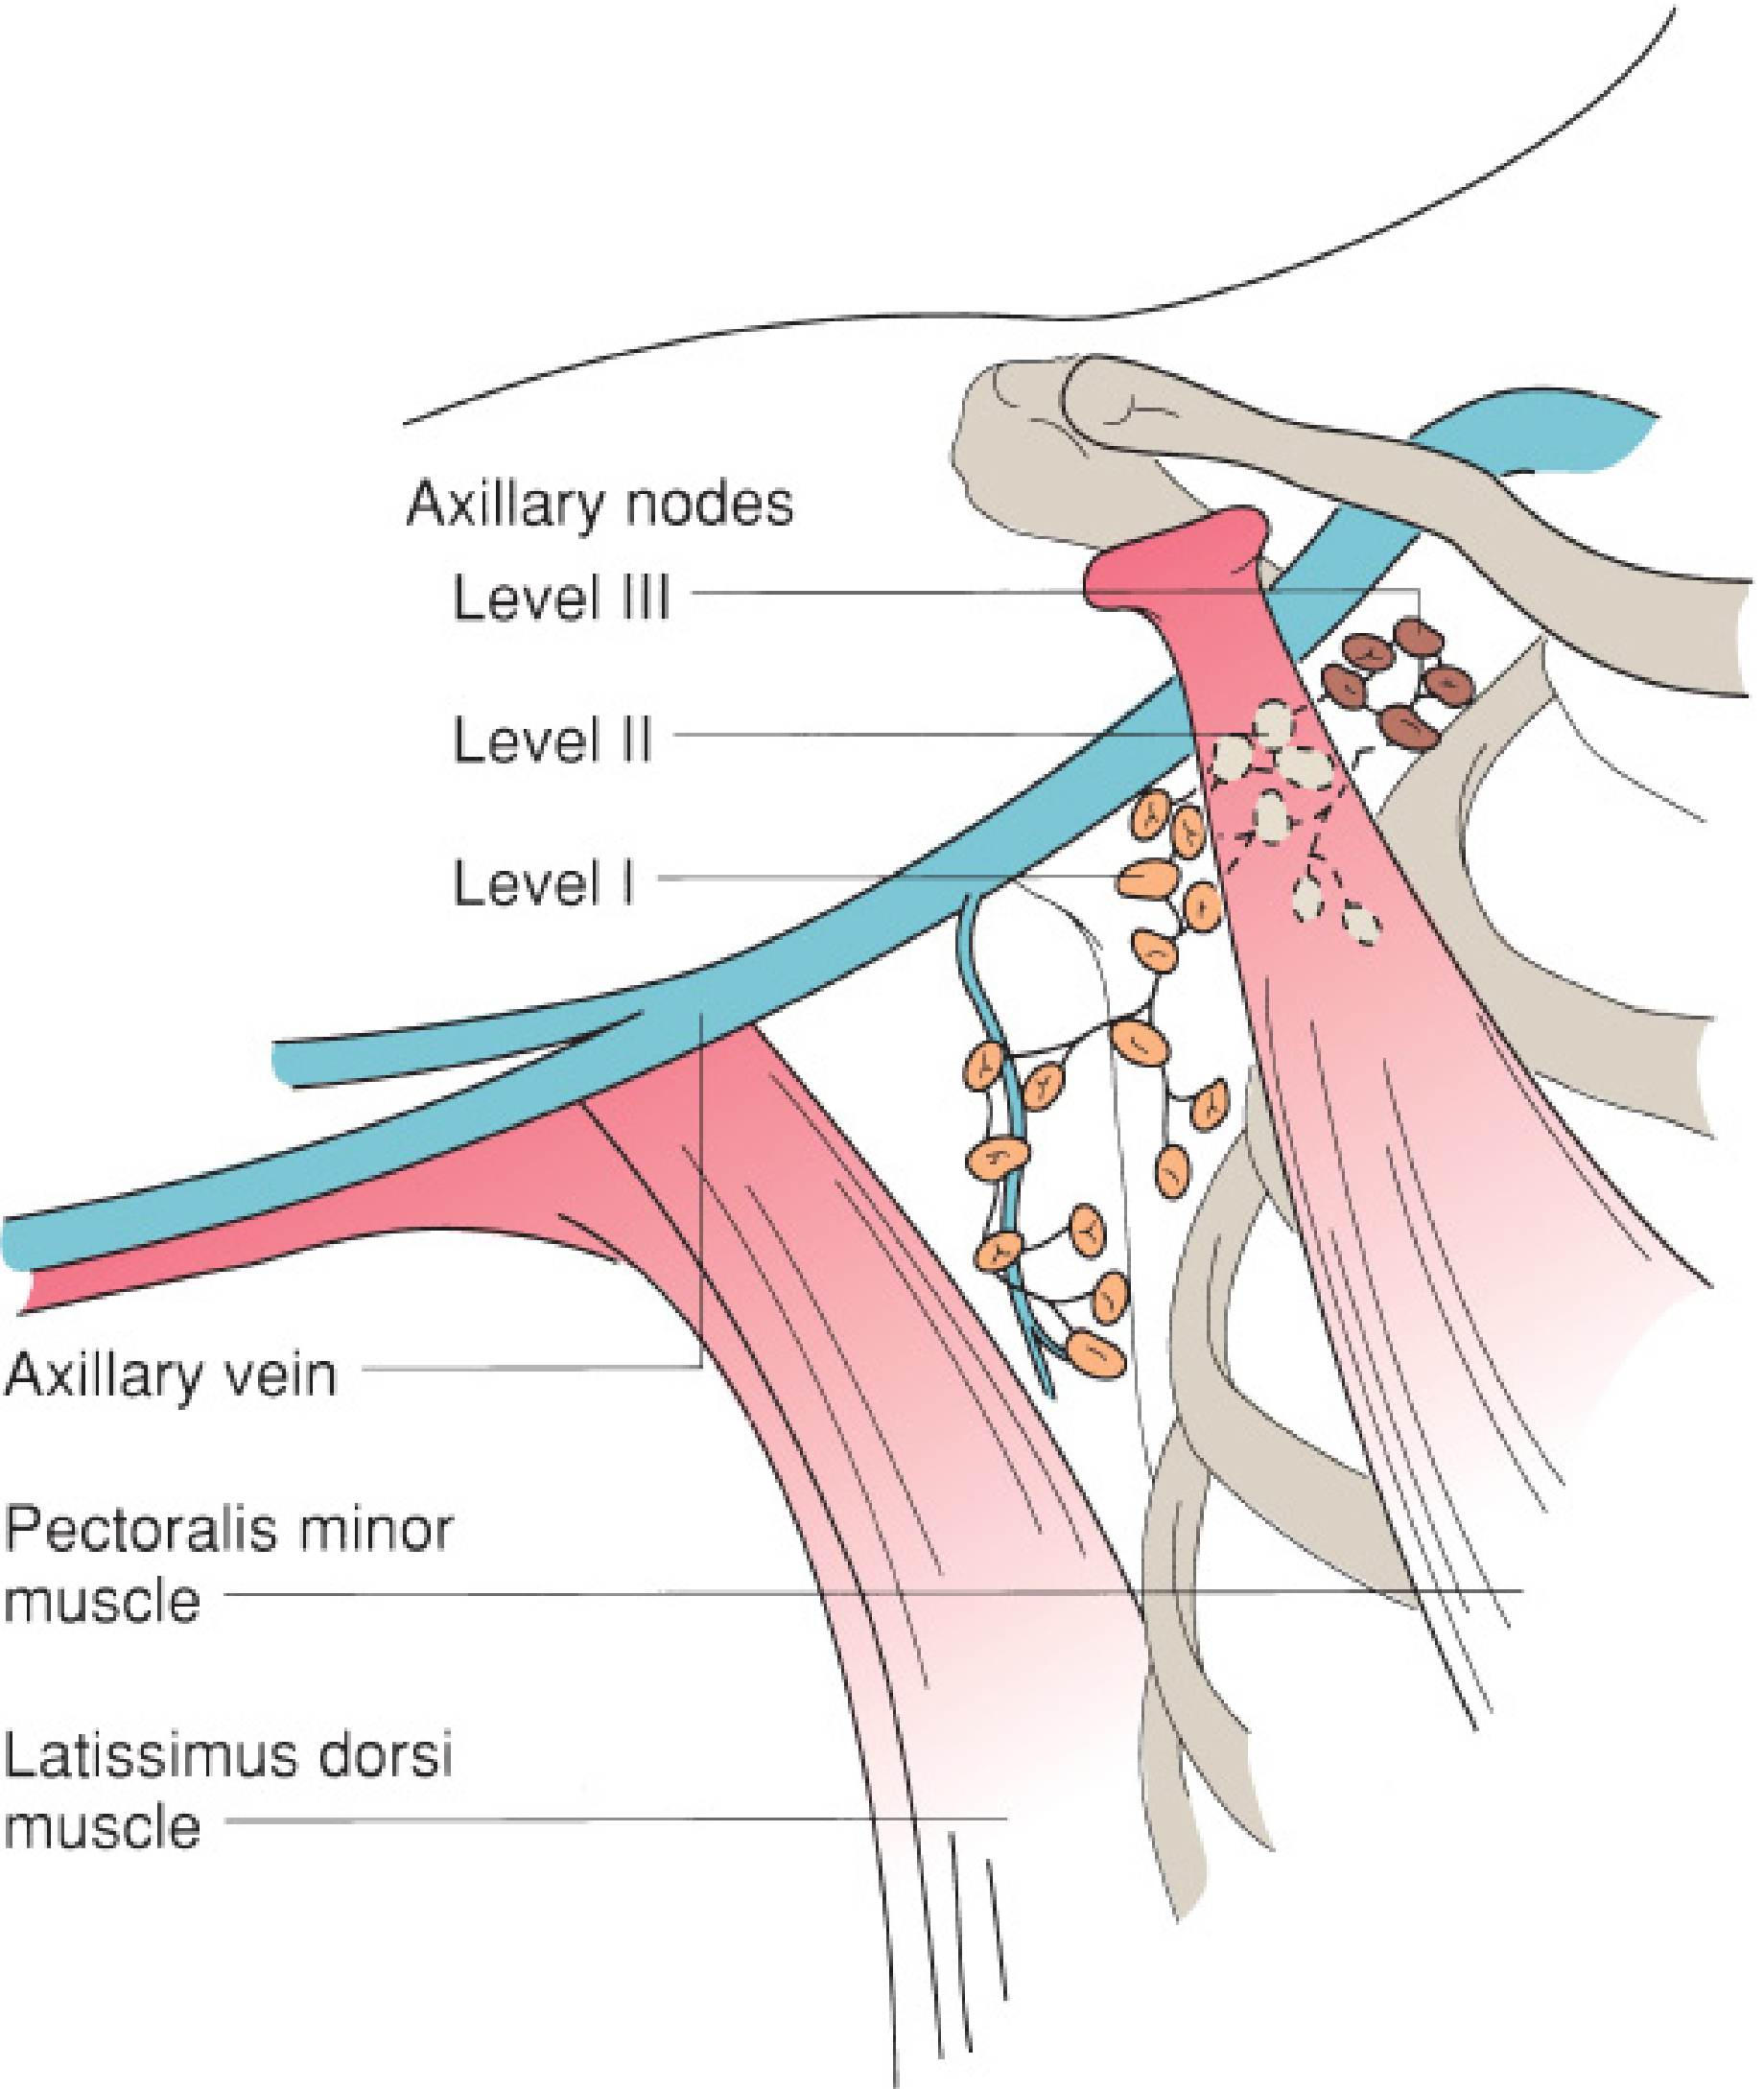
Axillary Lymph Nodes - Three Levels:
| Level | Location (relative to pectoralis minor) | Groups included |
|---|---|---|
| Level I | Inferior and lateral to pectoralis minor | External mammary, axillary vein, scapular groups |
| Level II | Behind pectoralis minor | Central nodes, some subclavicular nodes |
| Level III | Medial to pectoralis minor | Subclavicular (apical) nodes |
-
Rotter (interpectoral) nodes lie between pectoralis major and minor
-
Internal mammary nodes are in the first 6 intercostal spaces within 3 cm of the sternal edge (highest concentration in first 3 spaces)
-
Supraclavicular nodes are contiguous with the apex of the axilla
-
Mulholland and Greenfield's Surgery
9. Nerve Supply
- Lateral and anterior cutaneous branches of intercostal nerves T2-T6 - main innervation
- Supraclavicular nerves (from cervical plexus, C3-C4) - supply the upper portion of the breast skin
- The nipple and areola are highly innervated (sensory and autonomic fibers for smooth muscle control)
10. Clinical Correlates
| Clinical Point | Anatomical Basis |
|---|---|
| Skin dimpling in carcinoma | Cancer infiltrates Cooper's ligaments, which tether to dermis |
| Peau d'orange | Lymphatic obstruction causes dermal edema tethered by Cooper's ligaments |
| Axillary tail mistaken for lymph node | Tail of Spence passes through axillary fascia |
| Paget's disease | Malignant cells spread along lactiferous ducts to NAC epidermis |
| Bone metastasis via vertebral route | Posterior intercostal veins drain into azygos/vertebral plexus |
| Upper outer quadrant most common site of cancer | Contains the largest amount of breast parenchyma |
| Sentinel lymph node biopsy | Most lymph flows first to Level I axillary nodes |
- Sabiston Textbook of Surgery - breast anatomy and Cooper's ligaments
- Mulholland and Greenfield's Surgery, 7th Ed - surgical anatomy, lymphatics
- Thieme Atlas of General Anatomy and Musculoskeletal System - TDLU, blood supply, nerve supply
- Gray's Anatomy for Students - surface anatomy, axillary tail
- Schwartz's Principles of Surgery, 11th Ed - blood supply and functional anatomy
Cubital fossa explain
cubital fossa anatomy boundaries contents diagram
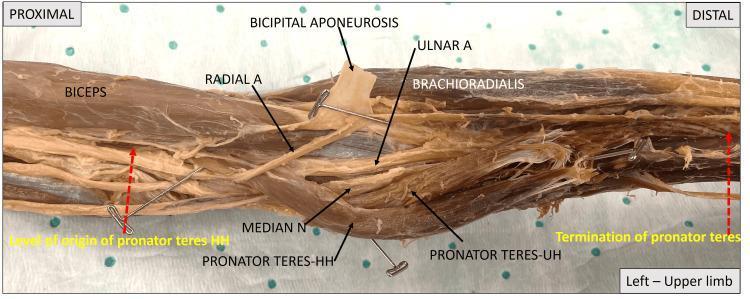
This cadaveric photograph illustrates the gross anatomy of the left cubital fossa and proximal forearm, oriented from proximal (left) to distal (right). Key muscular landmarks include the biceps brachii, brachioradialis, and the two heads of the pronator teres (humeral head - HH and ulnar head - UH). The bicipital aponeurosis is reflected to reveal underlying neurovascular structures. The median nerve (MEDIAN N) is clearly visible traversing the cubital fossa, passing between the humeral and ulnar heads of the pronator teres muscle. Proximally, the brachial artery bifurcation is demonstrated, showing the radial artery (RADIAL A) coursing superficially toward the lateral forearm and the ulnar artery (ULNAR A) diving deeper, posterior to the pronator teres. Red dotted arrows indicate the functional extent of the pronator teres muscle from its origin at the medial epicondyle to its termination on the radius. This image serves as an educational tool for identifying the spatial relationships and potential entrapment sites of the median nerve in the proximal forearm.
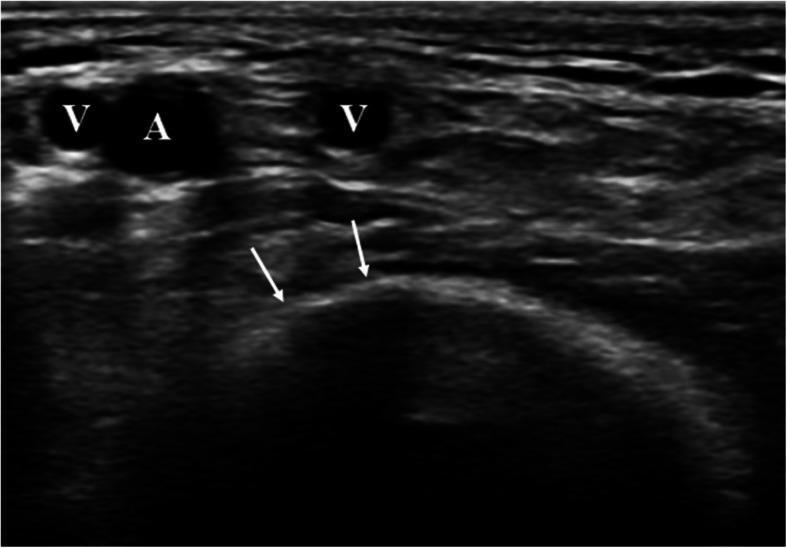
This diagnostic ultrasound image presents a transversal view of the cubital fossa, demonstrating the vascular and bony anatomy relevant for endovascular access. Centrally, the brachial artery (A. brachialis) is identified as an anechoic circular structure labeled 'A'. It is flanked by two brachial veins, labeled 'V', which appear as smaller anechoic lumen. Deep to the vascular bundle, the distal humerus is visualized as a prominent, hyperechoic curvilinear interface indicated by white arrows. This bony surface serves as a mechanical abutment, which is clinically significant for facilitating effective manual compression of the brachial artery following catheterization or needle puncture. The image highlights the utility of ultrasound guidance in identifying optimal puncture sites away from bifurcations and in close proximity to stabilizing skeletal landmarks to minimize access site complications such as hematomas or ischemia.
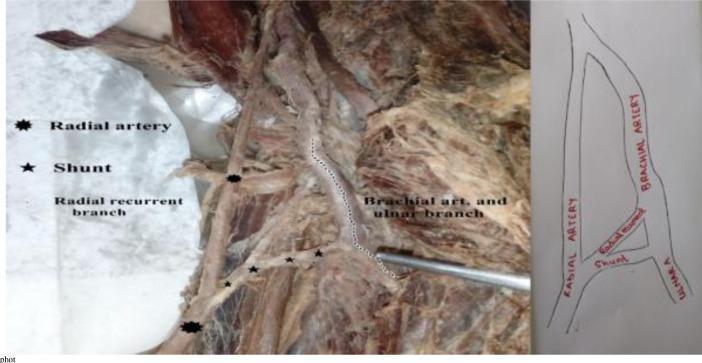
This composite image features a clinical photograph of a human cadaveric dissection (left) and a corresponding schematic diagram (right) of the cubital fossa, illustrating an anatomical variation of the upper limb vasculature. The primary focus is a vascular shunt (anastomosis) connecting the brachial artery to a high-origin radial artery. In this specimen, the radial artery originates proximally to the cubital fossa and descends laterally. The main brachial artery trunk is seen dividing into an ulnar branch medially. A distinct transverse communicating vessel, or shunt, is visible bridging the brachial/ulnar trunk to the radial artery. Notably, a radial recurrent branch is shown arising directly from this shunt rather than from the radial artery itself, traveling proximally toward the interval between the brachialis and brachioradialis muscles. This educational material demonstrates rare vascular patterns and arterial variations of the forearm, providing clinical relevance for surgical procedures, vascular access, and radiological interpretation in the cubital region.
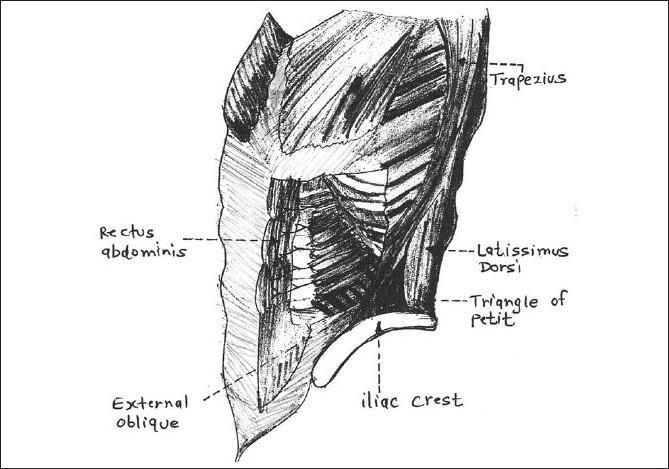
This medical anatomical diagram is a posterior-lateral sketch of the human torso, illustrating the musculature and boundaries of the lumbar triangle, also known as the Triangle of Petit. The diagram highlights the clinical significance of this region for procedures such as the transversus abdominis plane (TAP) block. The anatomical boundaries are clearly labeled: the posterior border is formed by the latissimus dorsi muscle, the anterior border by the external oblique muscle, and the base (inferior border) by the iliac crest. Other visible anatomical landmarks include the rectus abdominis muscle, located medially and anteriorly, and the trapezius muscle superiorly. The illustration demonstrates the convergence of these muscular structures to form a small, triangular area of relative weakness in the abdominal wall, which is a potential site for lumbar hernias. This diagram is designed for educational use in anatomy, regional anesthesia, and general surgery to help students and clinicians identify surface landmarks and deep structural relationships in the lumbar region.
Cubital Fossa
1. Definition
2. Boundaries
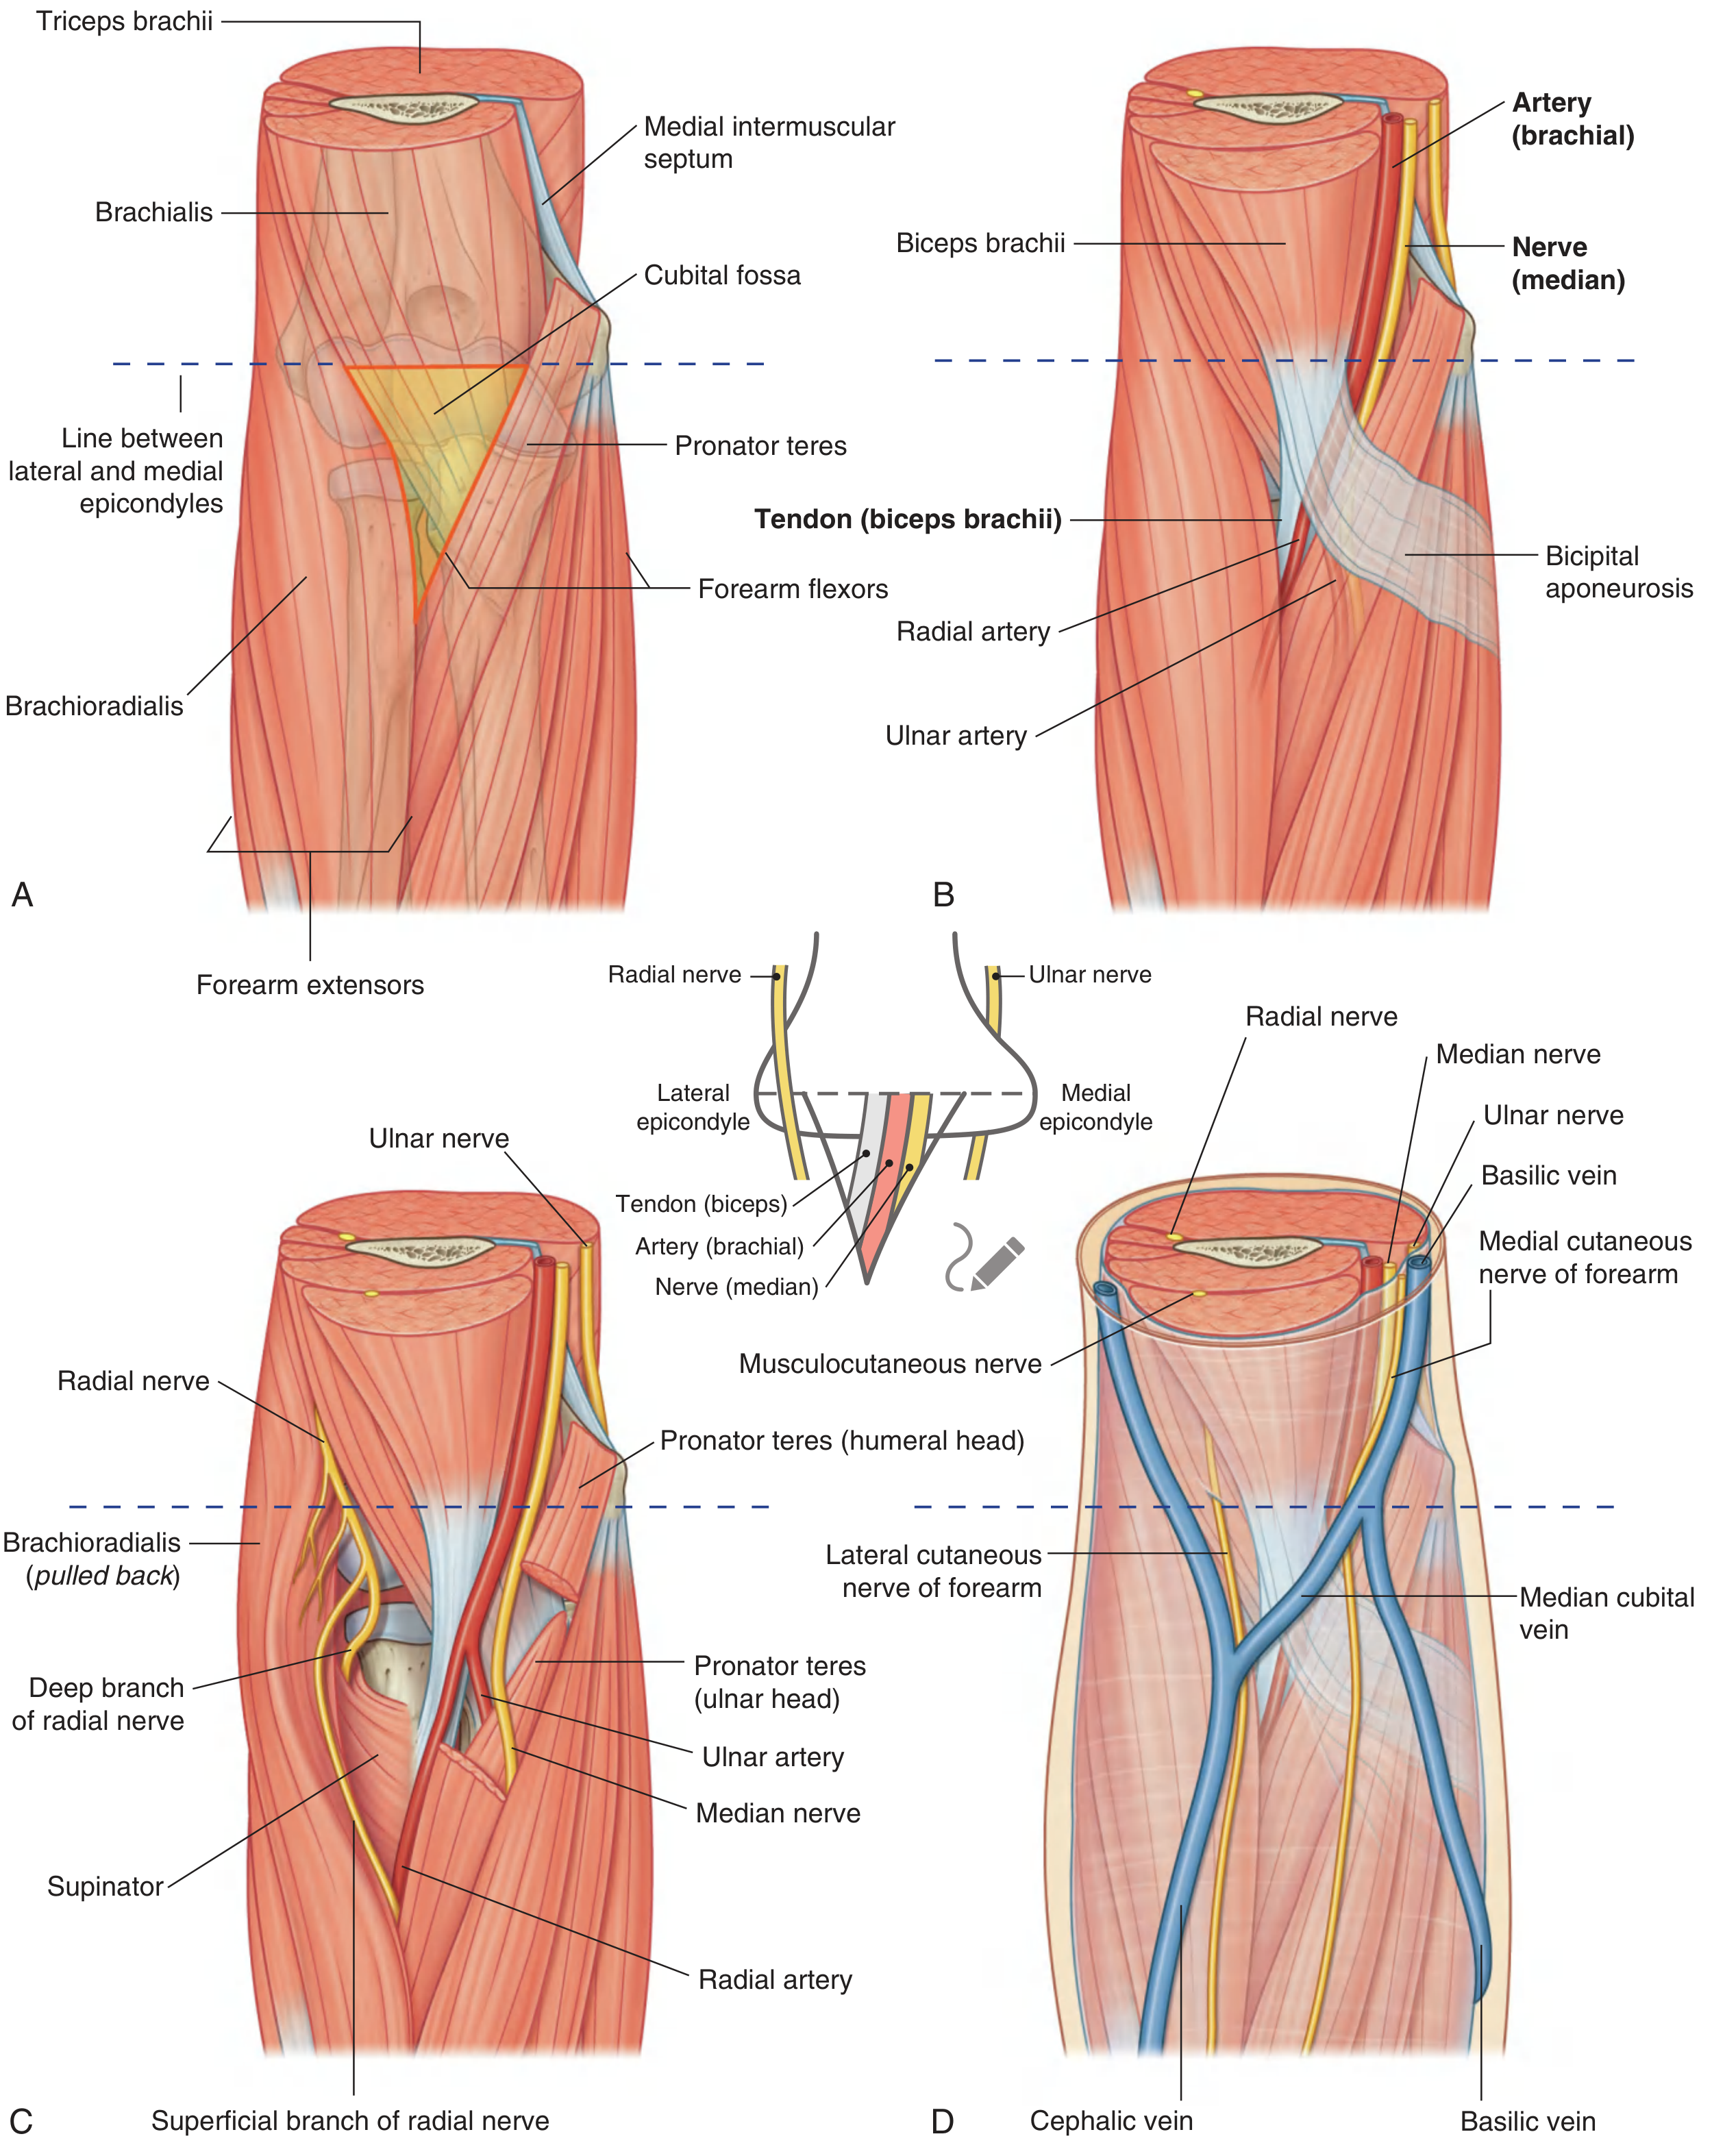
| Boundary | Structure |
|---|---|
| Base (superiorly) | Imaginary horizontal line joining the medial and lateral epicondyles of the humerus |
| Lateral border | Brachioradialis muscle (originating from the lateral supraepicondylar ridge) |
| Medial border | Pronator teres muscle (originating from the medial epicondyle) |
| Apex | Where the two muscles meet inferiorly (pointing downward) |
| Roof (anterior/superficial) | Skin + superficial fascia + bicipital aponeurosis (deep fascia) |
| Floor (posterior/deep) | Brachialis muscle (mainly) + supinator muscle (laterally) |
Mnemonic for boundaries: "Really Need To Bring Snacks Please" → Roof (skin/fascia), kNee-line (base), Teres pronator (medial), Brachioradialis (lateral), Supinator + brachialis (floor/Posterior)
3. Roof
- Skin (outermost)
- Superficial fascia containing superficial veins and cutaneous nerves
- Bicipital aponeurosis (lacertus fibrosus) - a flat tendinous expansion from the medial side of the biceps brachii tendon that passes obliquely across the brachial artery and median nerve, protecting them
4. Floor
- Brachialis muscle - forms most of the floor
- Supinator muscle - forms the lateral part of the floor
5. Contents
Mnemonic: "My Bottoms Are Too Relaxed Now" → from Medial to lateral: Median nerve, Brachial Artery, Tendon of biceps, Radial Nerve
| Structure | Details |
|---|---|
| Tendon of biceps brachii | Central; easily palpable; inserts into the radial tuberosity and bicipital aponeurosis |
| Brachial artery | Lies medial to the biceps tendon; bifurcates into radial and ulnar arteries at the apex of the fossa |
| Median nerve | Lies medial to the brachial artery; exits by passing between the two heads of pronator teres |
The Radial Nerve (just outside the fossa)
- The radial nerve lies just deep to the lateral border (under the lip of brachioradialis) - it is technically just outside the fossa
- At this level it divides into:
- Superficial branch - continues into the forearm deep to brachioradialis (sensory)
- Deep branch (posterior interosseous nerve) - winds around the neck of the radius, passes between the two heads of the supinator to enter the posterior compartment of the forearm
The Ulnar Nerve - NOT in the cubital fossa
- The ulnar nerve passes posterior to the medial epicondyle (through the cubital tunnel), completely outside and behind the cubital fossa. It can be "rolled" against the bone here.
6. Roof - Superficial Structures (Veins and Cutaneous Nerves)
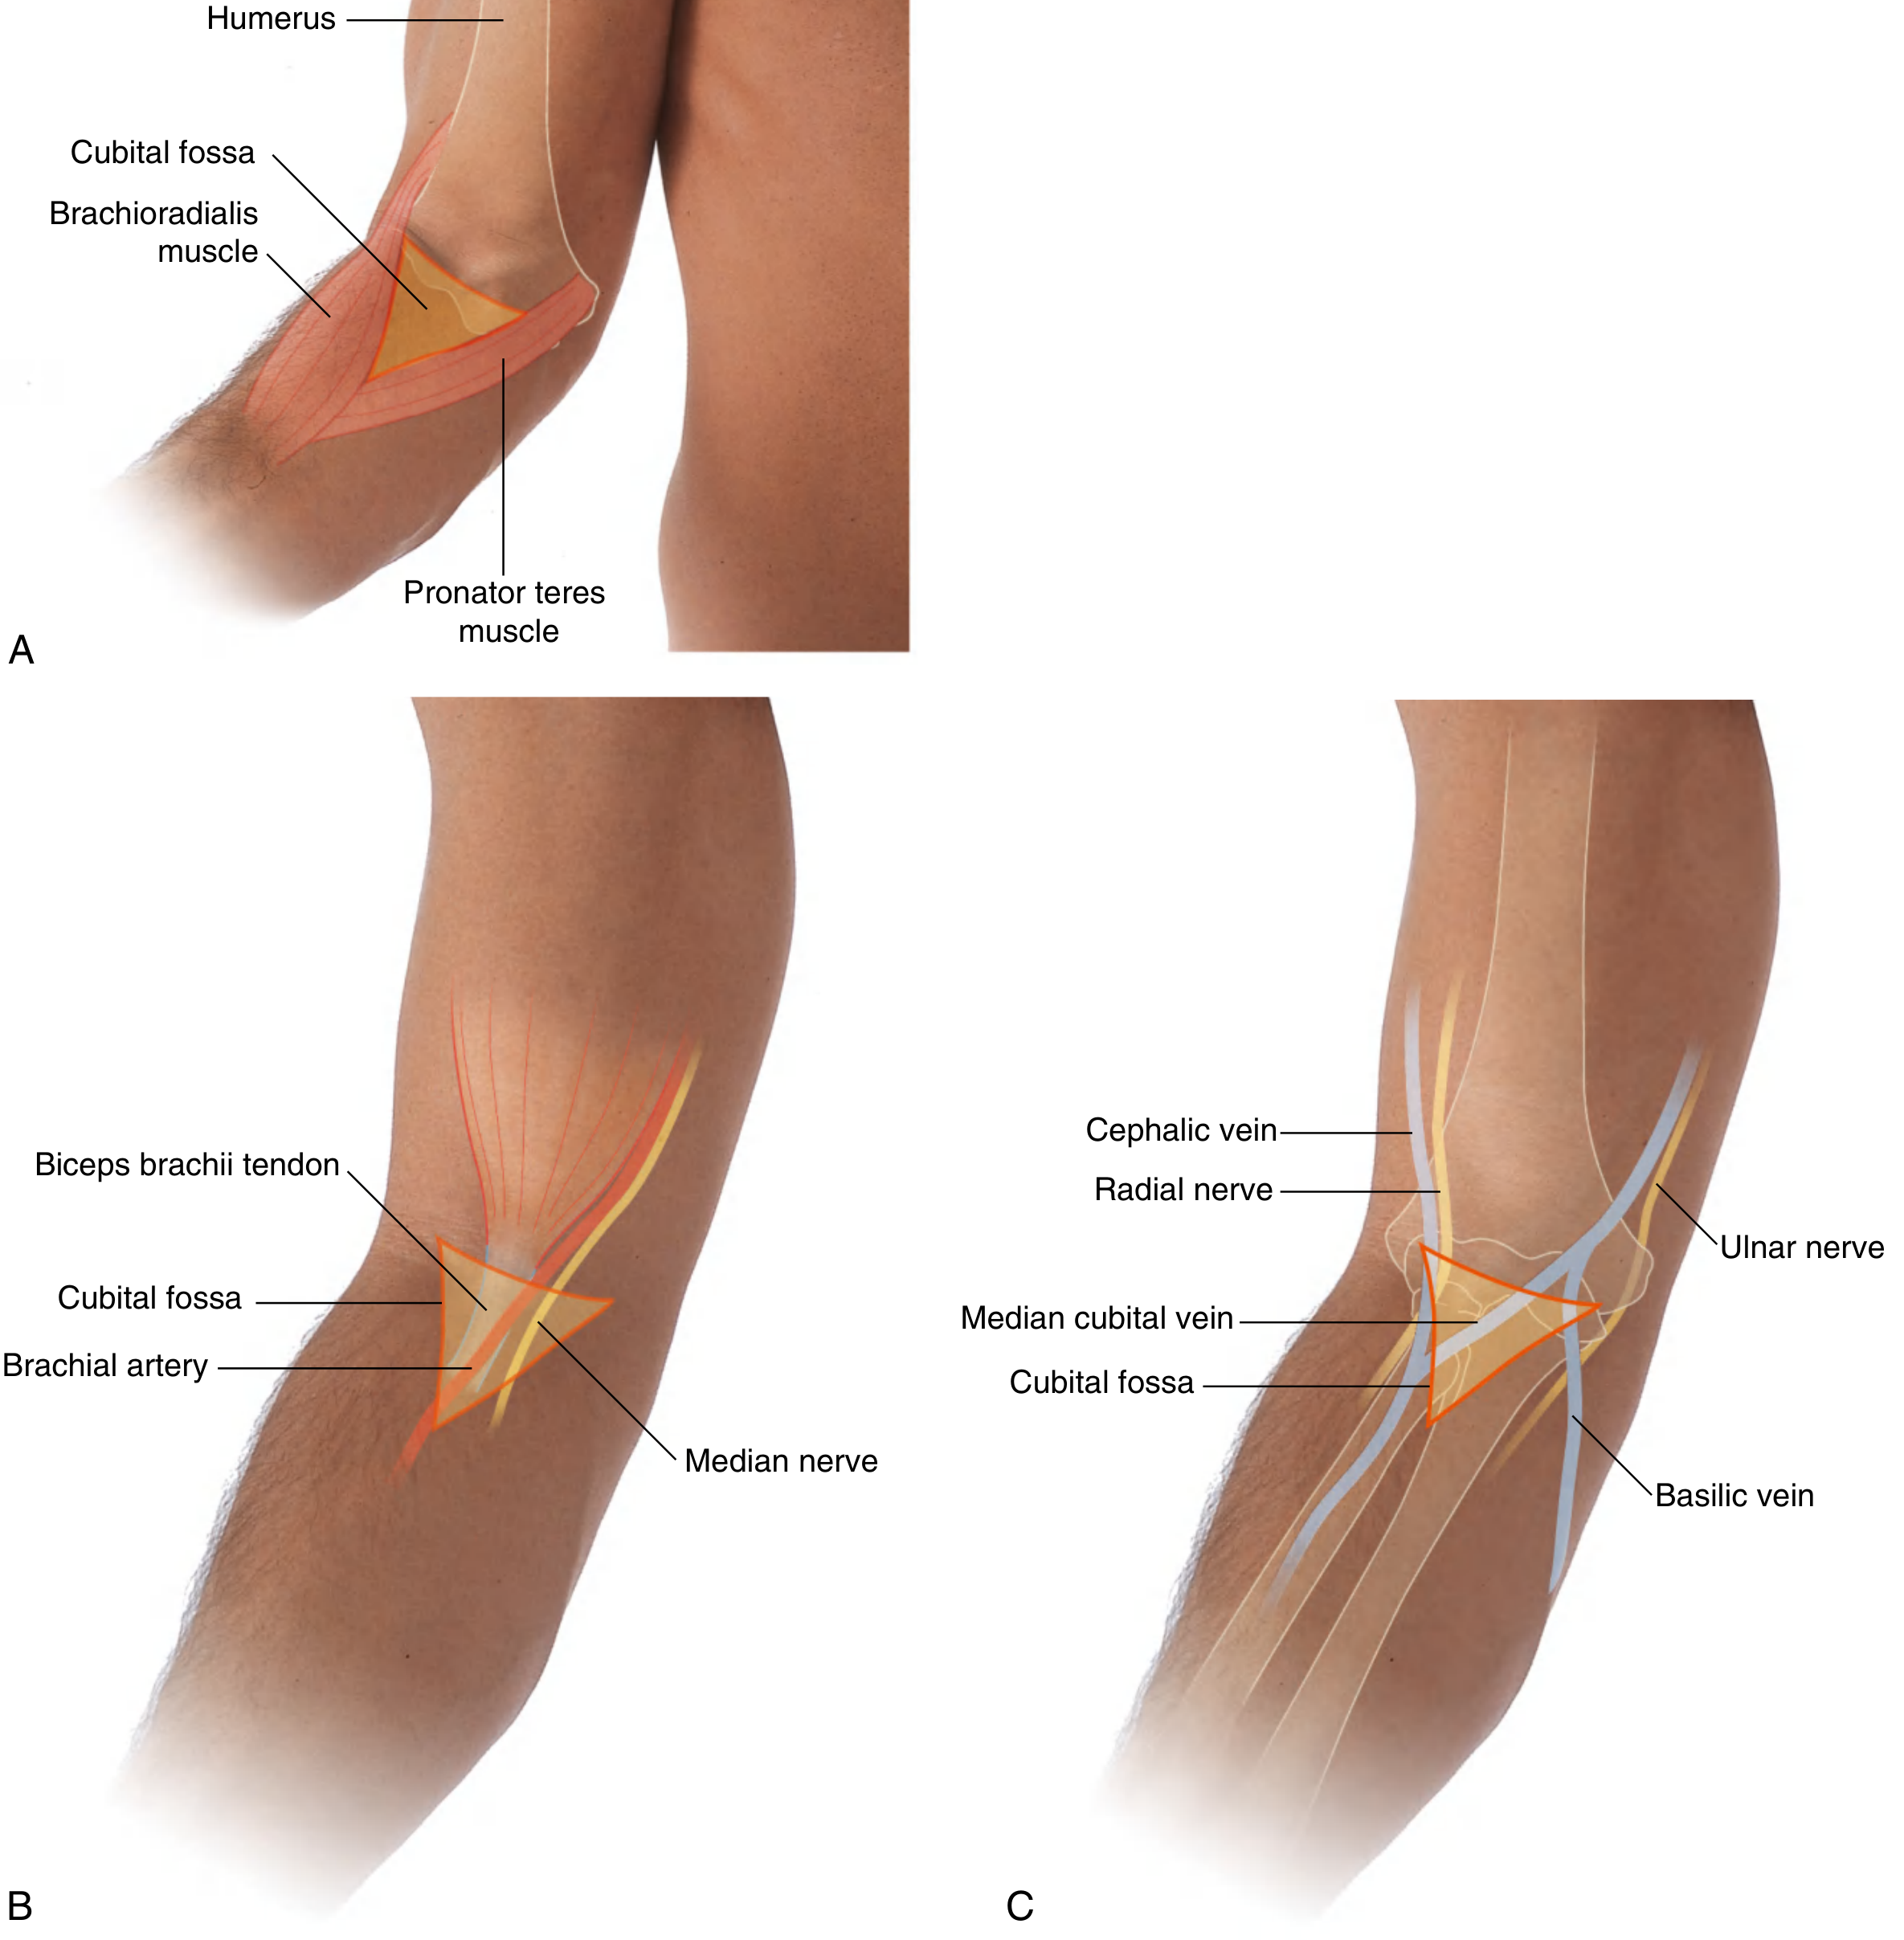
- Median cubital vein - passes diagonally across the roof from the cephalic vein (laterally) to the basilic vein (medially); the most common site for venepuncture
- Cephalic vein - lateral side
- Basilic vein - medial side
- Lateral cutaneous nerve of the forearm (terminal branch of musculocutaneous nerve) - lies lateral to the biceps tendon
- Medial cutaneous nerve of the forearm - runs along the medial side
The bicipital aponeurosis separates the superficial veins from the deep brachial artery, protecting the artery during venepuncture.
7. Summary Diagram - Contents from Lateral to Medial
Lateral border Medial border
(Brachioradialis) (Pronator teres)
| |
Radial nerve* Biceps Brachial Median
(deep to BR) tendon artery nerve
← Lateral to Medial →
8. Clinical Significance
| Clinical Point | Anatomical Basis |
|---|---|
| Venepuncture / IV cannulation | Median cubital vein in roof; bicipital aponeurosis protects brachial artery below |
| Brachial pulse | Palpated just medial to biceps tendon in the fossa - used for blood pressure measurement with sphygmomanometer |
| Arteriovenous fistula (for dialysis) | Brachial artery anastomosed to cephalic vein at the elbow |
| Cubital tunnel syndrome | Ulnar nerve compressed posterior to medial epicondyle (not in fossa) |
| Radial nerve compression | Deep branch can be compressed as it enters supinator (radial tunnel syndrome) |
| Median nerve entrapment | Nerve compressed between the two heads of pronator teres just below the fossa |
| Brachial artery injury | Supracondylar fracture of humerus can damage the brachial artery just above the fossa - risk of Volkmann's ischaemic contracture |
Quick Revision Summary
- Shape: Triangular fossa, apex pointing inferiorly
- Base: Line between medial and lateral epicondyles
- Lateral wall: Brachioradialis
- Medial wall: Pronator teres
- Floor: Brachialis + supinator
- Roof: Skin + superficial fascia + bicipital aponeurosis
- Contents (L→M): Radial nerve (outside, under BR) | Biceps tendon | Brachial artery | Median nerve
- Ulnar nerve: NOT in fossa - passes posterior to medial epicondyle
- Bifurcation: Brachial artery divides into radial and ulnar arteries at the apex
Carpel tunnel syndrome explain
carpal tunnel syndrome median nerve anatomy cross section wrist
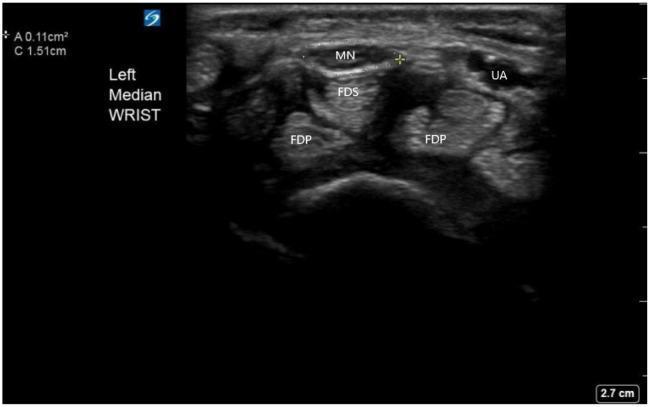
Diagnostic ultrasound image of the left wrist in a transverse cross-section, demonstrating the carpal tunnel anatomy for the evaluation of carpal tunnel syndrome. The median nerve (MN) is identified as a superficial hypoechoic, honeycomb-textured structure superior to the flexor digitorum superficialis (FDS) and flexor digitorum profundus (FDP) muscle tendons. To the lateral aspect, the ulnar artery (UA) is visible as an anechoic circular structure. A caliper-based measurement tool outlines the circumference of the median nerve, showing a cross-sectional area (CSA) of 0.11 cm² and a circumference of 1.51 cm. This imaging modality is used clinically to assess for median nerve enlargement, a hallmark of entrapment neuropathy. The anatomical relationship between the nerve and the underlying flexor tendons is clearly labeled, providing context for diagnostic assessment or ultrasound-guided regional anesthesia such as a nerve block.
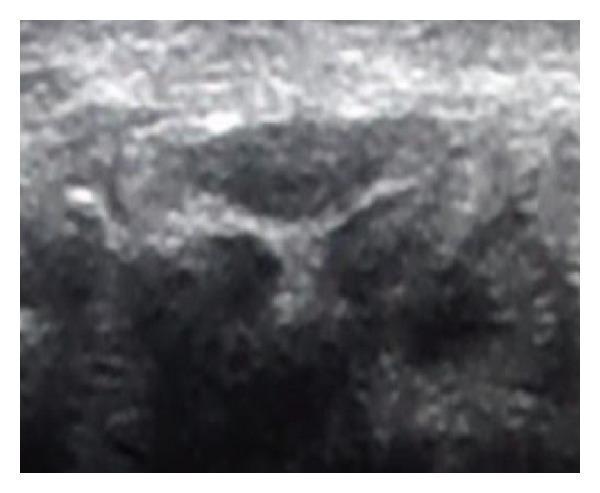
This diagnostic image is a musculoskeletal ultrasound (US) of the wrist in a transverse cross-section at the level of the carpal tunnel inlet. The primary focus is the median nerve, which appears as a centrally located, hypoechoic, oval structure. The nerve is demarcated by a distinct hyperechoic perineural rim. The surrounding carpal tunnel anatomy exhibits a heterogeneous echotexture, with deeper hyperechoic areas representing carpal bones and adjacent soft tissue structures. In this clinical context of moderate Carpal Tunnel Syndrome (CTS), the median nerve demonstrates edema and enlargement, with a cross-sectional area (CSA) of 14 mm². The image illustrates the use of high-frequency linear transducers in diagnosing nerve entrapment by assessing morphological changes, nerve flattening, and increased CSA compared to standard reference values. It serves as a key diagnostic example for physical medicine, rehabilitation, and radiology education regarding musculoskeletal ultrasonography.
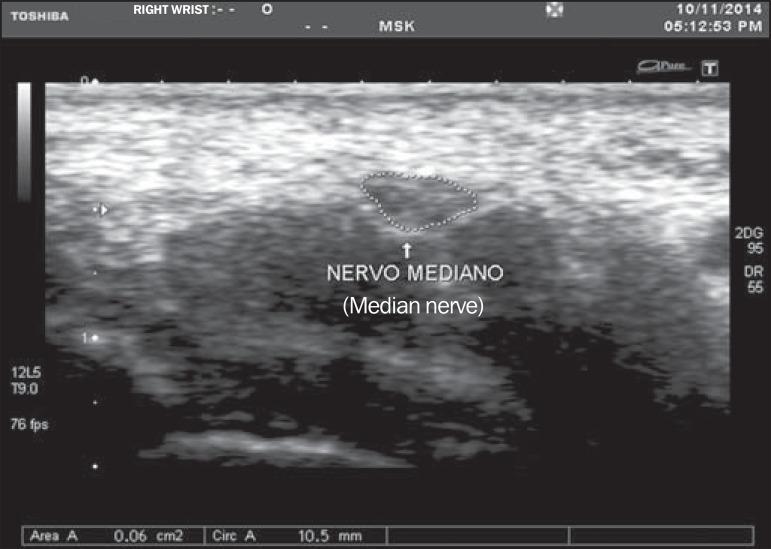
This diagnostic ultrasound image displays a transverse cross-section of the median nerve at the level of the proximal flexion fold of the wrist. The median nerve is visualized as a relatively hypoechoic, oval structure positioned superficial to the flexor tendons. A manual trace delineation (dotted line) identifies the median nerve area (MNA) for morphometric analysis. Quantitative data at the bottom of the frame indicates a cross-sectional area of 0.06 cm² (6 mm²) and a circumference of 10.5 mm. The surrounding musculoskeletal anatomy includes the more echogenic, fibrillar patterns of adjacent tendons and soft tissues. This imaging modality is primarily used in the diagnostic workup for Carpal Tunnel Syndrome (CTS), where an increase in MNA (typically ≥ 9 mm²) serves as a key sonographic marker for nerve compression. The image represents a standard musculoskeletal (MSK) ultrasound protocol using a high-frequency linear transducer to assess peripheral nerve morphology.
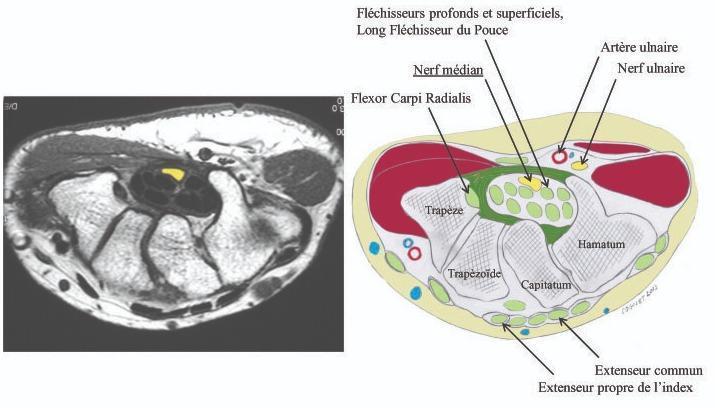
This medical visual consists of a side-by-side comparison between an axial magnetic resonance imaging (MRI) scan of the human wrist and a corresponding anatomical cross-section diagram. The image illustrates the anatomy of the carpal tunnel and surrounding structures. Key elements identified include the carpal bones (trapezium, trapezoid, capitate, and hamate) forming the floor and walls of the tunnel. Centrally located within the carpal tunnel, the median nerve is highlighted in yellow, positioned superficially to the deep and superficial flexor tendons and the long flexor tendon of the thumb. The flexor carpi radialis is shown in its distinct compartment. Outside the flexor retinaculum on the ulnar side, the ulnar artery and ulnar nerve are clearly demarcated. Posteriorly, the extensor tendons, including the extensor digitorum and extensor indicis, are visible. This educational material is designed to demonstrate the spatial relationship of the median nerve within the confined carpal space, which is clinically relevant for diagnosing and treating carpal tunnel syndrome.
Carpal Tunnel Syndrome (CTS)
1. Definition
2. Anatomy of the Carpal Tunnel
| Wall | Structure |
|---|---|
| Floor and sides (dorsal) | Carpal bones arched dorsally (scaphoid + trapezium laterally; pisiform + hook of hamate medially) |
| Roof (palmar/anterior) | Flexor retinaculum = deep forearm fascia (proximally) + transverse carpal ligament (TCL) + aponeurosis between thenar and hypothenar muscles (distally) |
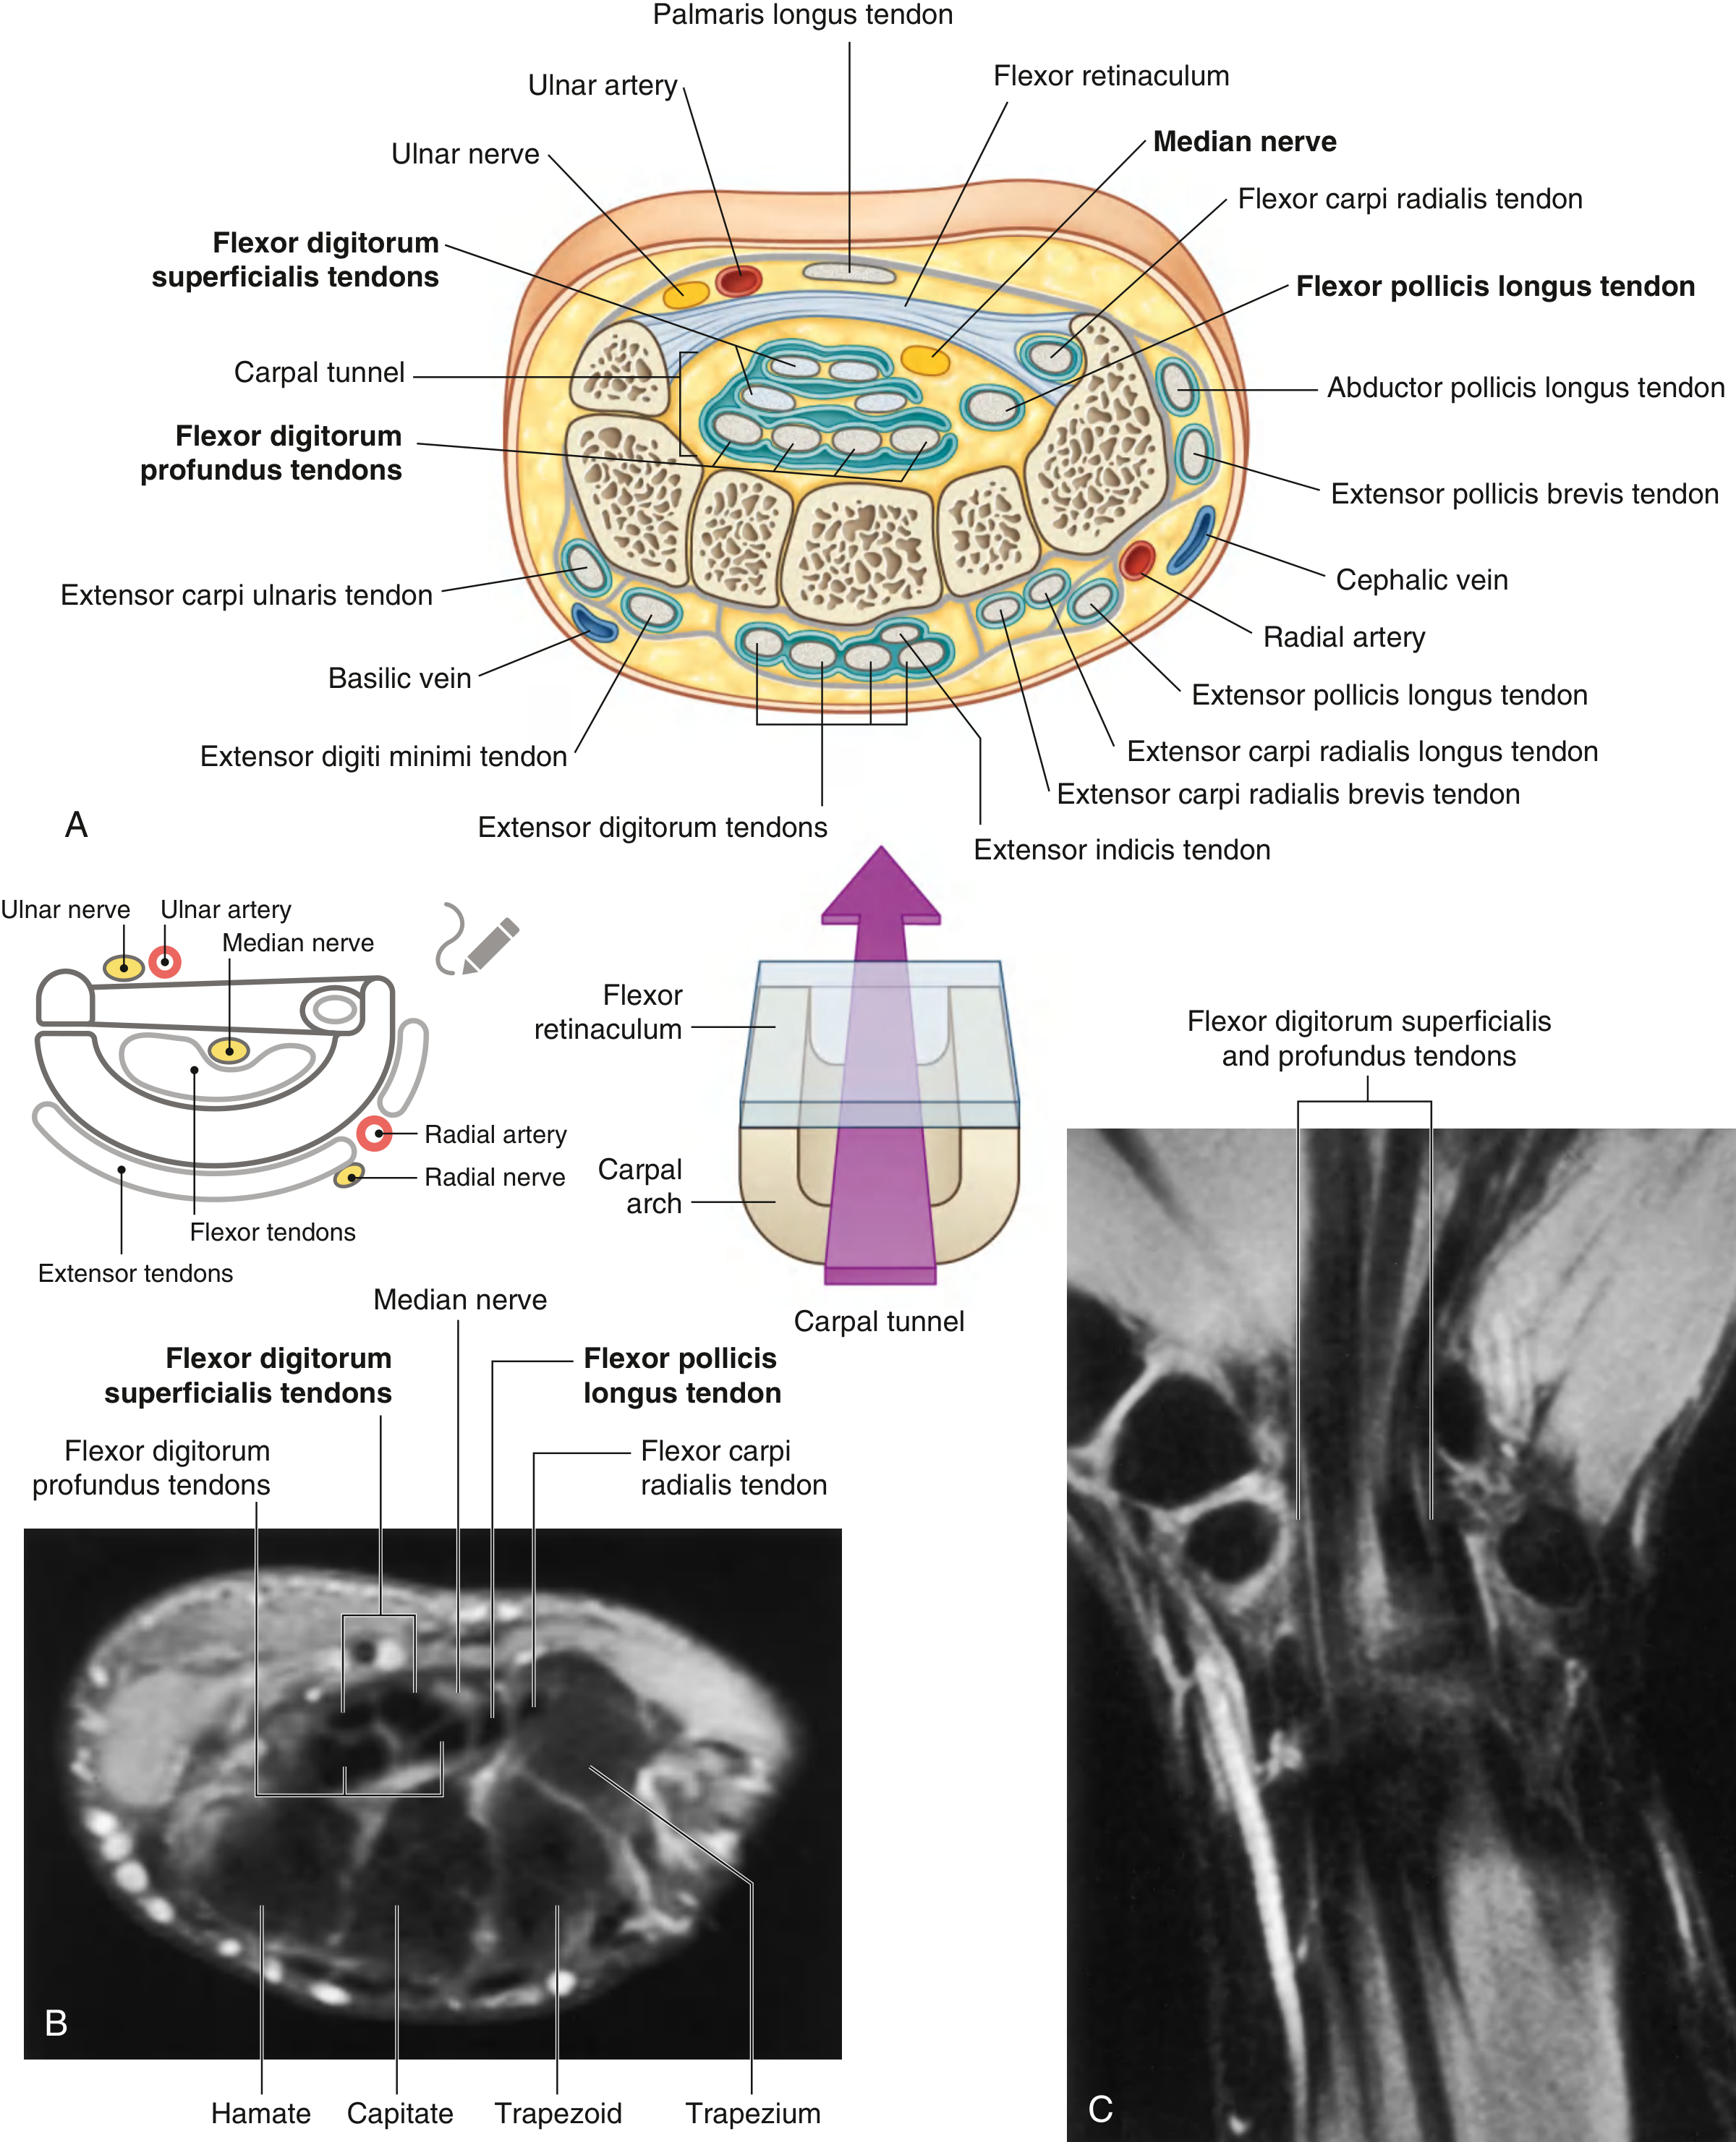
Contents of the Carpal Tunnel (10 structures):
- 1 nerve - Median nerve (most palmar/superficial structure)
- 9 tendons - Flexor digitorum superficialis ×4, Flexor digitorum profundus ×4, Flexor pollicis longus ×1
- (Note: Flexor carpi radialis has its own separate compartment in the groove of trapezium)
Ulnar nerve and ulnar artery travel outside the carpal tunnel, through Guyon's canal (ulnar tunnel).
3. Epidemiology
- Most common entrapment neuropathy (up to 10% of the population affected)
- Twice as common in women than men
- Peak age: 30-60 years
- More common in the dominant hand, but non-dominant hand involvement is frequent
4. Aetiology and Risk Factors
Idiopathic (most common)
- Cause is unknown in the majority
Occupational / Mechanical
- Repetitive wrist flexion/extension (typing, assembly work, carpentry)
- Vibrating tools
Conditions Increasing Tunnel Contents / Pressure
| Category | Examples |
|---|---|
| Endocrine/Metabolic | Hypothyroidism, diabetes mellitus, acromegaly, pregnancy |
| Inflammatory | Rheumatoid arthritis, tenosynovitis, gout |
| Space-occupying | Synovial cysts (ganglion), lipoma, amyloid deposits |
| Bony | Osteoarthritis, post-fracture malunion (Colles'), carpal dislocations |
| Physiological states | Pregnancy (usually resolves post-delivery), obesity |
| Rare (in children) | Congenital bone abnormalities, hypothyroidism, lysosomal storage disease |
Pathophysiology
5. Clinical Features
Symptoms
- Pain, paraesthesiae ("pins and needles"), numbness in the distribution of the median nerve - lateral 3½ fingers (thumb, index, middle, lateral half of ring finger)
- Nocturnal symptoms - patient wakes at night with burning/tingling; relieved by "shaking" or dangling the hand (flick sign)
- Symptoms may radiate proximally to the forearm and even the shoulder ("brachialgia")
- Weakness of thumb abduction (abductor pollicis brevis - APB)
- Weakness of opposition (opponens pollicis)
- Weakness of thumb flexion (flexor pollicis brevis - superficial head)
- Wasting of the thenar eminence (late/advanced sign)
6. Clinical Tests / Provocative Signs
| Test | How Performed | Positive Result | Notes |
|---|---|---|---|
| Tinel's sign | Tapping over the flexor retinaculum at the wrist | Tingling/paraesthesiae in median nerve distribution | Most specific but less sensitive |
| Phalen's test | Wrist held in complete flexion for 1-2 minutes | Numbness/tingling in median nerve distribution within 60 sec | Most sensitive (~74%); false positive ~25% |
| Durkan's test (Carpal compression test) | Direct thumb pressure over carpal tunnel for 30 sec | Paraesthesiae in median distribution | Better sensitivity and specificity than Tinel's |
| Reverse Phalen's | Wrist held in extension | Reproduces symptoms | Supplements Phalen's |
| Abductor Pollicis Brevis test | Ask patient to abduct thumb against resistance | Weakness indicates motor involvement | Indicates severity |
7. Investigations
Nerve Conduction Studies (NCS) / EMG - Gold Standard
- Prolonged distal sensory latency (most sensitive early finding)
- Prolonged distal motor latency
- Reduced sensory nerve action potential (SNAP) amplitude
- EMG may show fibrillation potentials and polyphasic reinnervation potentials in APB (denervation)
Screening Blood Tests (to find underlying cause)
- Fasting blood glucose (diabetes)
- TFTs (hypothyroidism)
- ESR/CRP, RF (rheumatoid arthritis)
- Serum calcium, protein electrophoresis (amyloid, sarcoid)
- IGF-1 (acromegaly)
Imaging
- Ultrasound - shows enlarged cross-sectional area of median nerve (>9-14 mm² is diagnostic); non-invasive, useful for dynamic assessment
- MRI - shows nerve oedema, flattening of median nerve at the tunnel
- X-ray wrist - if bony pathology suspected
8. Differential Diagnosis
- Cervical disc disease / radiculopathy (C6-C7)
- Thoracic outlet syndrome
- Pronator teres syndrome (median nerve entrapment in the forearm)
- Diabetic peripheral neuropathy
- Brachial neuritis (Parsonage-Turner syndrome)
- Raynaud's phenomenon (if mainly vascular symptoms)
9. Treatment
Conservative (Mild-Moderate)
| Measure | Detail |
|---|---|
| Wrist splint (neutral position) | Worn at night; first-line for most patients; effective for nocturnal symptoms |
| Activity modification | Avoid repetitive wrist flexion/extension |
| Corticosteroid injection | Injected into the carpal tunnel; provides temporary relief; useful diagnostically; may need to be repeated |
| 5% Dextrose injection | Shown to be effective; alternative to steroids |
| Treat underlying cause | Control diabetes, thyroid replacement, etc. |
| NSAIDs | Limited evidence; short-term symptomatic relief |
Surgical (Moderate-Severe or failed conservative)
- Open CTR - standard longitudinal palmar incision; direct visualization of the nerve
- Endoscopic CTR - smaller incision, faster recovery; generally preferred for appropriate candidates; similar long-term outcomes to open
- Indicated for: failed conservative treatment, severe/progressive motor weakness, thenar wasting, failed steroid injections
- Results: excellent in 80-90% of patients; motor recovery can be incomplete if thenar wasting is established
10. Summary Table
| Feature | Detail |
|---|---|
| Most common entrapment neuropathy | Yes |
| Nerve compressed | Median nerve |
| Site of compression | Within carpal tunnel, under transverse carpal ligament |
| Sensory loss | Lateral 3½ fingers (thumb, index, middle, lateral ring) |
| Thenar eminence sensation | Preserved (palmar cutaneous branch exits proximal to tunnel) |
| Motor loss | APB, opponens pollicis (thenar wasting - late) |
| Key symptom | Nocturnal paraesthesiae, relieved by shaking the hand |
| Best provocative test | Phalen's (most sensitive); Tinel's (most specific) |
| Gold standard investigation | Nerve conduction studies |
| Treatment | Splint → steroid injection → surgical decompression (CTR) |
Carpel tunnel syndrome from BDC
carpal tunnel anatomy flexor retinaculum median nerve boundaries contents
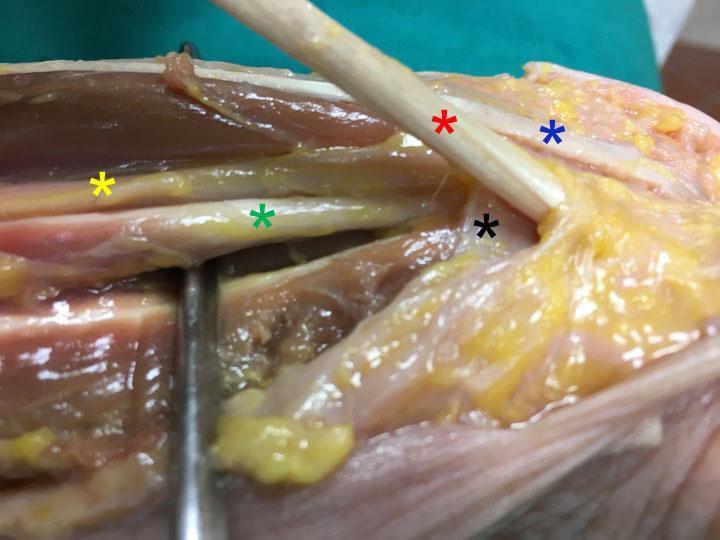
Anatomical Dissection: This clinical photograph depicts a deep dissection of the human wrist joint, focusing on the contents of the carpal tunnel and surrounding structures. The flexor retinaculum (black asterisk) is identified as a fibrous band forming the roof of the carpal tunnel. Labeled tendons include the flexor carpi radialis (red asterisk), which appears as a robust, white rope-like structure, and the more slender, string-like palmaris longus tendon (blue asterisk). The median nerve (yellow asterisk) is clearly visible with a characteristic yellowish hue, positioned superficially relative to the deeper flexor pollicis longus tendon (green asterisk). A surgical probe is used to retract tissues, highlighting the spatial relationship between these neurovascular and tendinous structures. This specimen serves as an educational reference for upper limb anatomy, demonstrating the clinical significance of carpal tunnel anatomy and the relative positions of structures vulnerable to compression or surgical intervention.
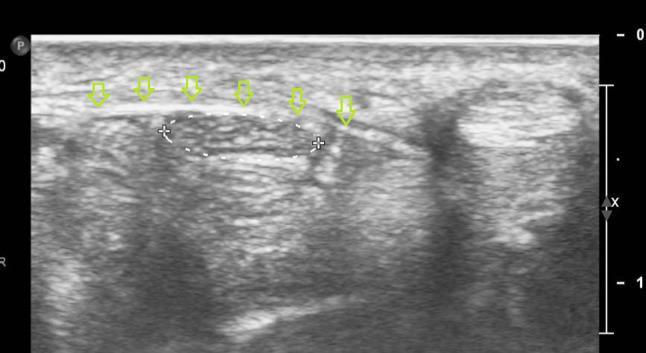
This diagnostic image is a high-resolution musculoskeletal ultrasound of the wrist in the axial (transverse) plane, focusing on the carpal tunnel anatomy. The image demonstrates the spatial relationship between superficial and deep structures of the volar wrist. The flexor retinaculum (transverse carpal ligament) is identified by a series of downward-pointing void arrows, appearing as a thin, hyperechoic (bright) linear band positioned superficially. Located immediately deep to this ligament is the median nerve, which is circumscribed by a dotted oval line. The nerve exhibits a characteristic speckled or 'honeycomb' internal texture and is slightly hypoechoic compared to the overlying retinaculum. This visual representation is clinically significant for evaluating carpal tunnel syndrome, identifying nerve compression, or guiding interventional procedures such as hydrodissection. The imaging captures the typical anatomical boundaries of the carpal tunnel, useful for intermediate to advanced medical students and radiology residents in mastering musculoskeletal sonography and ultrasound-guided regional anesthesia techniques.
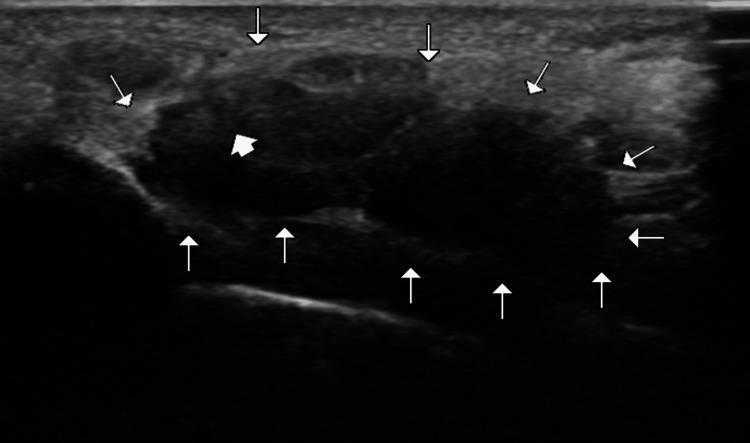
This diagnostic image is a transverse ultrasound of the wrist, focusing on the carpal tunnel. The image demonstrates the cross-sectional anatomy of the carpal tunnel, with its boundaries delineated by multiple white arrowheads. These arrowheads highlight the arch-shaped space formed by the deep carpal bones and the superficial, echogenic flexor retinaculum. Within the tunnel, a thick white arrow points to the median nerve, which presents as a relatively hypoechoic, oval structure with a fascicular internal texture. Surrounding the nerve are the flexor tendons, visible as more heterogeneous and slightly more echogenic structures within the tunnel space. This imaging modality and view are used in clinical practice for diagnosing carpal tunnel syndrome, assessing median nerve cross-sectional area, and identifying space-occupying lesions. The focus is on neuromuscular and musculoskeletal diagnostic features relevant to radiology and physical medicine.
Carpal Tunnel Syndrome (BDC Style)
Important Note: BD Chaurasia's Human Anatomy is not available in the digital library. However, the content below is written in the exact BD Chaurasia format and style - the same point-by-point headings, anatomical precision, and applied anatomy approach used in BDC Vol. 1 (Upper Limb), drawn from Gray's Anatomy for Students and Thieme Atlas of Anatomy, which are the international equivalents BDC is based on.
CARPAL TUNNEL
Definition
Boundaries
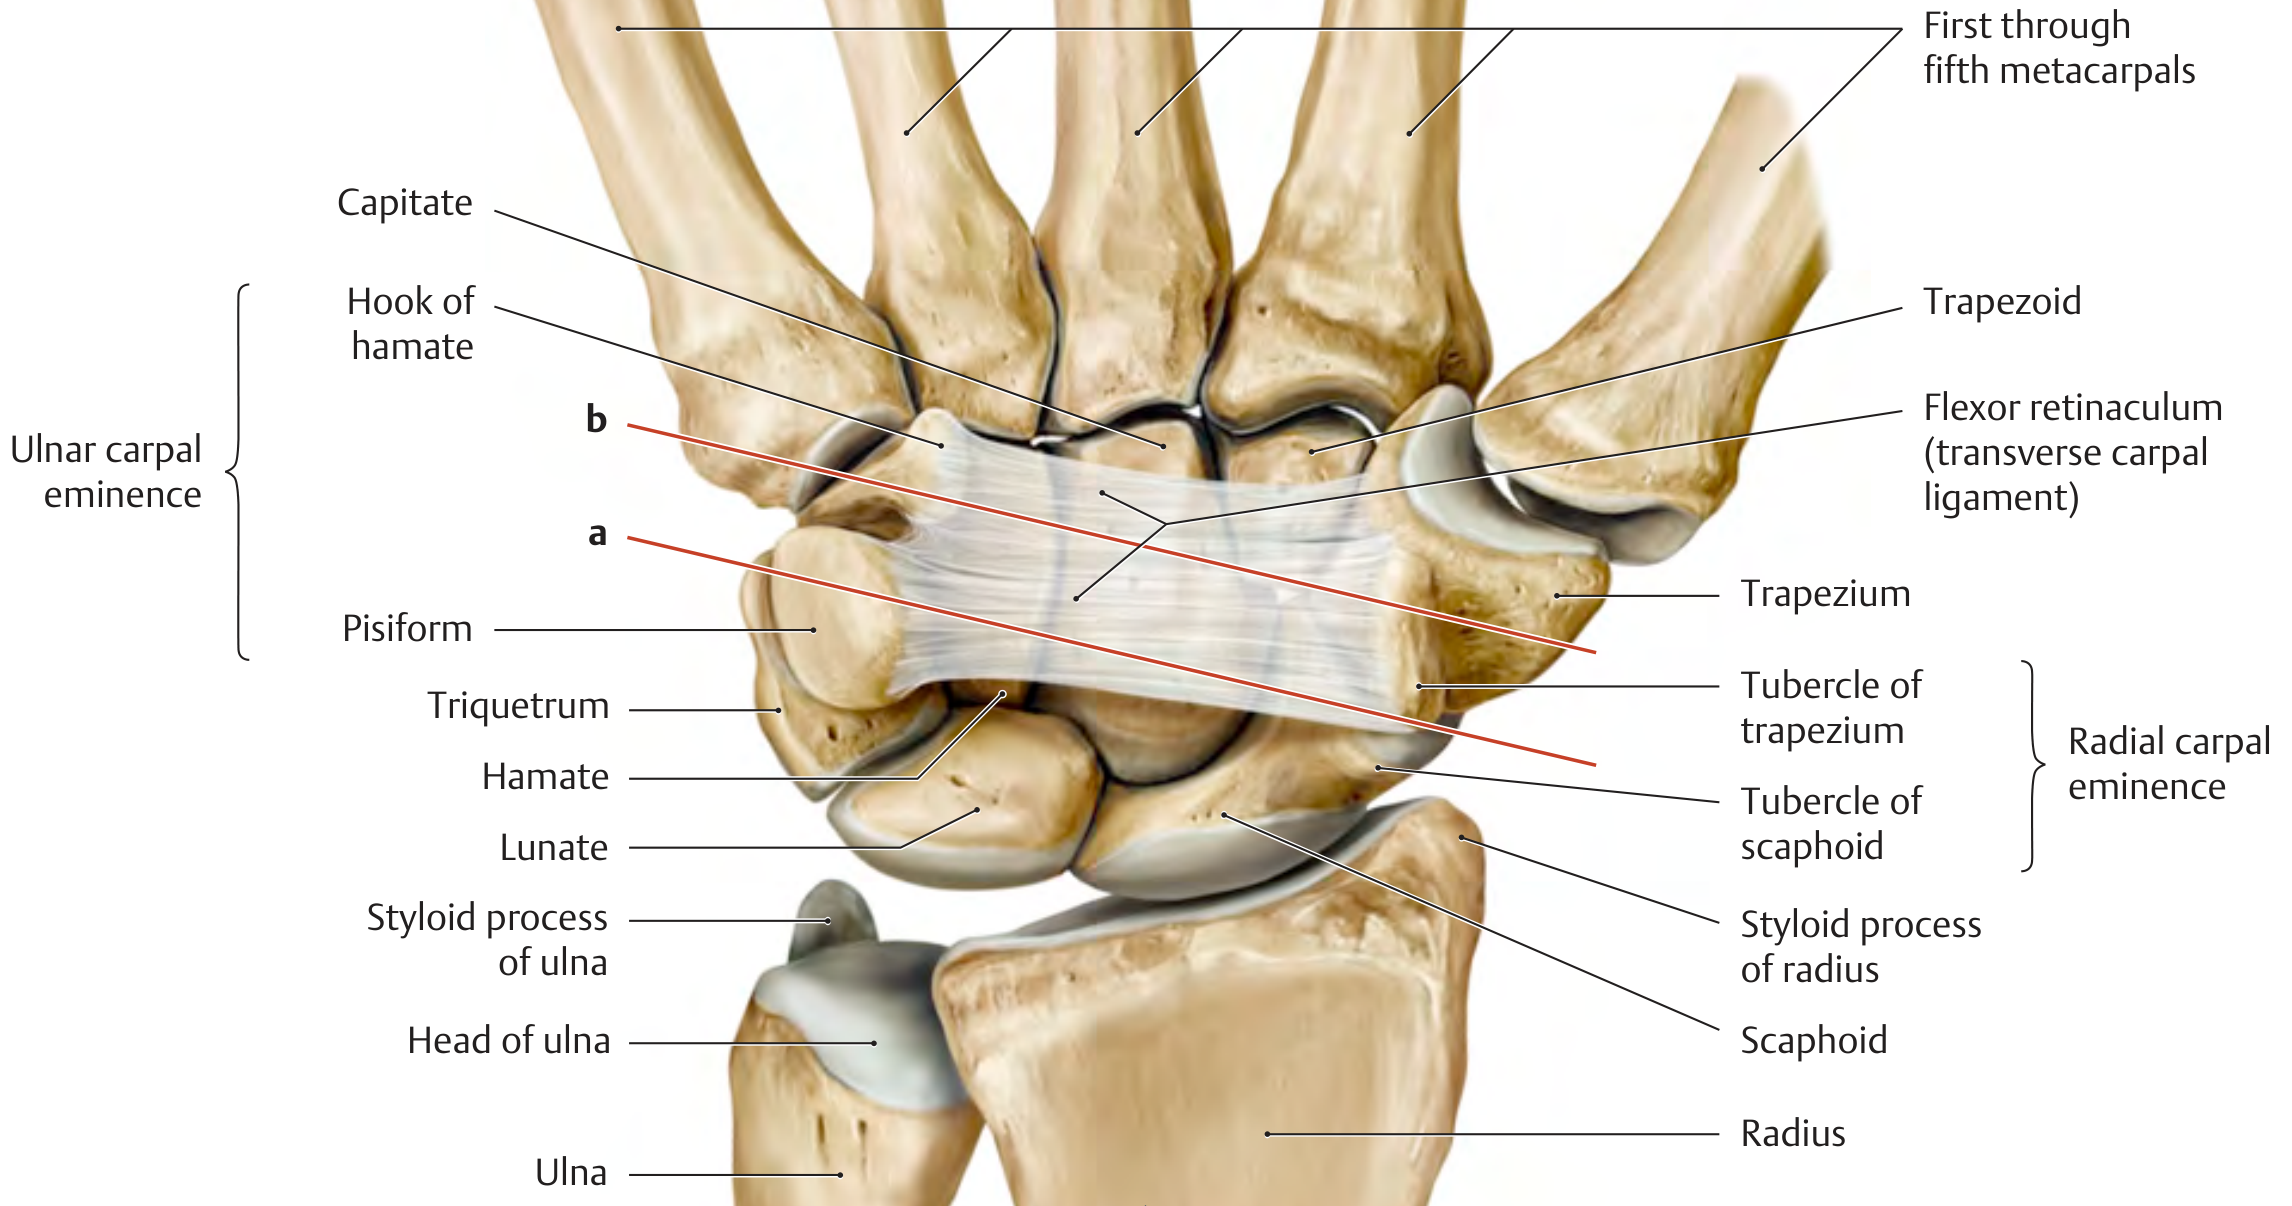
| Wall | Structure |
|---|---|
| Floor and sides (posterior/deep wall) | Carpal bones forming a bony concave groove on the palmar side |
| Medial wall (ulnar side) | Pisiform bone + Hook of hamate (= Ulnar carpal eminence) |
| Lateral wall (radial side) | Tubercle of scaphoid + Tubercle/ridge of trapezium (= Radial carpal eminence) |
| Roof (anterior/superficial wall) | Flexor retinaculum (= Transverse carpal ligament) |
The tunnel is narrowest at approximately 1 cm beyond the midline of the distal row of carpal bones; median cross-sectional area ≈ 1.6-1.7 cm²
Flexor Retinaculum (Transverse Carpal Ligament)
- Medially (ulnar side): Pisiform bone and hook of hamate
- Laterally (radial side): Tubercle of scaphoid and tubercle/ridge of trapezium
- Proximal margin: An imaginary line between the pisiform (palpable at the distal end of flexor carpi ulnaris tendon) and the tubercle of scaphoid (palpable at the distal end of flexor carpi radialis tendon)
- Distal margin: Deep to the junction of the anterior margin of thenar eminence with hypothenar eminence at the base of the palm
- Deep forearm fascia - proximal part
- Transverse carpal ligament (TCL) proper - over the wrist
- Aponeurosis between thenar and hypothenar muscles - distal part
- Palmaris longus tendon (inserts into it)
- Ulnar nerve and ulnar artery (pass superficial to it, through Guyon's canal)
- Palmar cutaneous branch of median nerve (passes superficial to it - hence NOT compressed in CTS)
Contents of the Carpal Tunnel
| Structure | Position within tunnel |
|---|---|
| Median nerve | Most anterior/superficial/palmar structure in the tunnel |
| Flexor pollicis longus (1 tendon) | Lateral side, in its own synovial sheath |
| Flexor digitorum superficialis (4 tendons) | Middle layer |
| Flexor digitorum profundus (4 tendons) | Posterior layer |
Note: Flexor carpi radialis has its own separate compartment in the groove of the trapezium - it does NOT pass through the main carpal tunnel.
Ulnar nerve and ulnar artery are NOT in the carpal tunnel - they pass through Guyon's canal (ulnar tunnel) which is superficial/medial to the flexor retinaculum.
Recurrent (Motor) Branch of Median Nerve
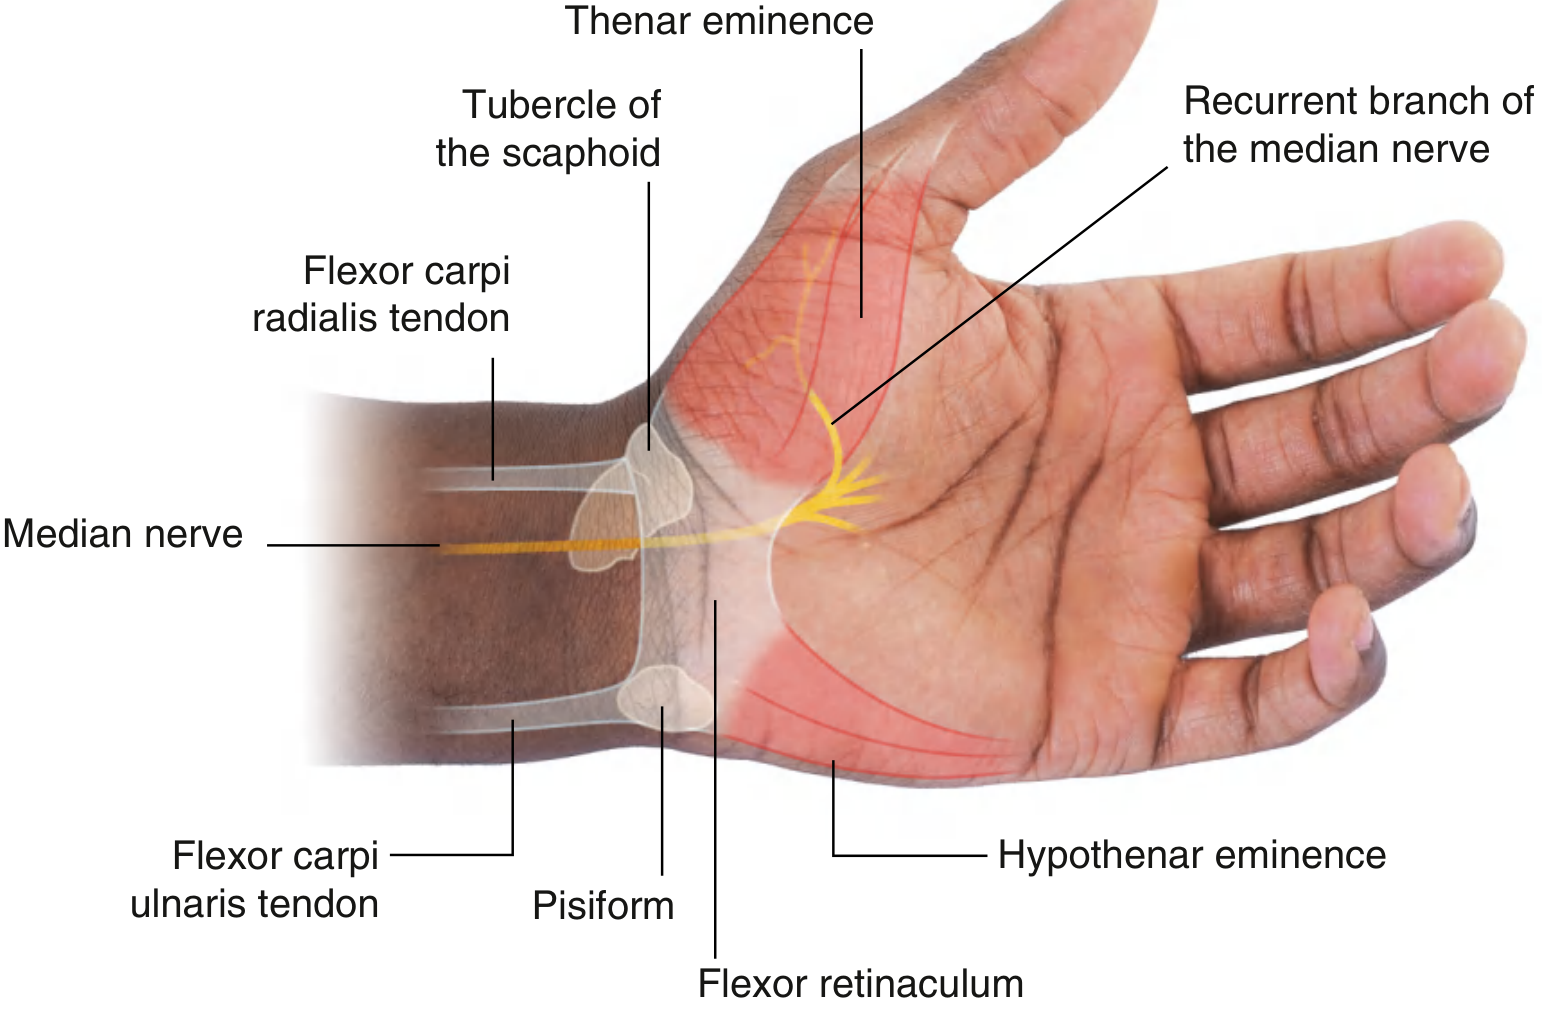
- The median nerve enters the carpal tunnel and at the distal end of the flexor retinaculum gives off its recurrent (thenar) branch
- This branch curves back ("recurs") radially to enter the thenar muscles
- It supplies: Abductor pollicis brevis (APB), Opponens pollicis, Flexor pollicis brevis (superficial head)
- It lies deep to the skin and deep fascia near the anterior margin of the thenar eminence
- This branch is at surgical risk during carpal tunnel release surgery
CARPAL TUNNEL SYNDROME (Applied Anatomy)
Definition
Aetiology - Causes of Increased Pressure in the Tunnel
- Rheumatoid arthritis (tenosynovitis of flexor tendons)
- Non-specific tenosynovitis
- Hypothyroidism (myxoedema)
- Diabetes mellitus
- Acromegaly
- Pregnancy (fluid retention - usually resolves post-delivery)
- Obesity
- Ganglion cyst
- Lipoma
- Amyloid deposits
- Colles' fracture malunion
- Carpal dislocations (especially lunate dislocation)
- Osteoarthritis
- Repetitive wrist flexion/extension (typing, carpentry, assembly workers)
Mechanism (Pathophysiology)
Clinical Features
- Pain, paraesthesiae (pins and needles), numbness in the lateral 3½ fingers (thumb, index, middle, lateral half of ring finger) = median nerve distribution
- Night pain (wakes patient from sleep) - classic; relieved by shaking or dangling the hand (flick sign)
- Pain may radiate to forearm or shoulder
- Thenar eminence skin - normal sensation (palmar cutaneous branch exits proximal to tunnel)
- Little finger and medial half of ring finger - ulnar nerve territory
- Weakness of thumb abduction (APB paralysis)
- Weakness of opposition of thumb
- Wasting of thenar eminence (advanced sign; known as "Ape hand" in severe/long-standing cases)
Clinical Tests
| Test | Method | +ve Result |
|---|---|---|
| Tinel's sign | Tapping over flexor retinaculum at wrist | Tingling in lateral 3½ fingers (most specific) |
| Phalen's test | Wrist in full flexion for 1-2 min | Tingling/numbness in median distribution (most sensitive ~74%) |
| Durkan's test | Direct compression over carpal tunnel for 30 sec | Paraesthesiae in median distribution |
| APB test | Thumb abduction against resistance | Weakness indicates motor involvement |
Investigations
- Nerve conduction studies (NCS) - Gold standard
- Prolonged distal sensory latency (earliest finding)
- Prolonged distal motor latency
- Reduced SNAP amplitude
- EMG - denervation potentials in APB (fibrillation, polyphasic potentials)
- Ultrasound - enlarged median nerve cross-sectional area (>9-14 mm²)
- Blood tests - to identify cause: TFTs, fasting glucose, RF, ESR
Treatment
- Wrist splint in neutral position - worn at night; first-line treatment
- Corticosteroid injection into carpal tunnel - temporary relief
- Treat underlying cause
- Division of the flexor retinaculum (transverse carpal ligament)
- Two approaches:
- Open CTR - longitudinal palmar incision; direct visualization
- Endoscopic CTR - minimally invasive; faster recovery; generally preferred
- Indication: failed conservative treatment, severe/progressive symptoms, thenar wasting
Surgical danger: The recurrent branch of median nerve must be identified and preserved during CTR as it curves back into the thenar eminence.
Summary (BDC Rapid Revision Box)
CARPAL TUNNEL
Roof → Flexor retinaculum (transverse carpal ligament)
Floor → Carpal bones (concave arch)
Medial → Pisiform + Hook of hamate
Lateral → Tubercle of scaphoid + Ridge of trapezium
CONTENTS (1 nerve + 9 tendons):
Nerve → Median nerve (most superficial in tunnel)
Tendons → FPL (1) + FDS (4) + FDP (4)
NOT in tunnel → Ulnar nerve, Ulnar artery (Guyon's canal)
→ FCR (separate compartment in trapezium)
→ Palmar cutaneous branch of median nerve (exits proximal to retinaculum)
CTS = Median nerve entrapment
Sensory → Lateral 3½ fingers (NOT thenar eminence)
Motor → Thenar muscles (APB, Opponens, FPB)
Sign → Night pain + hand shaking relief
Tests → Tinel's (specific), Phalen's (sensitive)
Rx → Splint → Steroid → Surgery (CTR)
Explain shoulder joint
shoulder joint glenohumeral anatomy ligaments rotator cuff diagram
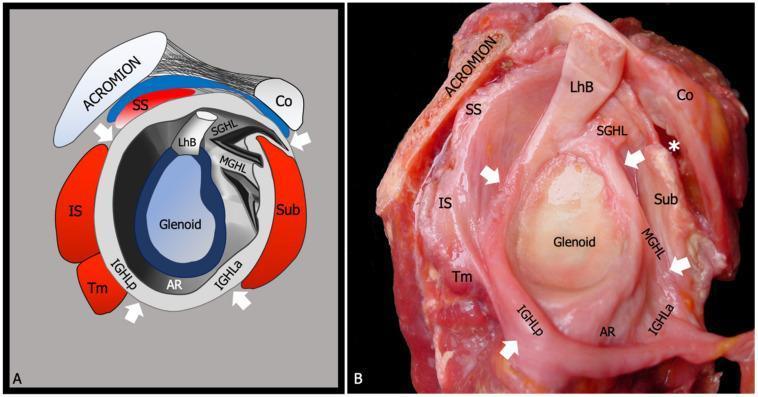
This dual-panel image provides a side-by-side comparison between a schematic anatomical diagram (A) and a gross anatomic dissection (B) of the human glenohumeral joint, viewed from a lateral perspective with the humeral head removed. The focus is on the glenohumeral joint capsule and its relationship with the rotator cuff. Key anatomical landmarks identified include the glenoid cavity, coracoid process (Co), acromion, and the long head of the biceps tendon (LhB). The capsule is illustrated as a continuous fibrous structure with focal thickenings representing the intrinsic glenohumeral ligaments: the superior (SGHL), middle (MGHL), and the anterior (IGHLa) and posterior (IGHLp) bands of the inferior glenohumeral ligament. The inferior redundant portion of the capsule, the axillary recess (AR), is clearly labeled. The surrounding rotator cuff tendons—supraspinatus (SS), infraspinatus (IS), teres minor (Tm), and subscapularis (Sub)—are shown in their respective superior, posterior, and anterior positions, demonstrating how they reinforce the joint capsule. This material serves as a baseline for understanding shoulder stability and the pathophysiology of adhesive capsulitis.
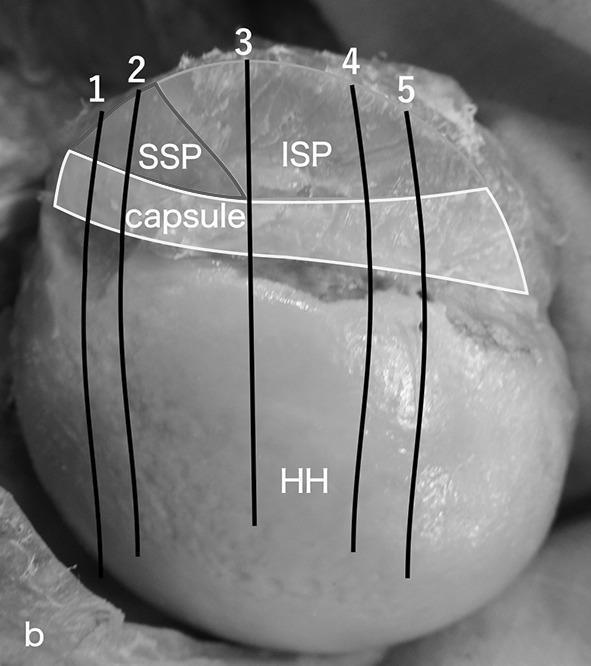
This medical anatomical diagram and clinical photograph illustrate the spatial relationships and histological sectioning planes of the rotator cuff complex. The image shows a superior and lateral view of the humeral head (HH) with the overlying glenohumeral joint capsule and associated tendons. The supraspinatus (SSP) and infraspinatus (ISP) tendons are clearly demarcated, with the capsule positioned deep to these musculotendinous structures. Five vertical black lines (labeled 1–5) indicate the orientations of coronal sections used for microscopic observation. Lines 1 and 2 correspond to the anterior and posterior regions of the supraspinatus tendon, respectively. Lines 3, 4, and 5 represent the superior, middle, and inferior partitions of the infraspinatus tendon. This visual is designed to demonstrate the integrated anatomy of the rotator cuff attachment site (footprint) and the specific sub-regions of the tendons relative to the joint capsule, serving as a guide for orthopedic pathology or anatomical study of shoulder biomechanics.
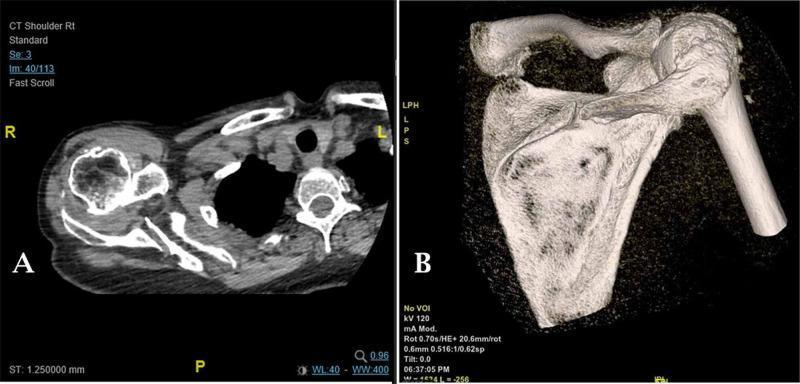
This composite diagnostic image features the right shoulder of a human patient, displaying a Computed Tomography (CT) scan in two formats. Panel A shows an axial CT slice demonstrating the cross-sectional anatomy of the glenohumeral joint. Key findings include superior migration of the humeral head, severe joint space narrowing, and subchondral sclerosis, consistent with rotator cuff arthropathy. A cortical discontinuity is visible in the posterior aspect of the scapular spine, indicating a fracture. Panel B presents a three-dimensional (3D) reconstruction of the same shoulder. The reconstruction clearly illustrates a non-union fracture involving the medial third of the scapular spine. Additionally, the 3D view shows marked erosion of the acromion and an irregular glenohumeral articulation. The bone texture appears osteopenic and irregular. These findings are clinically relevant for diagnosing chronic atraumatic scapular fractures in the setting of severe rotator cuff deficiency and possible corticosteroid-induced bone loss.
This diagnostic image is a magnetic resonance imaging (MRI) scan of the human shoulder joint, specifically an oblique coronal view utilizing fat-suppression techniques (likely SPAIR). The image clearly depicts the glenohumeral joint anatomy, featuring the rounded humeral head situated within the glenoid cavity. Anatomical landmarks include the acromion process superiorly and the surrounding rotator cuff musculature. A focal area of concern is localized within the supraspinatus tendon, where abnormal signal intensity is observed. This hyperintense (bright) signal contrast against the typically hypointense (dark) tendon fibers suggests pathology such as a partial-thickness tear, tendinosis, or associated inflammatory edema. The educational value of this image lies in its demonstration of MRI signal characteristics used to diagnose rotator cuff injuries and the evaluation of tendon integrity relative to adjacent bony structures like the humeral head and acromion.
rotator cuff muscles SITS supraspinatus infraspinatus teres minor subscapularis
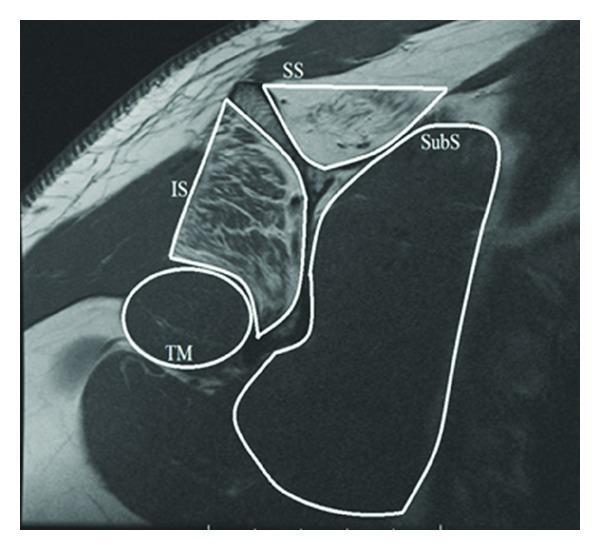
A T1-weighted MRI scan in the sagittal oblique plane demonstrating the rotator cuff musculature of the shoulder. The image highlights the anatomical arrangement and tissue characteristics of the four primary rotator cuff muscles, delineated by white outlines: the supraspinatus (SS), infraspinatus (IS), subscapularis (SubS), and teres minor (TM). Clinically significant findings include increased T1 signal intensity (hyperintensity) within the muscle bellies of the supraspinatus and infraspinatus, indicative of advanced fatty infiltration and muscle atrophy. In contrast, the subscapularis and teres minor maintain a normal, lower signal intensity (isointense to other skeletal muscles). The spatial relationship shows the supraspinatus superiorly, the infraspinatus posteriorly, the subscapularis anteriorly, and the teres minor inferior to the infraspinatus. This diagnostic image is used in orthopedics and radiology to assess chronic rotator cuff tears and associated muscle degeneration, which has implications for surgical prognosis and functional outcomes.
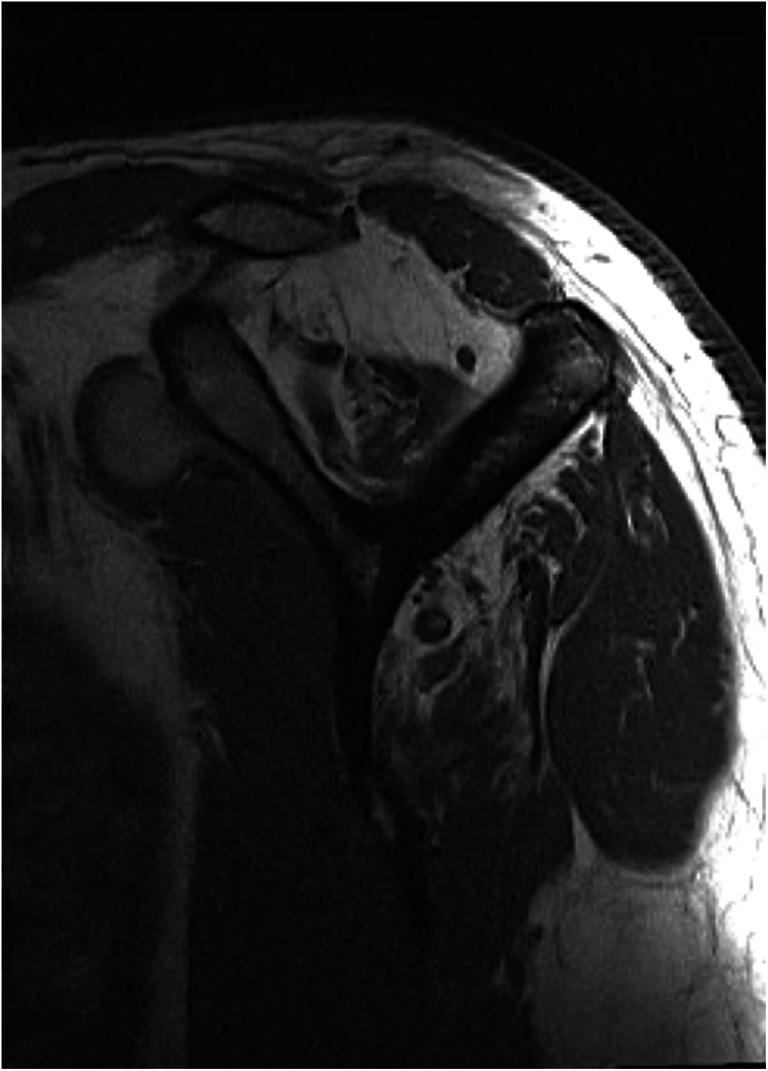
This diagnostic image is a T1-weighted parasagittal MR slice of the shoulder, specifically oriented to evaluate the rotator cuff musculature. The image demonstrates advanced fatty infiltration and muscular atrophy, critical for determining the reparability of chronic rotator cuff tears. The supraspinatus muscle shows a significant loss of muscle bulk (atrophy) and high signal intensity (hyperintensity), indicating replacement of muscle fibers by adipose tissue, consistent with a high Goutallier stage. Similarly, the infraspinatus muscle exhibits marked fatty degeneration. In contrast, the subscapularis and teres minor muscles maintain a normal, low-signal appearance (hypointense) relative to the fat, indicating preserved muscle quality without significant degeneration. This comparison serves as a key clinical indicator in orthopedic radiology for surgical planning and prognosis in patients with tendon pathology.
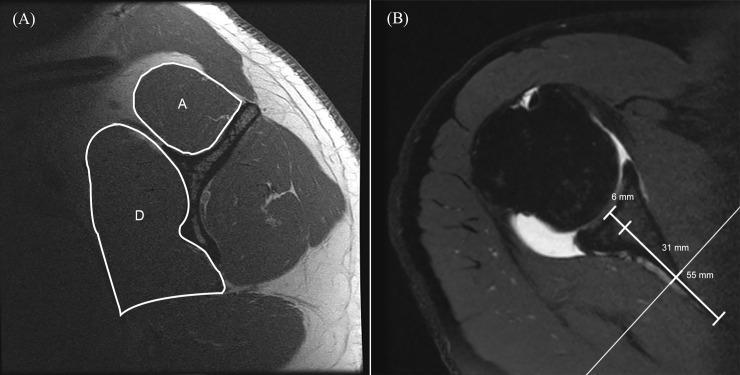
This dual-panel diagnostic image demonstrates a standardized methodology for measuring the cross-sectional area (CSA) of rotator cuff muscles using Magnetic Resonance Imaging (MRI). The left panel (A) is a sagittal T1-weighted MR-arthrography image taken 31 mm medial to the glenoid cavity. It displays outlined regions for the supraspinatus (labeled 'A') and the subscapularis (labeled 'D'). The supraspinatus appears as a superior, rounded structure, while the subscapularis is larger and more elongated, positioned anteriorly. The right panel (B) is an axial Proton Density (PD)-weighted image showing the medial distance landmarks from the glenoid cavity base used to define specific measurement planes: 6 mm for the teres minor, 31 mm for the supraspinatus and subscapularis (indicated by a white reference line), and 55 mm for the infraspinatus. This protocol is utilized in musculoskeletal radiology to objectively quantify muscle atrophy or hypertrophy in patients with rotator cuff pathology, providing anatomical landmarks for reproducible clinical assessment.
Shoulder Joint (Glenohumeral Joint)
1. Type and Introduction
2. Articular Surfaces
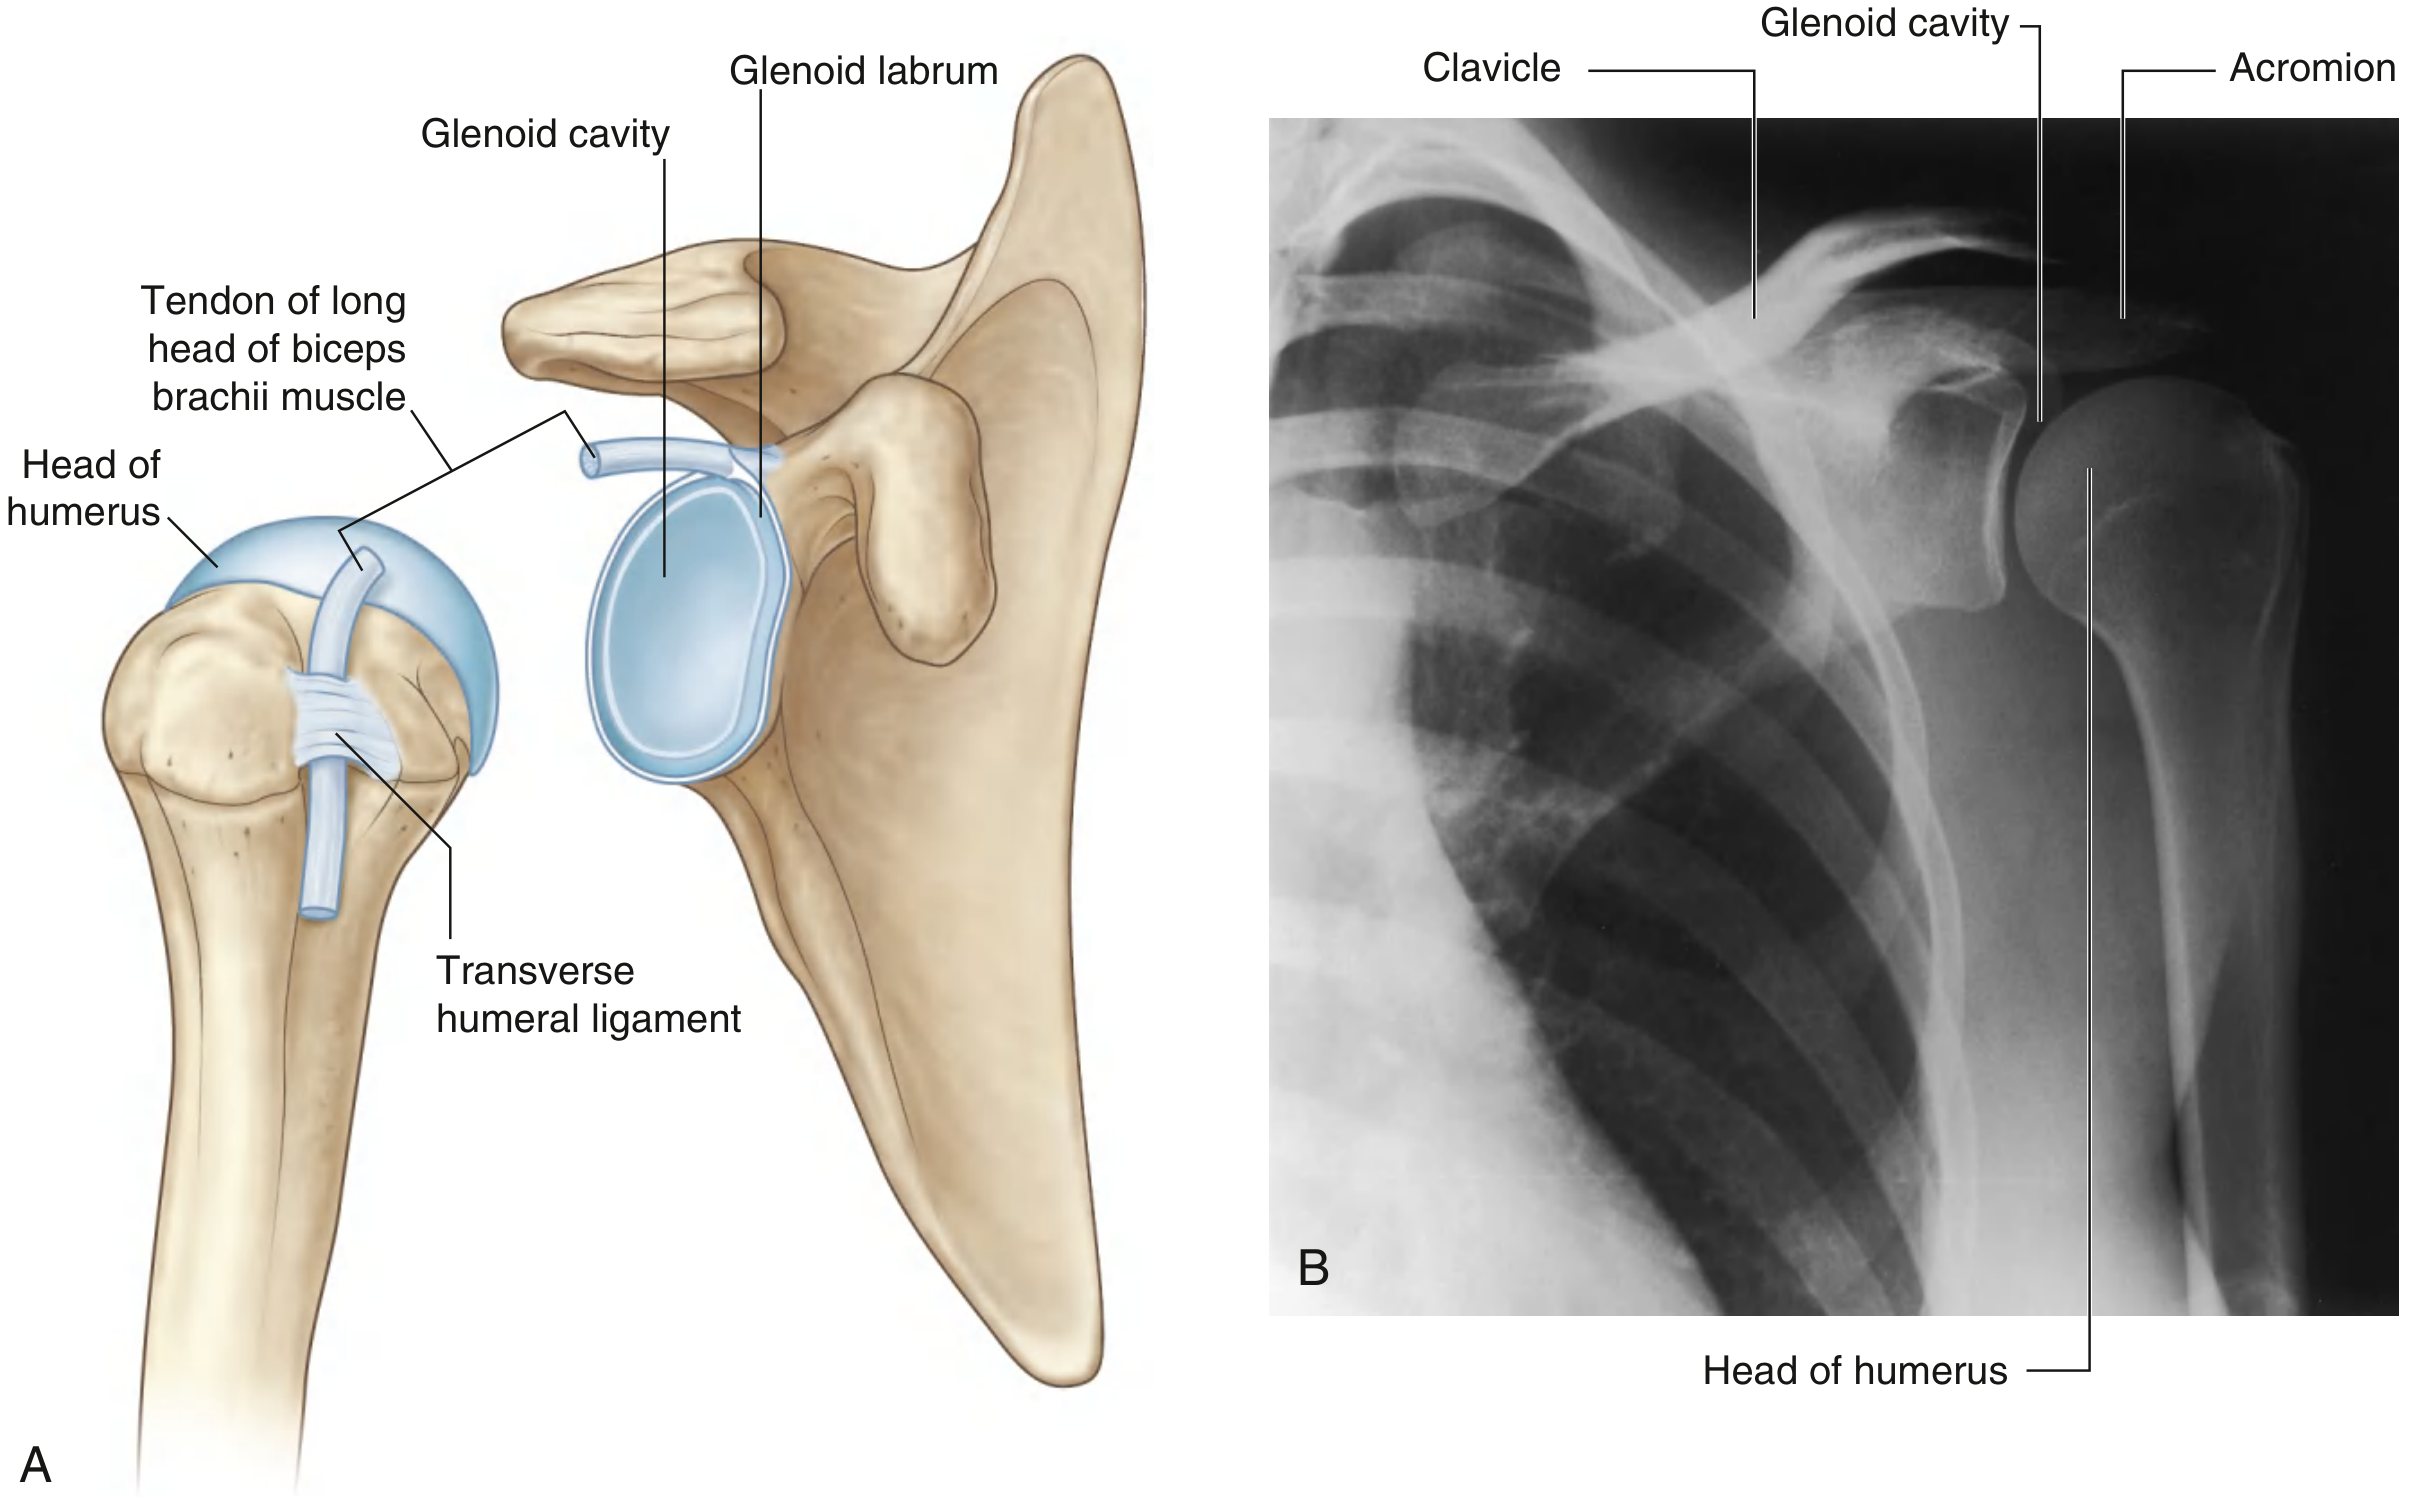
| Surface | Bone | Description |
|---|---|---|
| Head of humerus | Humerus | Large, spherical; covered by hyaline cartilage; faces medially, superiorly, and posteriorly |
| Glenoid cavity | Scapula | Small, shallow, pear-shaped fossa; covered by hyaline cartilage |
- The humeral head is roughly 3-4 times larger than the glenoid cavity - like a golf ball on a tee
- This mismatch allows wide range of motion but reduces inherent bony stability
Glenoid Labrum
- A fibrocartilaginous rim attached to the margin of the glenoid cavity
- Deepens and expands the socket peripherally
- Superiorly, it is continuous with the tendon of the long head of biceps brachii which attaches to the supraglenoid tubercle and passes through the articular cavity
3. Joint Capsule
Fibrous Membrane
- Attaches to the margin of the glenoid cavity (outside the labrum and biceps attachment) and to the anatomical neck of the humerus
- Medially, the attachment extends inferiorly onto the shaft (redundant area = axillary recess) - this accommodates abduction
- The capsule is thin and loose posteriorly and inferiorly (weakest point) and thickened anteriorly by glenohumeral ligaments
Synovial Membrane
- Lines the inner surface of the fibrous capsule
- Attaches to margins of articular cartilage
- Loose inferiorly (accommodates abduction)
- Folds around the tendon of the long head of biceps and extends along it into the intertubercular sulcus
- Protrudes through apertures to form bursae
4. Ligaments
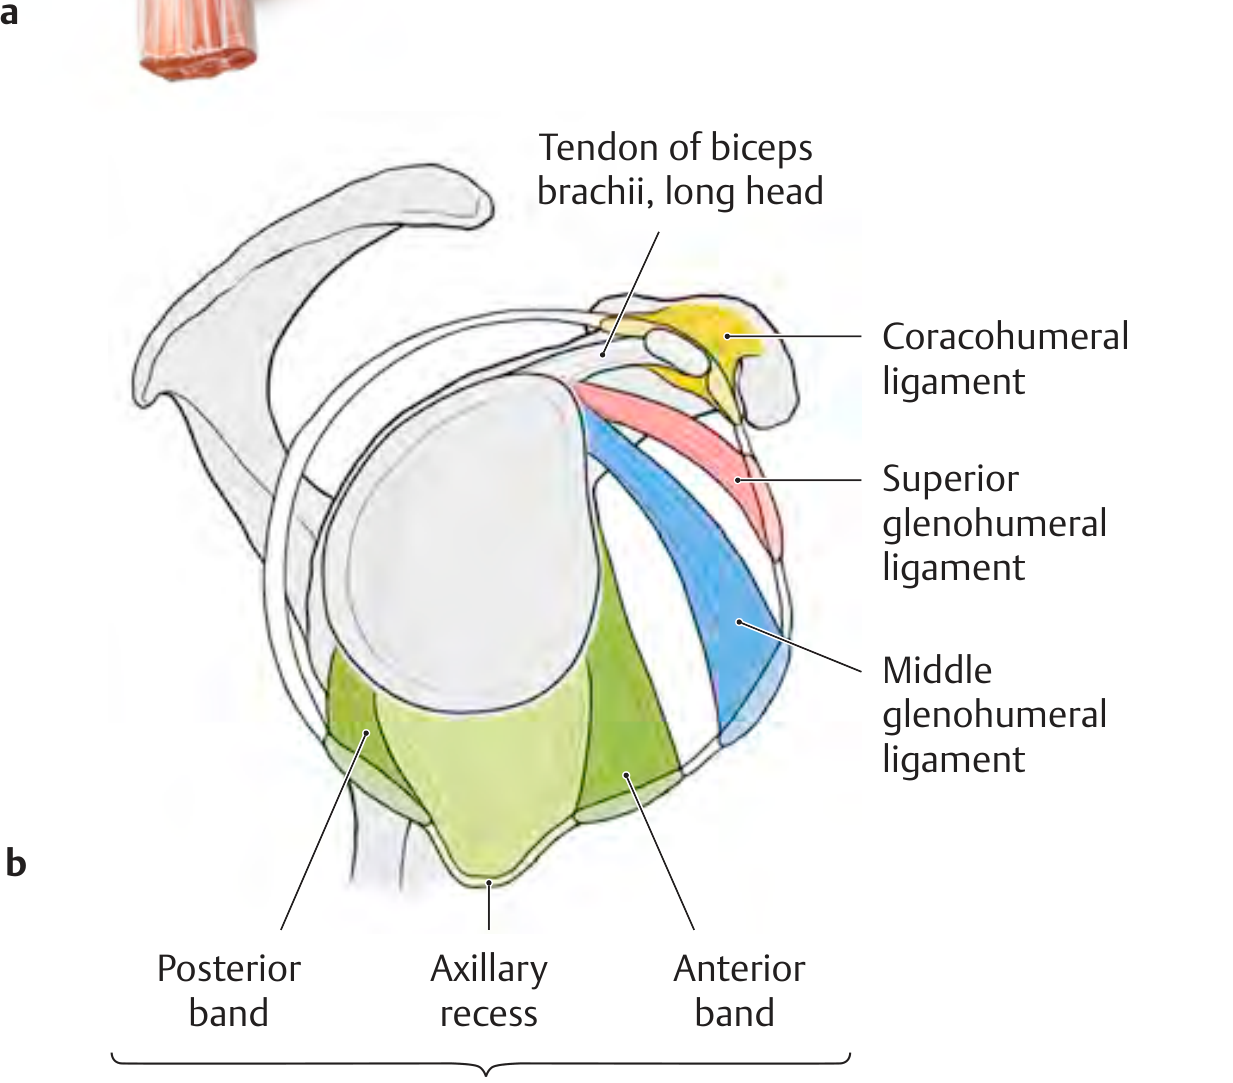
A. Glenohumeral Ligaments (Intrinsic - thickenings of the anterior capsule)
| Ligament | Origin | Insertion | Function |
|---|---|---|---|
| Superior GHL | Upper margin of glenoid | Intertubercular groove + lesser tubercle | Limits inferior translation when arm adducted; forms biceps pulley with coracohumeral ligament |
| Middle GHL | Upper margin of glenoid | Anatomical neck of humerus | Limits external rotation and anterior translation (arm at 45-60° abduction) |
| Inferior GHL | Inferior margin of glenoid | Anatomical neck and surgical neck | Most important stabilizer; limits anterior-inferior dislocation; acts as a hammock during abduction |
B. Coracohumeral Ligament (Extrinsic - strongest ligament)
- From: base of coracoid process
- To: greater and lesser tubercles of humerus (two bands)
- Function:
- Resists inferior translation of the humeral head (most important when arm at side)
- Stabilizes the tendon of the long head of biceps in the intertubercular groove (forms the "biceps pulley" with superior GHL)
- Limits external rotation
C. Transverse Humeral Ligament
- Spans between greater and lesser tubercles of the humerus
- Holds the tendon of the long head of biceps in the intertubercular (bicipital) groove
D. Coracoacromial Ligament (NOT a true joint ligament - extracapsular arch)
- From: coracoid process to acromion
- Forms the coracoacromial arch with the coracoid and acromion
- This arch protects the humeral head superiorly but can cause subacromial impingement
5. Bursae
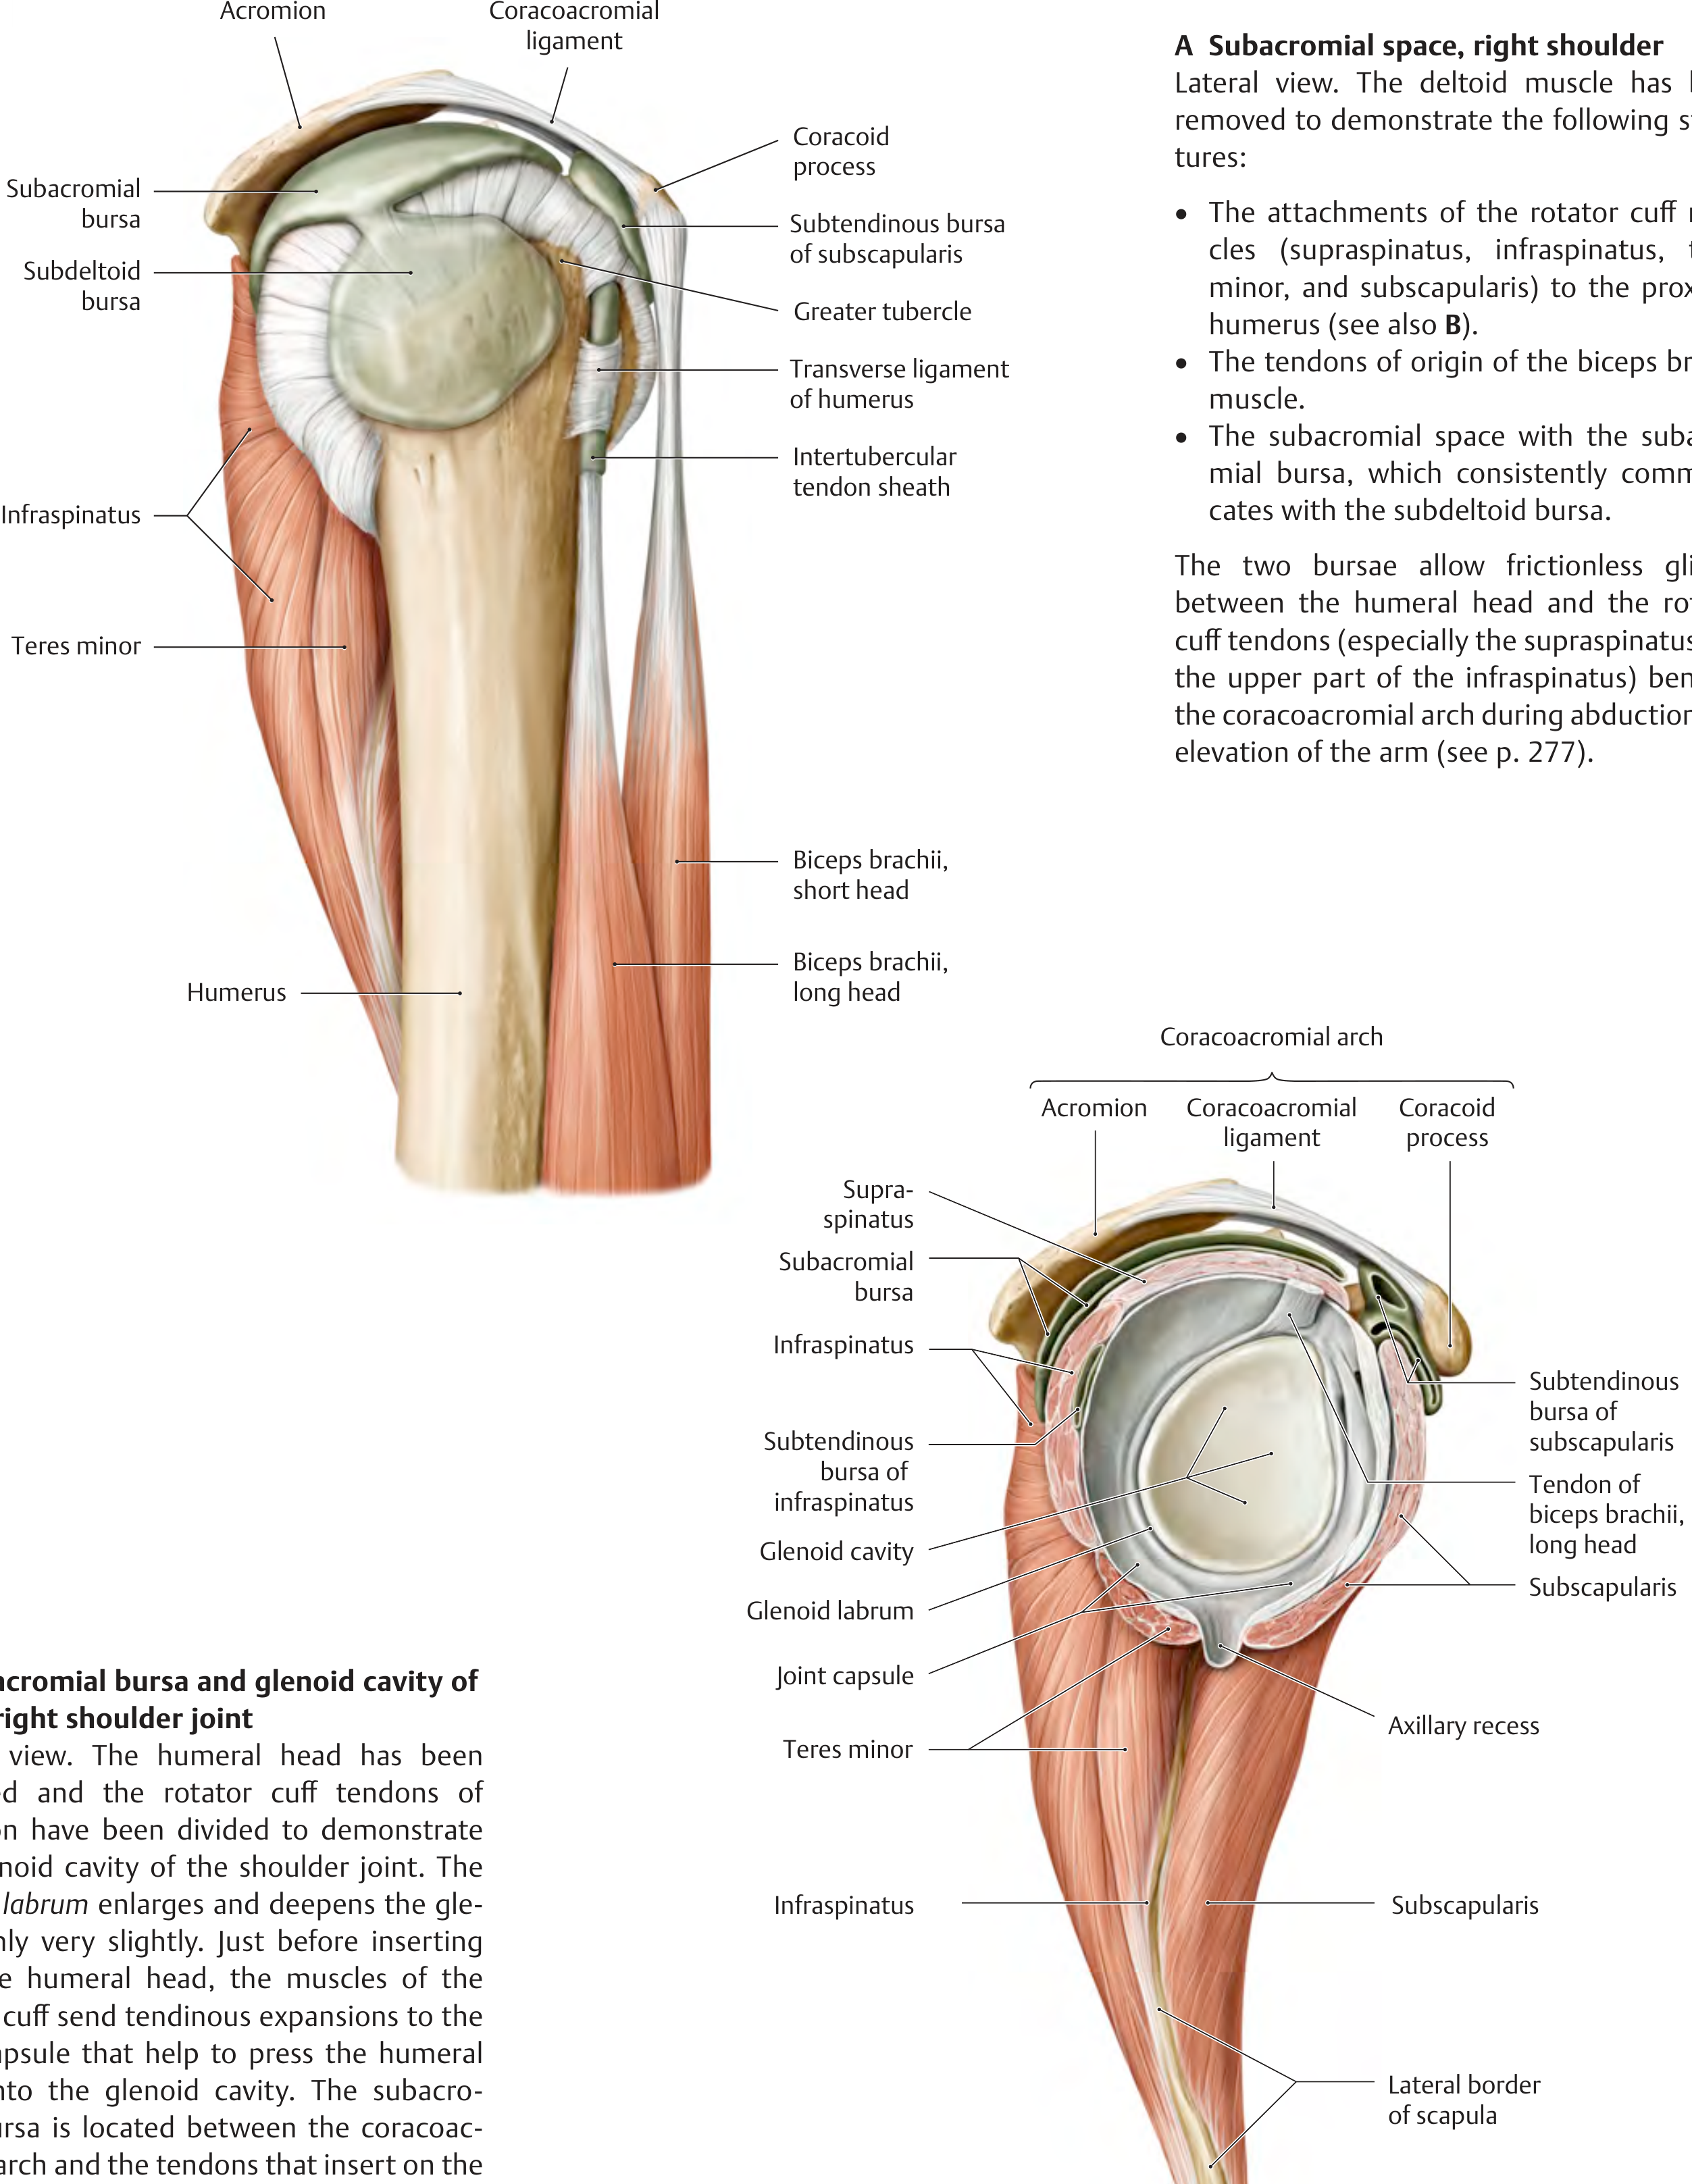
| Bursa | Location | Communication with joint |
|---|---|---|
| Subacromial bursa (= subdeltoid bursa) | Between acromion/deltoid and supraspinatus/capsule | Does NOT communicate (normally) |
| Subtendinous bursa of subscapularis | Between subscapularis tendon and capsule | Communicates (opens into joint) |
| Subcoracoid bursa | Between coracoid process and capsule | Sometimes communicates |
| Infraspinatus bursa | Between infraspinatus and capsule | Sometimes communicates |
The subacromial bursa is the largest and most clinically important. It allows frictionless gliding of the rotator cuff tendons under the coracoacromial arch during abduction. Inflammation = subacromial bursitis (most common cause of shoulder pain).
6. Rotator Cuff Muscles (SITS)
| Muscle | Origin | Insertion | Nerve | Action | Position on capsule |
|---|---|---|---|---|---|
| Supraspinatus | Supraspinous fossa | Greater tubercle (superior facet) | Suprascapular (C5) | Initiates abduction (0-15°); stabilises head | Superior |
| Infraspinatus | Infraspinous fossa | Greater tubercle (middle facet) | Suprascapular (C5,6) | Lateral (external) rotation | Posterior |
| Teres minor | Lateral border scapula | Greater tubercle (inferior facet) | Axillary (C5) | Lateral (external) rotation | Posterior-inferior |
| Subscapularis | Subscapular fossa | Lesser tubercle | Lower and upper subscapular (C5,6) | Medial (internal) rotation | Anterior |
Mnemonic: SITS (Supraspinatus, Infraspinatus, Teres minor, Subscapularis)
7. Other Muscles Acting on the Shoulder Joint
| Muscle | Main Action |
|---|---|
| Deltoid (anterior fibres) | Flexion |
| Deltoid (middle fibres) | Abduction (above 15°) |
| Deltoid (posterior fibres) | Extension |
| Pectoralis major | Adduction, medial rotation, flexion |
| Latissimus dorsi | Adduction, extension, medial rotation |
| Long head of biceps | Stabilises humeral head (against upward displacement) |
| Teres major | Medial rotation, adduction |
| Coracobrachialis | Flexion, adduction |
8. Movements and Range
| Movement | Range | Muscles |
|---|---|---|
| Flexion | 0-180° | Deltoid (anterior), pectoralis major, biceps, coracobrachialis |
| Extension | 0-60° | Deltoid (posterior), teres major, latissimus dorsi |
| Abduction | 0-180° (90° at GH joint + 60° scapular rotation) | Supraspinatus (0-15°), deltoid (15-90°), trapezius + serratus anterior (90-180°) |
| Adduction | 0-45° | Pectoralis major, latissimus dorsi, teres major |
| Medial rotation | 0-70° | Subscapularis, pectoralis major, latissimus dorsi, teres major, deltoid (anterior) |
| Lateral rotation | 0-90° | Infraspinatus, teres minor, deltoid (posterior) |
| Circumduction | Combination of above | All muscles |
9. Blood Supply
- Anterior circumflex humeral artery (from axillary artery)
- Posterior circumflex humeral artery (from axillary artery - larger, travels through quadrangular space with axillary nerve)
- Suprascapular artery (from thyrocervical trunk)
- Subscapular artery branches
10. Nerve Supply
| Nerve | Root | Structures supplied |
|---|---|---|
| Axillary nerve | C5, C6 | Anterior and posterior capsule; deltoid, teres minor |
| Suprascapular nerve | C5, C6 | Superior and posterior capsule; supraspinatus, infraspinatus |
| Lateral pectoral nerve | C5-C7 | Anterior capsule |
| Musculocutaneous nerve | C5-C7 | Small contribution to anterior capsule |
Hilton's Law: A nerve that supplies a muscle acting on a joint also supplies the joint itself and the skin over it.
11. Clinical Anatomy
| Condition | Anatomical Basis |
|---|---|
| Anterior dislocation (most common ~95%) | Humeral head tears the inferior capsule/labrum and dislocates anteroinferiorly. Axillary nerve most commonly injured. |
| Bankart lesion | Avulsion of the anteroinferior glenoid labrum with/without bony fragment - common in recurrent dislocations |
| Hill-Sachs lesion | Compression fracture of posterosuperior humeral head against anteroinferior glenoid rim during dislocation |
| Rotator cuff tear | Usually supraspinatus at its insertion ("critical zone" - avascular area 1 cm from insertion). Causes painful arc 60-120° |
| Subacromial impingement | Supraspinatus tendon trapped between humeral head and coracoacromial arch. Painful arc 60-120°. |
| Frozen shoulder (adhesive capsulitis) | Contraction of the joint capsule and obliteration of axillary recess. Global restriction of all movements, especially lateral rotation. |
| Painful arc syndrome | Pain between 60-120° of abduction = supraspinatus or subacromial bursa pathology |
Summary Table
| Feature | Detail |
|---|---|
| Type | Synovial ball-and-socket (multiaxial) |
| Articulation | Head of humerus + Glenoid cavity of scapula |
| Stability | Primarily muscular (rotator cuff); skeletal stability is poor |
| Most mobile joint | Yes - all planes |
| Weakest point | Inferior capsule (no rotator cuff cover) |
| Most common dislocation | Anterior (anteroinferior) |
| Key stabilisers | Rotator cuff (SITS), glenoid labrum, glenohumeral ligaments, long head biceps |
| Nerve supply | Axillary (C5,6), suprascapular (C5,6), musculocutaneous |
| Blood supply | Anterior + posterior circumflex humeral arteries |
Astigmatism explain.
astigmatism refractive error corneal curvature focal lines diagram
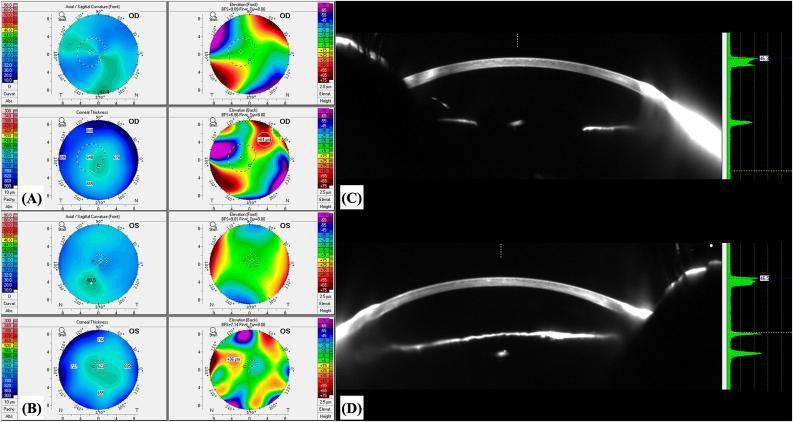
This composite diagnostic image displays corneal tomographic and densitometric analysis for both eyes (OD and OS) of a patient using the Pentacam® AXL system. Panels (A) and (B) present 4-map refractive displays for the right and left eyes, respectively, including axial/sagittal curvature, anterior and posterior elevation maps, and corneal thickness (pachymetry) maps. The curvature maps show relatively regular astigmatism, while the thickness maps illustrate the spatial distribution of the cornea, highlighting areas of thickening or thinning. Panels (C) and (D) provide Scheimpflug photographs showing cross-sectional views of the anterior segment. Adjacent to these photographs are densitometry histograms that quantify light scattering (backscatter) across the corneal layers. These scans are used to evaluate corneal pathologies such as peripheral corneal edema or Brown-McLean syndrome, as indicated by the characteristic densitometry spikes and pachymetric shifts. The images demonstrate the relationship between corneal structure, thickness variations, and optical transparency in a clinical ophthalmological assessment.
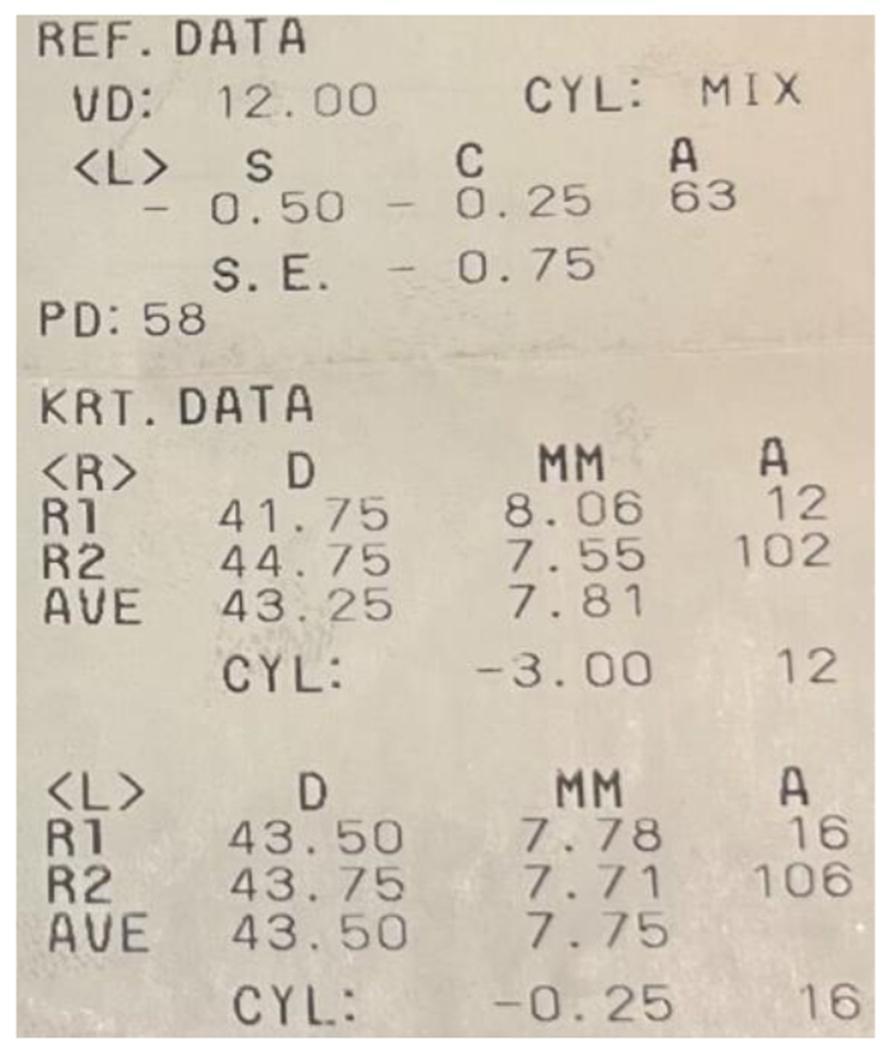
A clinical photograph of a printed thermal receipt containing diagnostic ophthalmological measurements from an automated refractometer/keratometer. The document is divided into two primary sections: REF. DATA (Refractive Data) and KRT. DATA (Keratometry Data). Under REF. DATA, findings for the left eye <L> are displayed, showing a sphere (S) of -0.50 D, a cylinder (C) of -0.25 D at axis (A) 63, and a spherical equivalent (S.E.) of -0.75. The vertex distance (VD) is 12.00 mm and pupillary distance (PD) is 58 mm. The KRT. DATA section provides corneal curvature readings for the right <R> and left <L> eyes. For the right eye, R1 and R2 readings indicate a corneal dioptric power (D) of 41.75 and 44.75 respectively, with a resulting high corneal cylinder (CYL) of -3.00 D. For the left eye, R1 and R2 values are 43.50 D and 43.75 D, showing a minimal cylinder of -0.25 D. The data also includes radius of curvature in millimeters (MM) and axis (A) for each meridian. This information is critical for assessing astigmatism and corneal steepness in clinical ocular evaluations.
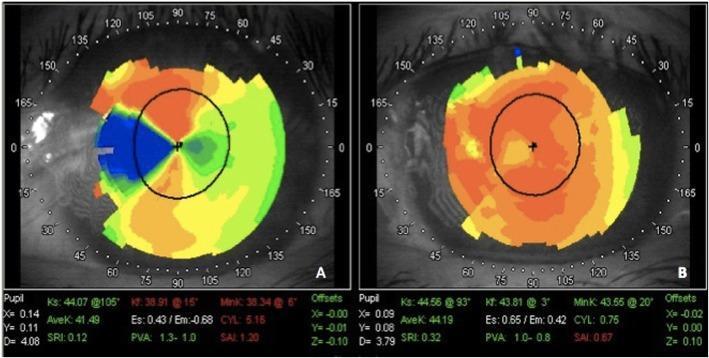
This diagnostic image set displays color-coded corneal topography maps of a left eye before (Image A) and after (Image B) surgical excision of a recurrent pterygium combined with phototherapeutic keratectomy (PTK). Image A shows a preoperative state with significant irregular astigmatism, characterized by a concentrated blue area in the nasal quadrant indicating steep corneal curvature and high refractive power contrast. Quantitative data in Image A notes a high cylinder value of 5.15 D and a surface asymmetry index (SAI) of 1.20. Image B displays the postoperative result two weeks later, showing a more uniform color distribution (primarily orange and yellow) across the central cornea, signifying a smoother surface and more regular curvature. Corresponding data in Image B reflects clinical improvement with the cylinder reduced to 0.75 D and SAI reduced to 0.67. This comparison illustrates the efficacy of PTK in regularizing the corneal surface and reducing cylinder following pterygium removal in ophthalmology patients.
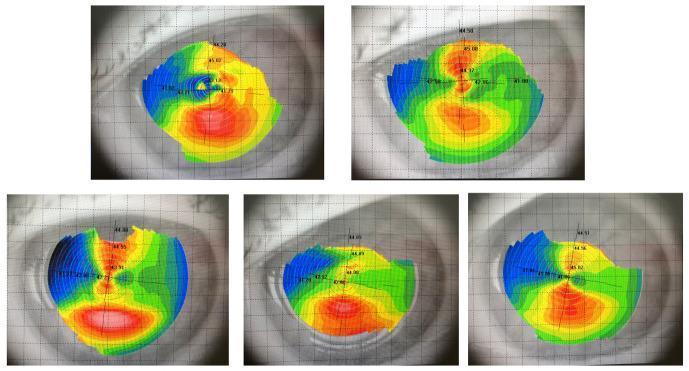
A compilation of five Placido disc-based corneal topography maps illustrating the variability in corneal curvature and surface regularity. The diagnostic images display color-coded dioptric power maps overlaid on the anterior segment of the human eye. The color scale uses a standard cooling/warming spectrum: blue and green represent flatter peripheral areas, while yellow, orange, and red represent areas of steeper curvature, typically concentrated centrally or inferiorly. The maps exhibit various patterns, including asymmetric bowties and irregular steepening, which are clinically significant in the screening and diagnosis of corneal ectasias like keratoconus. A fine grid is superimposed over each map, where the distortion of the grid lines correlates with rapid changes in surface topography and local irregular astigmatism. Quantitative values in diopters are visible as numeric annotations across the maps to facilitate precise clinical assessment of the corneal refractive power.
astigmatism types with the rule against the rule oblique sturm conoid
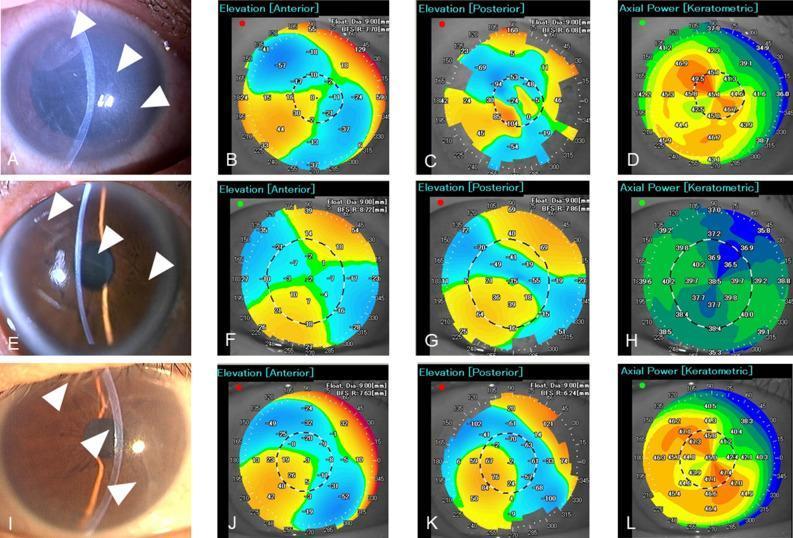
This composite ophthalmological figure displays clinical and diagnostic imaging from three cases of forceps-induced corneal injury, illustrating the relationship between Descemet membrane (DM) breaks and corneal astigmatism. Column 1 (A, E, I) consists of slit-lamp photographs demonstrating linear DM breaks highlighted by white arrowheads. These breaks exhibit varying orientations: oblique in Case 1, horizontal in Case 2, and vertical in Case 3. Columns 2 and 3 (B, C, F, G, J, K) show corneal topography elevation maps for both anterior and posterior surfaces. These maps reveal localized blue-coded regions indicating posterior corneal shifts that align precisely with the location and orientation of the DM breaks seen in the slit-lamp images. Column 4 (D, H, L) presents axial keratometric power maps showing significant corneal astigmatism. The steep and flat axes of astigmatism correlate with the physical orientation of the DM ruptures, highlighting how birth trauma-related DM breaks lead to permanent high-degree irregular astigmatism and potentially amblyopia. The data underscores the role of posterior corneal surface changes in driving total corneal aberrations in these patients.
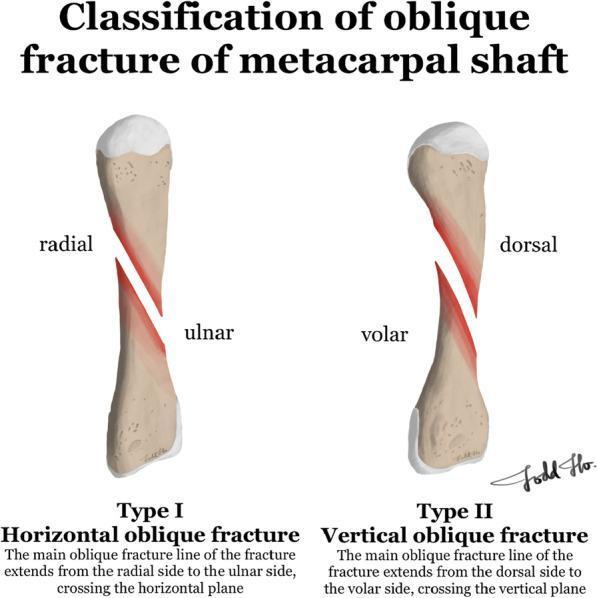
This medical illustration presents a classification system for oblique metacarpal shaft fractures, categorized into two types based on the orientation of the fracture line relative to anatomical planes. Type I, labeled as a 'Horizontal oblique fracture,' depicts the fracture line extending diagonally from the radial side to the ulnar side, effectively crossing the horizontal (coronal) plane of the metacarpal shaft. Type II, labeled as a 'Vertical oblique fracture,' illustrates the fracture line extending from the dorsal side to the volar side, crossing the vertical (sagittal) plane of the bone. The diagram uses labeled anatomical markers ('radial', 'ulnar', 'dorsal', 'volar') to orient the viewer and highlights the fracture surfaces in red to emphasize the morphology of the break. This comparison chart is an educational tool for orthopedic surgery and hand trauma, demonstrating how fracture orientation influences anatomical disruption and potentially dictates surgical fixation strategies, such as the placement of lag screws or dorsal plates.
This diagnostic image consists of a series of coronal and sagittal CT scans illustrating four distinct intervertebral space (IVS) morphologies and their radiological outcomes following Oblique Lateral Lumbar Interbody Fusion (OLIF). The images are categorized into four types: (a) Shallow-Shallow, (b) Shallow-Flat, (c) Deep-Shallow, and (d) Deep-Flat, based on endplate concavity depth (ECD) of the L4 inferior and L5 superior endplates. Each category displays three time points: pre-operative, immediate post-operative, and 12 months post-operative. Key metrics shown include disc height (DH), ECD measurements (d1, d2), and Bridwell fusion grades (FG). The Shallow-Shallow type demonstrates optimal outcomes with FG: I and stable DH. In contrast, the Deep-Flat type shows significant DH loss and poor fusion (FG: IV), indicating cage subsidence. The comparison highlights the clinical significance of endplate morphology in predicting subsidence and successful arthrodesis. Visible instrumentation includes interbody cages and pedicle screws. This educational material is suitable for orthopedic and neurosurgical curriculum focusing on spinal biomechanics and fusion outcomes.
Astigmatism
1. Definition
2. Normal Optics vs Astigmatism
- The steeper meridian (shorter radius of curvature) has greater dioptric power and forms a focal line closer to the lens
- The flatter meridian has lesser power and forms a focal line further back
- Between the two focal lines lies an oval cross-section called the circle of least confusion (the point of best compromised vision)
3. Causes
A. Corneal Astigmatism (Most Common - 95%)
| Type | Cause |
|---|---|
| Physiological/Congenital | Normal anatomical variation; mild astigmatism is present in most people |
| Corneal scarring | Post-infection (trachoma, HSV keratitis), post-trauma |
| Pterygium/limbal masses | Distortion of corneal curvature by adjacent tissue |
| Keratoconus | Progressive thinning and conical ectasia of cornea → irregular astigmatism |
| Post-surgical | After cataract surgery, corneal graft (penetrating keratoplasty) |
| Lid pathology | Chalazion, ptosis (mechanical pressure on cornea) |
B. Lenticular Astigmatism
- Irregular curvature or tilt of the crystalline lens
- Early nuclear cataract can induce lenticular astigmatism
C. Retinal (rare)
- Oblique placement of the macula
"Regular astigmatism is not a pathologic state but rather a variation in anatomy; most people have some degree of regular astigmatism." - Goldman-Cecil Medicine
4. Classification
Based on Regularity
| Type | Description | Correction |
|---|---|---|
| Regular astigmatism | Two principal meridians are at exactly 90° to each other; each meridian is uniform in curvature | Spectacles or contact lenses (cylindrical lenses) |
| Irregular astigmatism | Principal meridians are NOT at 90°, OR curvature within a single meridian is variable | Rigid gas-permeable (RGP) contact lenses; cannot be fully corrected with spectacles |
Based on Axis (For Regular Astigmatism)
| Type | Steep meridian location | Common in |
|---|---|---|
| With-the-rule (WTR) | Vertical meridian is steepest (axis of correcting minus cylinder = 180° ± 30°) | Children and young adults |
| Against-the-rule (ATR) | Horizontal meridian is steepest (axis of correcting minus cylinder = 90° ± 30°) | Elderly patients |
| Oblique | Steep meridian is between 30-60° or 120-150° | Less common |
With age, there is a natural shift from WTR to ATR astigmatism as the corneal shape changes.
Based on Refraction in Each Meridian
| Type | Principal meridians | Description |
|---|---|---|
| Simple myopic astigmatism | One meridian emmetropic, one myopic | One focal line on retina, one in front |
| Simple hypermetropic astigmatism | One meridian emmetropic, one hypermetropic | One focal line on retina, one behind |
| Compound myopic astigmatism | Both meridians myopic (different degrees) | Both focal lines in front of retina |
| Compound hypermetropic astigmatism | Both meridians hypermetropic (different degrees) | Both focal lines behind retina |
| Mixed astigmatism | One meridian myopic, other hypermetropic | One focal line in front, one behind (straddles retina) |
5. Symptoms
- Blurred vision at all distances (unlike pure myopia which is mainly distance, or pure hyperopia which is mainly near)
- "Shadowing" or "ghost images" - slightly displaced second image of objects
- Distortion - circles appear oval, straight lines appear tilted
- Asthenopia (eye strain, headache) - especially with uncorrected mild astigmatism as the eye constantly tries to compensate
- Squinting to improve focus through a stenopaeic (pin-hole) effect
- Tilting of the head in oblique astigmatism (particularly in children)
- In children: may cause amblyopia (lazy eye) if left uncorrected
6. Diagnosis
Subjective Methods
- Astigmatic fan/clock dial test - patient identifies which lines appear sharpest; steepest meridian = sharpest lines
- Refraction - determination of sphere, cylinder, and axis using trial frames or phoropter
- Cross-cylinder technique - refinement of axis and power of cylindrical correction
Objective Methods
| Method | What it measures |
|---|---|
| Retinoscopy (skiascopy) | Observed reflex in different meridians; "scissors reflex" in irregular astigmatism |
| Keratometry (K-readings) | Measures curvature of central 3 mm of cornea in two principal meridians; gives corneal astigmatism in diopters and axis |
| Corneal topography | Colour-coded map of entire corneal curvature; identifies irregular astigmatism and keratoconus |
| Auto-refractometer | Automated objective estimation of sphere, cylinder, axis |
| Videokeratography | High-resolution Placido disc based corneal mapping |
Prescription Notation
- -2.00 DS / -1.50 DC × 90
- DS = dioptric sphere | DC = dioptric cylinder | × 90 = axis in degrees
7. Correction
Optical Correction
| Method | Details |
|---|---|
| Spectacles with cylindrical lenses | Cylindrical lens has power in one meridian only; corrects regular astigmatism; first-line treatment |
| Toric soft contact lenses | Have different powers in two meridians with orientation markers to prevent rotation |
| Rigid gas-permeable (RGP) contact lenses | Vault over the cornea; tear film fills the irregular surface → corrects both regular and irregular astigmatism |
Surgical Correction
| Procedure | Details |
|---|---|
| LASIK | Can correct up to 5 D of astigmatism by ablating corneal tissue in an elliptical pattern |
| PRK / LASEK | Can correct up to 3 D |
| Limbal relaxing incisions (LRI) / Arcuate keratotomy | Paired arcuate incisions on the steep meridian → flattens it; used especially for residual astigmatism after cataract surgery |
| Toric intraocular lens (IOL) | Implanted during cataract surgery; incorporates cylindrical correction; risk of post-op rotation |
| Penetrating keratoplasty | For severe corneal astigmatism (e.g. keratoconus with scarring) |
8. Special Conditions Associated with Astigmatism
| Condition | Type of Astigmatism |
|---|---|
| Keratoconus | Progressive irregular astigmatism; managed with RGP lenses, collagen cross-linking, corneal graft |
| Corneal graft (post-keratoplasty) | High irregular astigmatism; treated with compression sutures, arcuate keratotomy, or RGP |
| Pterygium | Irregular astigmatism in the horizontal meridian; corrected by surgical excision |
| Chalazion | Temporary regular astigmatism (pressure on cornea); resolves after treatment |
| Forceps delivery (birth trauma) | Descemet's membrane breaks → high astigmatism → risk of amblyopia in infants |
9. Astigmatism in Children - Important Points
- Significant astigmatism (>1.50 D) in children can cause meridional amblyopia (selective suppression of the blurred meridian)
- Must be detected and corrected before age 8 (critical period of visual development) to prevent permanent amblyopia
- Cycloplegic refraction (using atropine or cyclopentolate) is essential for accurate measurement in children
10. Summary
| Feature | Detail |
|---|---|
| Definition | Different curvatures in different corneal/lens meridians - no single focal point |
| Primary cause | Corneal (95%); occasionally lenticular |
| Optical consequence | Two focal lines (Sturm's conoid) instead of one |
| Symptoms | Blurred/distorted vision at all distances + asthenopia |
| Most common type | Regular WTR astigmatism (young); ATR (elderly) |
| Corrected by | Cylindrical spectacle lens, toric contact lens, LASIK |
| Irregular astigmatism | RGP contact lenses required; cannot be corrected by spectacles |
| Key complication in children | Meridional amblyopia if uncorrected |
Middle ear function
middle ear anatomy ossicles tympanic membrane function diagram
This figure presents a comparative overview of human middle ear anatomy through diagnostic imaging and biomechanical modeling. Image (a) is a clinical axial CT scan of the head at the level of the temporal bone, highlighting the cranium, nasal cavity, and middle ear structures. Specific labels identify the malleus and stapes within the tympanic cavity. Image (b) shows a high-fidelity finite element model of the human middle ear, providing a detailed anatomical diagram of the ossicular chain, ligaments, and tympanic membrane. The model uses color-coding to differentiate structures: the tympanic membrane is shown with its pars tensa (PT) and pars flaccida (PF), bordered by the tympanic annulus (TA). The ossicles are segmented into the malleus head (pink), incus body (green), and stapes (light blue). Key supporting structures are annotated, including the superior, lateral, and anterior mallear ligaments (SML, LML, AML), the superior and posterior incudal ligaments (SIL, PIL), the tensor tympani (TT), and the stapedial annular ligament (SAL). A magnified inset details the incudostapedial (I-S) joint and stapedial tendon (ST).
This clinical photograph shows a close-up, internal view of the human middle ear cavity from a cadaveric specimen, illustrating the anatomical components of the ossicular chain and an experimental medical device. Visible anatomical structures include the incus, the stapes, and the umbo—the conical point on the internal surface of the tympanic membrane where the manubrium of the malleus attaches. The soft tissues and ossicles appear pinkish-white with a moist texture. A dark, metallic, triangular sensor tip (part of the 'UmboMic' piezoelectric apparatus) is positioned in direct contact with the umbo. This setup is used to detect the mechanical vibrations and displacement of the tympanic membrane for research into middle ear microphone technology. The image highlights the spatial relationship between the ossicles and the positioning requirements for intra-tympanic sensing devices. The educational focus is on otologic anatomy and the integration of implantable hearing technology within the middle ear space.
Reflected light microscopic images of the human middle ear auditory ossicles, displaying the anatomy and microvasculature of the malleus (M), incus (I), and stapes (S). The images highlight the structural relationships within the tympanic cavity, including the tympanic membrane (TM) and tympanic wall (TW). Colored arrows identify key arterial branches: the blue and red arrows mark the anterior tympanic artery pathways through the superior malleolar ligament and anterior malleolar plication, while the green arrow indicates the posterior tympanic artery crossing the incudostapedial joint. High-magnification views (c and d) utilize arrowheads to demonstrate the intricate intraosseous blood vessel system penetrating the ossicles via nutrient foramina. These sections differentiate between vascularized bone and avascular cartilage regions (indicated by asterisks). This educational visual illustrates middle ear micro-anatomy and the primary blood supply sources—the anterior and posterior tympanic arteries—essential for understanding ossicular physiology and surgical pathology in otolaryngology.
An anatomical diagram and medical device schematic illustrating a fiber-optic vibrometer system for a middle ear implant (MEI). The background shows a cross-section of the human ear, including the external auditory canal, tympanic membrane (eardrum), ossicular chain, and the cochlea in the inner ear. Superimposed on this anatomy is the implantable microphone system. Key components labeled in German include: 1) 'Batterie' (Battery) and 'Optoelektronischer Schaltkreis' (Optoelectronic circuit) positioned externally behind the pinna; 2) 'Fiberoptische Leitung' (Fiber optic line) which transmits signals transcutaneously; 3) 'Mechanischer Halter' (Mechanical holder) providing structural stability within the middle ear cavity; 4) 'Vibrationsrezeptor' (Vibration receptor) placed in contact with the ossicles to sense acoustic vibrations; and 5) 'Aktuator' (Actuator) positioned near the cochlear interface. This system functions as a contactless implantable microphone using laser interferometry or phase shift detection to drive a floating mass transducer, aiding patients with sensorineural or mixed hearing loss.
middle ear impedance matching transformer ossicular chain mechanical advantage sound transmission
This medical illustration depicts the components and anatomical placement of the Vibrant Soundbridge (VSB), a partially implantable active middle ear implant system. The image is divided into two panels. The left panel shows a cross-sectional anatomical diagram of the middle and inner ear. It illustrates the internal Vibrant Ossicular Prosthesis (VORP) with its Floating Mass Transducer (FMT) attached to the long process of the incus. The FMT is positioned to deliver mechanical vibrations to the ossicular chain (malleus, incus, and stapes), which then transmits sound to the cochlea. The right panel displays the hardware components: the external, circular audio processor—which contains the microphone and battery—and the internal receiver unit featuring a metallic coil and a connector lead. This system is designed for patients with conductive, sensorineural, or mixed hearing loss by bypassing damaged outer or middle ear structures through direct electromechanical stimulation of the ossicles.
This composite of three intraoperative endoscopic images (A, B, and C) illustrates a type II ossiculoplasty using a titanium Partial Ossicular Replacement Prosthesis (PORP). The images capture the surgical field within the middle ear cavity during the reconstruction of the ossicular chain. Image A provides a clear view of the metallic PORP, showing its characteristic circular or slightly oval head with central fenestrations designed for visibility and sound transmission stability. The prosthesis is positioned to bridge the gap between the stapes head and the tympanic membrane or malleus. Image B demonstrates the prosthesis in a deeper field, surrounded by erythematous mucosal tissue and surgical debris, highlighting the interaction between the metallic implant and the middle ear environment. Image C shows the fine dissection and tissue manipulation using a micro-surgical instrument, likely preparing the graft bed or ensuring the stability of the reconstruction. These images serve as an educational resource for otolaryngology residents to understand the endoscopic view, anatomical landmarks, and technical placement of titanium middle ear implants.
This composite figure illustrates the design and clinical application of a patient-specific 3D-printed middle ear prosthesis. (a) A digital Standard Tessellation Language (STL) model showcasing a circular support ring connected via three spokes to a central component, designed to replicate the function of a human incus. (b) A physical 3D-printed model of the prosthesis fabricated using vat photopolymerization (VP) technology, displaying the textured surface typical of high-resolution resin printing. (c) An intraoperative clinical photograph demonstrating the prosthesis in situ within a left middle ear. The image highlights the mechanical coupling between the manubrium of the malleus and the stapes capitulum, bridging the ossicular chain gap to facilitate sound transmission. Labeled anatomical landmarks include the tympanic membrane and the stapes capitulum. This demonstrates the use of computer-aided design (CAD) and medical 3D printing for otologic reconstruction and patient-specific surgical planning in the treatment of conductive hearing loss.
Middle Ear - Function
1. Overview
"To transmit vibrations of the tympanic membrane across the cavity of the middle ear to the internal ear." - Gray's Anatomy for Students
2. The Problem: Impedance Mismatch
- Air has low acoustic impedance (low density, high compressibility)
- Cochlear fluid (perilymph) has high acoustic impedance (high density, low compressibility)
3. Mechanism of Sound Transmission - The Ossicular Chain
The Three Ossicles (Smallest bones in the body):
| Bone | Connection | Weight |
|---|---|---|
| Malleus (hammer) | Handle embedded in tympanic membrane; head articulates with incus (incudomalleolar joint) | ~23 mg |
| Incus (anvil) | Between malleus and stapes; long process articulates with stapes head (incudostapedial joint) | ~27 mg |
| Stapes (stirrup) | Footplate sits in the oval window, held by the annular ligament | ~3 mg (smallest bone in body) |
The stapes is approximately one-quarter the mass of the malleus or incus - this mass difference facilitates high-frequency transmission.
The tympanic membrane and ossicular chain most efficiently transmit sound between 500 and 3000 Hz - the frequency range most important for understanding speech.
4. Four Mechanisms of Impedance Matching
(a) Area Effect of the Tympanic Membrane (Most important)
| Measurement | Value |
|---|---|
| Total area of adult tympanic membrane | 85-90 mm² |
| Effective vibrating area (lower two-thirds) | ~55 mm² |
| Stapes footplate area | ~3.2 mm² |
(b) Lever Action of the Ossicular Chain
- Handle of the malleus ≈ 1.3 times longer than the long process of the incus
- This lever ratio amplifies force by 1.3:1 at the stapes footplate
(c) Combined Transformer Ratio
Total transformer ratio = Area effect × Lever ratio
= 17 × 1.3
= ~22:1
≈ 25 dB gain
(d) Phase Difference Between Oval Window and Round Window
- When the stapes footplate pushes inward at the oval window, the round window membrane bulges outward
- This out-of-phase movement allows fluid displacement within the cochlea
- This phase difference contributes an additional ~4 dB of functional gain
- If both windows moved in phase simultaneously, the fluid would not be displaced and no hearing would occur
5. Resonance and Frequency Tuning
- The natural resonance properties of the outer ear canal and middle ear structures enhance transmission for frequencies between 500 and 3000 Hz
- This corresponds precisely to the speech frequency range - an evolutionary adaptation for communication
- Low-frequency sounds (<500 Hz) and high-frequency sounds (>3000 Hz) are transmitted with progressively less efficiency
6. Middle Ear Muscles - Acoustic Reflex (Protective Function)
Tensor Tympani
| Feature | Detail |
|---|---|
| Origin | Cartilaginous wall of Eustachian tube + greater wing of sphenoid |
| Insertion | Handle of malleus |
| Nerve | Medial pterygoid nerve (branch of mandibular V3) |
| Action | Pulls malleus medially → tenses tympanic membrane → stiffens ossicular chain |
| Function | Protects inner ear from very loud low-frequency sounds; response to touch, not mainly sound |
Stapedius
| Feature | Detail |
|---|---|
| Origin | Pyramidal eminence on posterior wall |
| Insertion | Neck of stapes |
| Nerve | Branch of facial nerve (VII) |
| Action | Pulls stapes posteriorly → stiffens ossicular chain |
| Function | Acoustic (stapedius) reflex - activated bilaterally by loud sounds |
The Acoustic Reflex:
- Triggered by sounds >70-80 dB SPL
- Both stapedius muscles contract (bilaterally) within ~25-150 ms
- Result: stiffening of ossicular chain → attenuates low-frequency sound transmission → protects cochlea from damage
- Latency is too long to protect from sudden loud impulse noises (gunshots, explosions)
- Clinical use: Acoustic reflex testing is a key component of audiological assessment (tests integrity of CN VII, CN VIII, and brainstem pathways)
7. The Eustachian (Pharyngotympanic) Tube - Pressure Equalisation
Anatomy
- Connects middle ear to nasopharynx (opens just posterior to inferior meatus)
- 1/3 bony (from middle ear) + 2/3 fibrocartilaginous (towards nasopharynx)
- Normally closed at rest (fibrous membrane closes the lumen)
- Angled ~45° from middle ear to nasopharyngeal opening
- In adults: ~35-36 mm long; in children: shorter, more horizontal (predisposing to otitis media)
Function
- Pressure equalisation - opens during swallowing, yawning, sneezing to equalise air pressure on both sides of the tympanic membrane
- Ventilation of middle ear cleft
- Drainage of middle ear secretions toward nasopharynx (mucociliary clearance)
- Protection from nasopharyngeal sound pressure fluctuations and secretions
Opening mechanism
"The ET is the conduit through which air is exchanged between the middle ear space and upper aerodigestive tract." - Cummings Otolaryngology
8. Mastoid Air Cells
- The middle ear communicates posteriorly with the mastoid antrum via the aditus ad antrum
- The mastoid contains interconnected air cells lined by mucous membrane continuous with the middle ear
- Functions:
- Act as a pneumatic cushion - buffer against pressure changes
- Provide a lightweight temporal bone while maintaining structural strength
- Increase resonance of sound transmission
9. From Middle Ear to Inner Ear - Completion of the Chain
- Fluid waves (hydraulic energy) are created in the perilymph of the scala vestibuli
- These travel as a Bekesy travelling wave along the basilar membrane
- The wave causes shearing between the basilar membrane and tectorial membrane
- This bends the stereocilia of cochlear hair cells
- Mechanotransduction → depolarisation → afferent nerve impulse in CN VIII
- The round window membrane bulges outward to accommodate the fluid displacement
10. Summary of Middle Ear Functions
| Function | Structure Responsible |
|---|---|
| Sound collection and vibration initiation | Tympanic membrane |
| Impedance matching (air to fluid) | Ossicular chain (area ratio + lever ratio) |
| Pressure amplification (~25 dB) | Area effect (17:1) + ossicular lever (1.3:1) |
| Phase differential at cochlea | Oval window + round window |
| Protection from loud sounds | Acoustic reflex (stapedius + tensor tympani) |
| Pressure equalisation | Eustachian (pharyngotympanic) tube |
| Drainage of secretions | Eustachian tube (mucociliary clearance) |
| Resonance buffer | Mastoid air cells |
| Neural conduction of sound | Completed by inner ear (cochlea + CN VIII) |
Spinal cord near anatomy
spinal cord cross section anatomy tracts white grey matter
This composite diagnostic image features an axial cross-sectional graphic of the cervical spinal cord anatomy superimposed on a radiological background. The illustration uses color-coded regions to delineate primary white matter tracts: the dorsal column-medial lemniscus system is shown in blue (posteriorly), the lateral corticospinal tracts in red (laterally), the anterior corticospinal tracts in yellow (medial-anteriorly), and the anterolateral system (spinothalamic tract) in green (anterolaterally). A white outline represents the central grey matter of the spinal cord. White asterisks are strategically placed on the left hemicord tracts (blue, red, yellow, and green regions) to indicate the site of anatomical damage associated with a left-sided spinal cord lesion. This visual aid is designed to explain the pathophysiology of Brown-Séquard syndrome, illustrating how a hemicord injury affects specific ascending and descending pathways, leading to ipsilateral motor/proprioceptive loss and contralateral pain/temperature loss.
Anatomical diagrams illustrating the organization of major white matter tracts in the human spinal cord across cervical, thoracic, and lumbar cross-sections. A primary large-scale diagram provides detailed labeling of pathways, while three comparative smaller diagrams show regional variations. Descending (motor) pathways are color-coded in orange (corticospinal tracts from the cerebral cortex) and grey/black (brainstem-derived tracts including rubrospinal, reticulospinal, and tectospinal tracts). Ascending (sensory) pathways are highlighted in blue for dorsal columns (fasciculus gracilis and cuneatus), green for dorsal and ventral spinocerebellar tracts, and pink for the spinothalamic and spinoreticular tracts. The diagrams illustrate key neuroanatomical landmarks such as the central canal (CC), dorsal horns, and ventral horns. Educational focus is placed on the somatotopic arrangement and the relative change in white matter volume versus grey matter across different spinal levels, highlighting the clinical relevance for localized spinal cord injury and neurological deficit mapping.
This medical visual consists of two parts: an anatomical diagram and a series of diagnostic images demonstrating spinal cord segmentation. Panel (a) is a schematic cross-section of the cervical spinal cord illustrating the segmentation protocol. Red regions of interest (ROIs) define the White Matter (WM) masks, located in the dorsal (D), ventral (V), and bilateral lateral (L, R) funiculi. Blue ROIs define the Grey Matter (GM) masks, positioned within the characteristic central 'butterfly' structure. Panel (b) presents Fractional Anisotropy (FA) maps derived from Diffusion Tensor Imaging (DTI) for nine human subjects (S1–S9). Each grayscale axial map is overlaid with the manually defined GM (blue) and WM (red) masks. The images demonstrate the variability in spinal cord morphology and pixel intensity across different individuals. The educational focus is on the localization of specific neural tracts and the application of quantitative MRI metrics to differentiate between spinal cord substructures. This material is relevant for neuroimaging research and the clinical assessment of pathologies like multiple sclerosis or spinal cord injury.
This Comparison Chart illustrates the results of region-wise automated clustering of spinal cord white matter across different levels and parcellation densities. The image is organized into a 4x3 matrix: the vertical axis represents anatomical regions (cervical, thoracic, lumbar, and sacral), while the horizontal axis indicates the number of clusters (n=8, 10, and 20). Each spinal cord cross-section is split into two halves: the left hemi-section shows data-driven clustering results color-coded to represent distinct white matter tracts based on morphometric signatures (e.g., axon density, diameter, and myelin thickness), while the right hemi-section shows the corresponding Watson atlas for reference. Notable features include the consistent delineation of the cuneate fasciculus (red) and dorsal corticospinal tract (cyan) across multiple levels. The cervical and lumbar sections show a larger cross-sectional area and more complex clustering patterns than the thoracic and sacral regions. Increasing the cluster count from 8 to 20 provides finer parcellation and reveals smaller tracts, though some regions (like the sacral level) appear noisier. This visual demonstrates the application of quantitative MRI/histology-based algorithms for neuroanatomical mapping and tractography.
spinal cord meninges dura mater arachnoid pia subarachnoid space
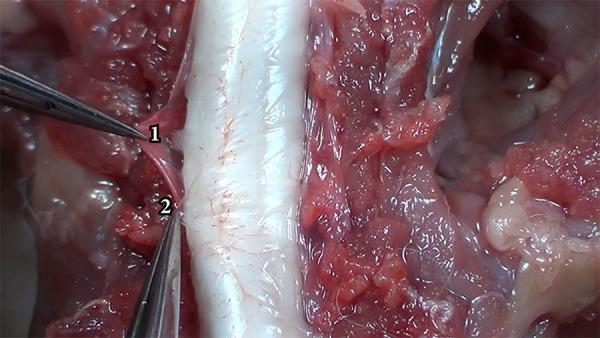
This clinical photograph captures a microsurgical dissection of the spinal meninges, demonstrating the anatomical differentiation between the dura mater and the arachnoid mater. In the center of the frame, the spinal cord appears as a prominent, whitish, cylindrical structure with visible fine vascularization on its surface. Surgical forceps are used to retract and distinguish two distinct layers: the dura mater (labeled '1') and the arachnoid mater (labeled '2'). The dura mater (1) is visualized as a thicker, more opaque, and slightly reddish fibrous membrane, reflecting its dense collagenous composition and relative resistance to manipulation. In contrast, the arachnoid mater (2) is depicted as a thinner, more translucent, and whiter membrane underlying the dura. The surrounding surgical field contains exposed paraspinal muscles and subcutaneous tissues, appearing reddish and fleshy with a glistening texture due to the presence of biological fluids. This image serves as an educational reference for neurosurgical anatomy, specifically the layered structure of the spinal meninges and the plane of dissection required to access the subarachnoid space.
This medical anatomical diagram illustrates the three-dimensional structure of the cranial meninges and the pia-arachnoid complex (PAC). The cross-sectional drawing is labeled with five distinct layers: (a) the thick, outermost dura mater; (b) the thinner arachnoid mater; (c) the subarachnoid space (SAS); (d) the pia mater; and (e) the underlying brain tissue. A primary focus is the subarachnoid space, which contains a network of fibrous arachnoid trabeculae and a large, cylindrical blood vessel. The trabeculae are shown as thin, branching collagenous strands that bridge the space between the arachnoid and pia mater, providing mechanical stability. The diagram highlights the spatial relationship between the leptomeninges (arachnoid and pia) and the underlying neural parenchyma, with a scale bar indicating a 100 µm reference. This illustration is intended for educational use in neuroanatomy and pathophysiology to demonstrate the mechanical protection of the brain and the distribution of cerebrospinal fluid pathways.
Spinal Cord - Near Anatomy (Gross and Internal Anatomy)
1. General Description
| Feature | Detail |
|---|---|
| Upper limit | Foramen magnum (continuous with medulla oblongata) |
| Lower limit (adults) | Conus medullaris at L1-L2 vertebral level |
| Lower limit (neonates) | L3 vertebral level (ascends relatively as child grows) |
| Length | ~45 cm in adults |
| Weight | ~35 g |
2. External Features
Enlargements
- Cervical enlargement (C4-T1): gives rise to the brachial plexus (upper limb)
- Lumbosacral enlargement (L2-S3): gives rise to the lumbosacral plexus (lower limb)
Conus Medullaris and Filum Terminale
- The cord tapers inferiorly into the conus medullaris
- From the tip of the conus, a thin fibrous cord called the filum terminale descends to attach to the dorsum of the first coccygeal segment - it anchors the spinal cord
- The filum terminale is composed of pia mater
Cauda Equina
- Spinal nerve roots from lumbar and sacral segments descend below the conus medullaris as a collection of nerve roots called the cauda equina ("horse's tail")
- This collection floats in the CSF within the lumbar cistern (subarachnoid space)
- Clinically important: lumbar puncture (L3-L4 or L4-L5) safely enters this space without damaging the cord
Longitudinal Fissures and Sulci
- Anterior median fissure: deep midline groove anteriorly
- Posterior median sulcus: shallow midline groove posteriorly
- Posterolateral sulci: where dorsal nerve roots enter
- Anterolateral sulci: where ventral nerve roots exit
3. Meninges - Coverings of the Spinal Cord
| Meninx | Description | Clinical Relevance |
|---|---|---|
| Dura mater | Outermost; tough, fibrous; forms a tube from foramen magnum to S2; separated from vertebral canal wall by the epidural space (fat, venous plexus) | Epidural anaesthesia; epidural haematoma |
| Arachnoid mater | Middle; thin, delicate, weblike; separated from dura by subdural space (potential space) | Subdural hygroma |
| Pia mater | Innermost; closely adherent to spinal cord surface; vascular | Forms filum terminale, denticulate ligaments |
Spaces
- Epidural (extradural) space: between dura and vertebral canal wall; contains fat and internal vertebral venous plexus → site of epidural anaesthesia
- Subdural space: between dura and arachnoid; potential space
- Subarachnoid space: between arachnoid and pia; filled with cerebrospinal fluid (CSF); contains blood vessels, nerve roots, and the cauda equina
Denticulate Ligaments
- Lateral extensions of pia mater
- 21 pairs; attach from pia to dura mater between dorsal and ventral nerve roots
- Anchor and suspend the spinal cord laterally within the dural tube
4. Internal Structure - Cross Section
A. Grey Matter
- Two dorsal (posterior) horns - mainly sensory processing
- Two ventral (anterior) horns - motor neurons
- Intermediate zone connecting them
- Central canal (connected to the 4th ventricle) at the centre
Rexed's Laminae (10 laminae of grey matter)
| Lamina | Location | Nuclei/Function |
|---|---|---|
| I | Dorsal horn tip | Nucleus posteromarginalis (marginal zone); pain input |
| II | Dorsal horn | Substantia gelatinosa of Rolando; pain modulation |
| III-IV | Dorsal horn | Nucleus proprius; touch, pressure |
| V | Neck of dorsal horn | Receives nociceptive and non-nociceptive input |
| VI | Base of dorsal horn | Proprioception; only present at enlargements |
| VII | Intermediate zone | Clarke's nucleus (nucleus dorsalis) at T1-L2; spinocerebellar relay; also contains IML (sympathetic) |
| VIII | Ventral horn (medial) | Interneurons; propriospinal pathways |
| IX | Ventral horn | Alpha and gamma motor neurons (LMN) |
| X | Around central canal | Gray commissure |
Special Columns of Grey Matter:
- Intermediolateral (IML) column (T1-L2): preganglionic sympathetic neurons
- Sacral parasympathetic nucleus (S2-S4): preganglionic parasympathetic neurons
Motor Neurons in Ventral Horn:
- Alpha (α) motor neurons: large; innervate extrafusal muscle fibres (cause muscle contraction)
- Gamma (γ) motor neurons: small; innervate intrafusal fibres of neuromuscular spindles (regulate stretch reflex sensitivity)
B. White Matter
| Funiculus | Location | Main Tracts |
|---|---|---|
| Dorsal (posterior) funiculus | Between dorsomedian and dorsolateral sulci | Fasciculus gracilis + Fasciculus cuneatus |
| Lateral funiculus | Between dorsolateral and anterolateral sulci | Lateral corticospinal tract; spinothalamic; spinocerebellar |
| Ventral (anterior) funiculus | Between anterolateral sulcus and anterior fissure | Ventral corticospinal tract; reticulospinal |
5. Major Tracts - Ascending (Sensory)
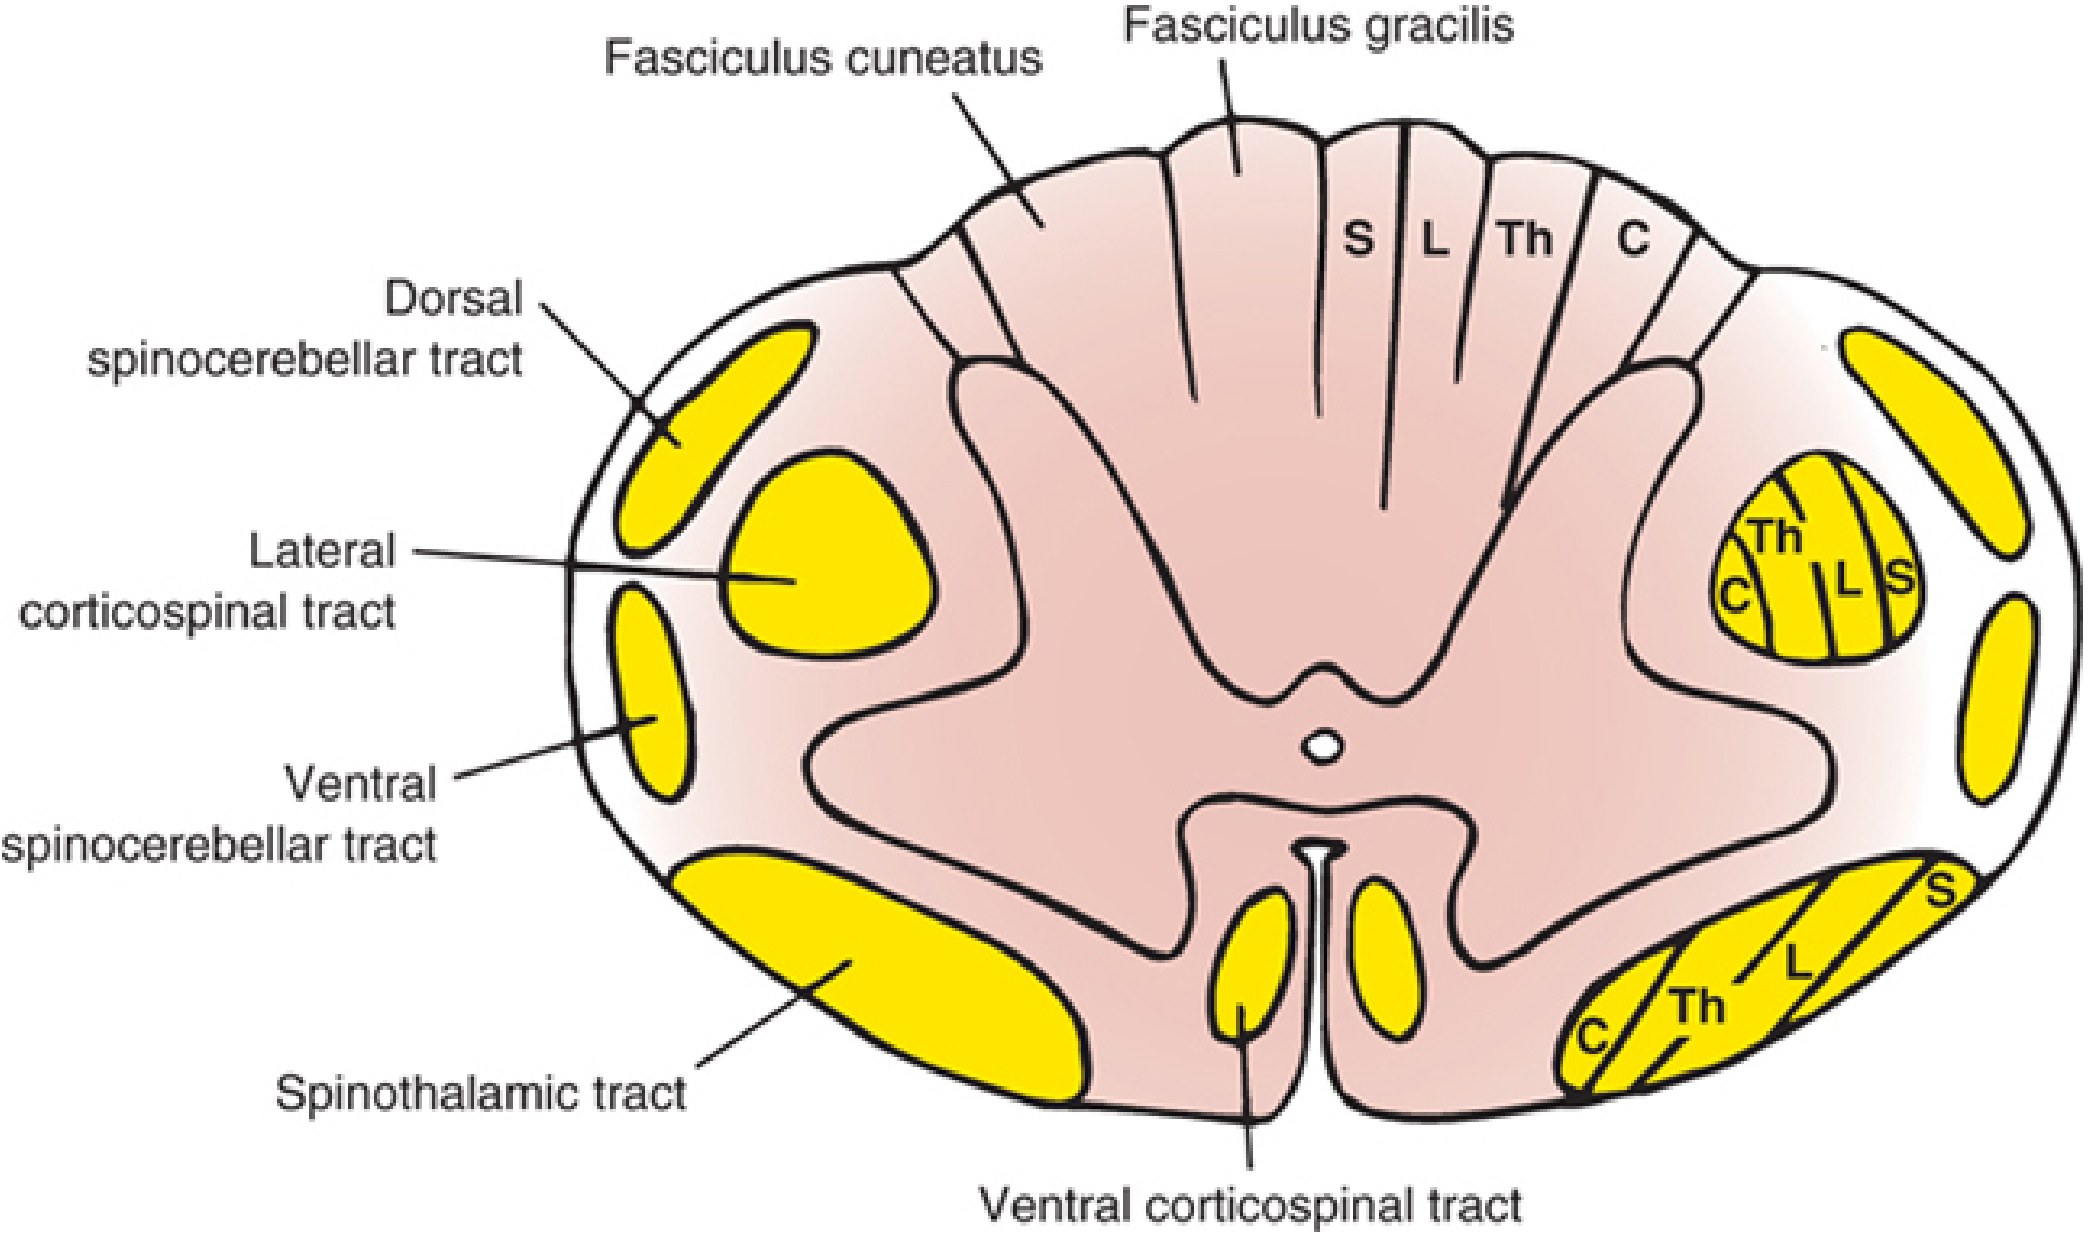
1. Dorsal Column - Medial Lemniscus Pathway
| Feature | Detail |
|---|---|
| Carries | Fine touch, vibration, conscious proprioception, 2-point discrimination |
| Fasciculus gracilis | Fibres from sacral, lumbar, lower 6 thoracic levels; medially placed |
| Fasciculus cuneatus | Fibres from upper 6 thoracic + all cervical levels; laterally placed (only in cervical cord) |
| Decussation | In medulla (nucleus gracilis → nucleus cuneatus → medial lemniscus) |
| Somatotopy | Sacral fibres medial, cervical fibres lateral |
2. Lateral Spinothalamic Tract
| Feature | Detail |
|---|---|
| Carries | Pain and temperature |
| Location | Lateral funiculus (anterolateral portion) |
| Decussation | Cross in ventral white commissure within 1-2 spinal segments of entry |
| Somatotopy | Cervical = dorsomedial; sacral = ventrolateral |
| 2nd order neuron relay | Dorsal horn (laminae I, II, V) → VPL nucleus of thalamus |
3. Ventral Spinothalamic Tract
| Feature | Detail |
|---|---|
| Carries | Crude (light) touch, pressure |
| Location | Ventral funiculus |
| Decussation | Ventral white commissure |
4. Spinocerebellar Tracts (Unconscious proprioception)
| Tract | Location | Route |
|---|---|---|
| Dorsal spinocerebellar | Lateral funiculus (posterior part) | Ipsilateral; via inferior cerebellar peduncle |
| Ventral spinocerebellar | Lateral funiculus (anterior part) | Crosses twice (net ipsilateral); via superior cerebellar peduncle |
6. Major Tracts - Descending (Motor)
1. Lateral Corticospinal Tract (Most important)
| Feature | Detail |
|---|---|
| Origin | Primary motor cortex (Brodmann area 4), premotor cortex (area 6), parietal lobe |
| Decussation | ~90% cross at pyramidal decussation in caudal medulla |
| Location | Lateral funiculus |
| Ends | Laminae IV-IX (ventral horn motor neurons) |
| Function | Voluntary fine skilled movements; especially distal limb muscles |
| Somatotopy | Cervical fibres most medial; sacral fibres most lateral |
2. Ventral (Anterior) Corticospinal Tract
| Feature | Detail |
|---|---|
| Represents | ~10% of corticospinal fibres that did NOT decussate at medulla |
| Location | Ventral funiculus (ipsilateral) |
| Crosses | At the segmental level via ventral white commissure |
| Ends | Cervical and upper thoracic lamina III; controls axial and proximal muscles |
3. Other Descending Tracts
| Tract | Origin | Function |
|---|---|---|
| Rubrospinal | Red nucleus (midbrain) | Facilitates limb flexors; works with lateral CST |
| Lateral reticulospinal | Medullary reticular formation | Inhibits antigravity muscles |
| Medial reticulospinal | Pontine reticular formation | Facilitates antigravity muscles (trunk, proximal limbs) |
| Vestibulospinal | Lateral vestibular nucleus | Facilitates extensor/antigravity muscles; balance |
| Tectospinal | Superior colliculus | Head-turning in response to visual stimuli |
7. Spinal Nerve Roots
- Dorsal (posterior) root: sensory; carries afferent signals from periphery to cord
- Has a dorsal root ganglion (DRG) containing cell bodies of primary sensory neurons; sensitive to pressure and heat
- Ventral (anterior) root: mainly motor; carries efferent signals from cord to periphery
Exit Levels:
| Level | Exit pattern |
|---|---|
| C1-C7 | Exit above their corresponding vertebra |
| C8 | Exits between C7 and T1 |
| T1 and below | Exit below their corresponding vertebra |
Because the cord is shorter than the vertebral column, roots course increasingly obliquely downward to reach their exit foramina - most dramatically in the cauda equina.
8. Blood Supply
Arterial Supply
| Artery | Supplies |
|---|---|
| Anterior spinal artery | Single; formed from two branches of vertebral arteries; runs in anterior median fissure; supplies anterior 2/3 of cord (anterior grey horns, corticospinal, spinothalamic tracts) |
| Posterior spinal arteries (×2) | Paired; from posterior inferior cerebellar arteries (PICA); supply posterior 1/3 (dorsal columns) |
| Radiculomedullary arteries | Reinforce the above from segmental aortic branches |
| Artery of Adamkiewicz | Large anterior radicular artery from T10-L1; supplies lower 2/3 of cord (critical!) |
Clinical: Anterior Spinal Artery Syndrome
Venous Drainage
- Anterior and posterior spinal veins → internal vertebral venous plexus (Batson's plexus) → external vertebral plexus → segmental veins
- Batson's plexus has no valves - allows retrograde spread of tumour cells (e.g., prostatic/breast metastases to vertebrae)
9. Somatotopic Lamination (Clinical Importance)
- Corticospinal tract: cervical fibres = most medial; sacral fibres = most lateral
- Spinothalamic tract: cervical = dorsomedial; sacral = ventrolateral
- Clinical significance: A central cord lesion (e.g. syringomyelia) affects cervical fibres first → cape-like loss of pain/temperature over shoulders and arms with legs spared; external compression affects sacral fibres first → sacral sparing is a sign of INCOMPLETE lesion
Summary Table
| Structure | Details |
|---|---|
| Extent | Foramen magnum → L1-L2 (conus) |
| Enlargements | Cervical (C4-T1) + Lumbosacral (L2-S3) |
| Meninges | Dura, arachnoid, pia; subarachnoid space contains CSF |
| Grey matter | Butterfly-shaped; Rexed laminae I-X; dorsal horn (sensory), ventral horn (motor) |
| White matter | 3 funiculi (dorsal, lateral, ventral); ascending + descending tracts |
| Key ascending tracts | Dorsal columns (fine touch/proprioception), lateral spinothalamic (pain/temperature) |
| Key descending tract | Lateral corticospinal (voluntary motor) |
| Arterial supply | Anterior spinal artery (ant 2/3) + posterior spinal arteries (post 1/3) + artery of Adamkiewicz |
| Nerve roots | Dorsal (sensory) + ventral (motor) at each level |