
Trimester wise complication of GDM maternal and fetal
gestational diabetes mellitus complications fetal maternal diagram
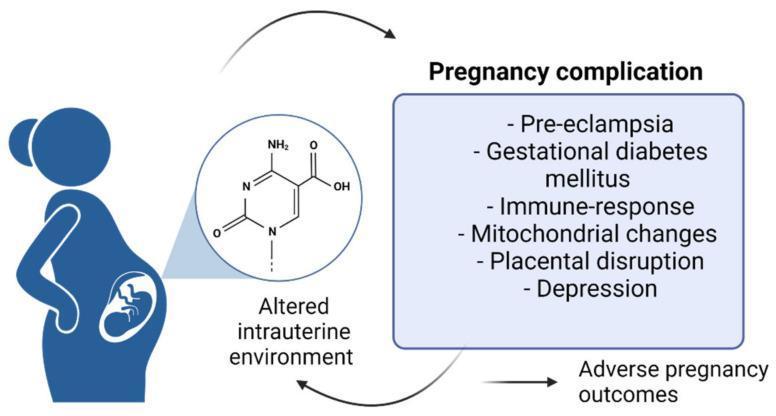
A pathophysiology diagram illustrating the relationship between molecular changes in gestation and clinical complications. On the left, a silhouette of a pregnant woman contains a circular inset magnification of the 'Altered intrauterine environment.' This inset displays a chemical structure (cytosine-like pyrimidine ring with nitrogen, oxygen, and hydrogen atoms), suggesting epigenetic or metabolic modifications at the molecular level. A bidirectional arrow system connects this environment to a primary box titled 'Pregnancy complication.' The list of complications includes pre-eclampsia, gestational diabetes mellitus, immune-response alterations, mitochondrial changes, placental disruption, and depression. A final arrow leads from these complications toward 'Adverse pregnancy outcomes,' which then feeds back into the intrauterine environment loop. The diagram serves as an educational summary of how maternal-fetal health is influenced by biochemical signaling pathways and physiological stressors, highlighting the cyclic nature of obstetric pathology.
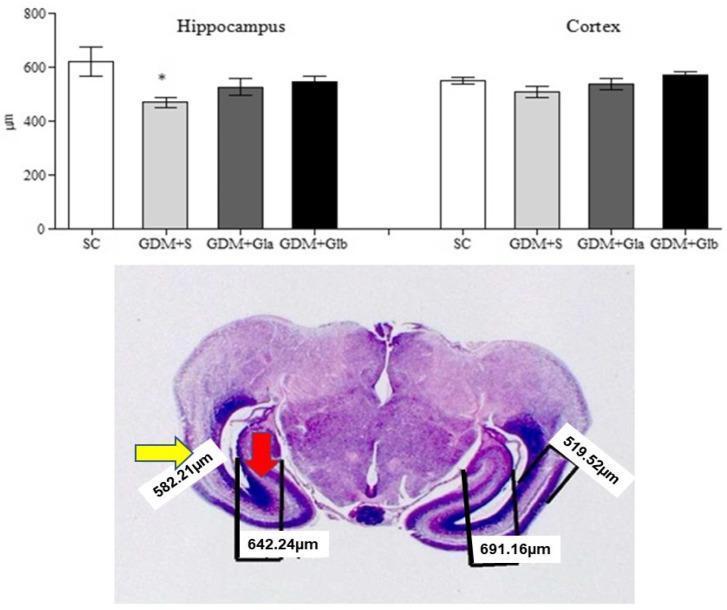
Educational composite image featuring a bar graph and a correlated histological section focused on fetal neuroanatomy and morphometric analysis in a Gestational Diabetes Mellitus (GDM) model. Top: A comparative bar graph displays tissue measurements in micrometers (µm) for two brain regions: the Hippocampus and the Cortex. Four experimental groups are compared: SC (Saline Control), GDM+S (Diabetic Saline), GDM+Gla, and GDM+Glb (Diabetic groups treated with Ganoderma lucidum). Data are shown as mean ± SD, with an asterisk highlighting a statistically significant decrease in hippocampal thickness in the GDM+S group compared to control. Bottom: A low-magnification (40X) photomicrograph of a fetal encephalon histological section stained with Hematoxylin and Eosin (H&E). The section shows the characteristic laminar organization of the developing brain. A yellow arrow identifies the cortex, while a red arrow points to the hippocampus. Superimposed linear measurement markers demonstrate how the morphometric data in the graph were obtained, with specific values indicated in micrometers. This material illustrates the impact of maternal diabetes on fetal brain development and the potential neuroprotective effects of Ganoderma lucidum.
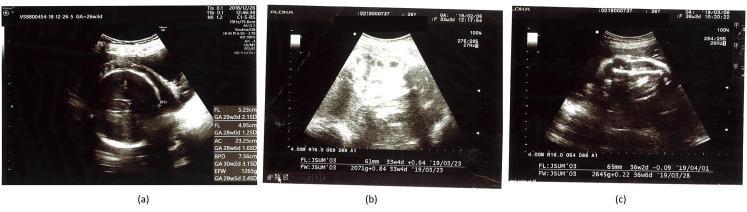
This composite diagnostic image consists of three panels (a, b, and c) showing obstetric ultrasound scans used for fetal biometry and growth monitoring in the context of Gestational Diabetes Mellitus (GDM). Panel (a) displays a transverse section of the fetal head and abdomen at 26 weeks gestation, with caliper measurements showing significantly accelerated growth. Visible biometry includes a biparietal diameter (BPD) of 7.66 cm (30w2d), femur length (FL) of 4.95 cm (28w0d), and abdominal circumference (AC) of 23.25 cm (28w6d), indicating macrosomia or large-for-gestational-age (LGA) status due to maternal hyperglycemia. Panels (b) and (c) track subsequent fetal development at 33w4d and 36w2d respectively, showing estimated fetal weights (EFW) of 2071g and 2645g. These longitudinal scans illustrate the impact of clinical interventions, such as dietary modifications and caloric restriction, on slowing excessive fetal weight gain to achieve a growth trajectory closer to the normal range. The clinical significance focuses on ultrasound's role in monitoring metabolic complications and the efficacy of glycemic control in pregnancy.
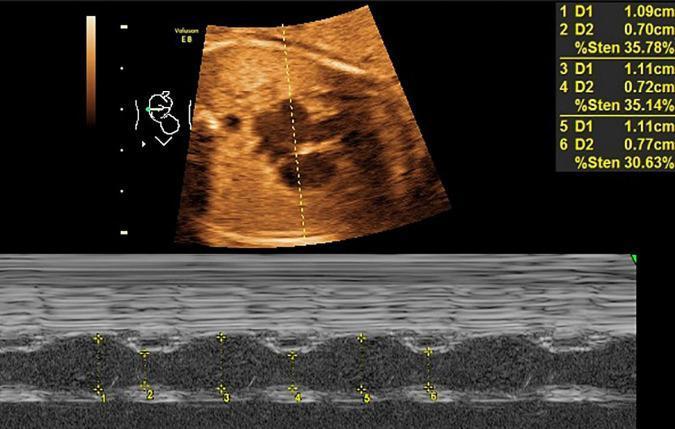
Diagnostic ultrasound image featuring a fetal echocardiogram in a 26-week gestational age fetus, used for assessing cardiac function in the context of gestational diabetes mellitus (GDM). The visual is divided into two primary sections: a top panel showing a B-mode (2D) cross-sectional view of the fetal heart and a bottom panel showing an M-mode tracing. In the B-mode image, a yellow vertical sampling line passes through the cardiac chambers to obtain the M-mode data. The M-mode tracing displays cyclical motion of the atrial walls over several cardiac cycles. Yellow callipers (marked 1-6) measure the maximum and minimum dimensions of the chamber, facilitating the calculation of the left atrial shortening fraction (LASF). Quantitative data on the right provides measurements for D1 (diastolic) and D2 (systolic) diameters and a calculated percentage value (labeled as %Sten, representing the shortening fraction). This clinical imaging study is used to evaluate for early signs of fetal myocardial dysfunction or septal hypertrophy associated with maternal GDM.
Trimester-wise Complications of Gestational Diabetes Mellitus (GDM)
FIRST TRIMESTER (Weeks 1-13)
Note: True GDM is rarely active in the first trimester since it is precipitated by placental insulin resistance that builds through mid-pregnancy. However, women with undiagnosed pre-existing T2DM (misclassified as GDM) or those with risk factors carry these risks.
Maternal Complications
| Complication | Mechanism |
|---|---|
| Spontaneous abortion / miscarriage | Poor glycemic control in early pregnancy is associated with increased risk; hyperglycemia impairs implantation and early placentation |
| Worsening of pre-existing retinopathy | Rapid improvement of glycemic control paradoxically worsens retinopathy in T1/T2DM |
| Hypoglycemia | Relative hypoglycemia from nausea/vomiting, especially if on insulin |
Fetal Complications
| Complication | Mechanism |
|---|---|
| Congenital malformations | Hyperglycemia during organogenesis (weeks 3-8) - the malformation rate is at least doubled, proportional to HbA1c at conception; affects cardiac, neural tube, skeletal systems |
| Spontaneous abortion | Embryotoxic effect of hyperglycemia and altered hormonal milieu |
| Neural tube defects | Hyperglycemia inhibits arachidonic acid and myo-inositol pathways needed for neural tube closure |
SECOND TRIMESTER (Weeks 14-27)
GDM is typically diagnosed at 24-28 weeks; placental diabetogenic hormones peak here.
Maternal Complications
| Complication | Mechanism |
|---|---|
| Gestational hypertension / Preeclampsia | Endothelial dysfunction, increased insulin resistance, vascular inflammation; GDM increases preeclampsia risk significantly |
| Polyhydramnios | Fetal polyuria from osmotic diuresis due to fetal hyperglycemia; typically appears in late second trimester |
| Increased insulin requirements | Insulin resistance progressively rises as the placenta grows and secretes more diabetogenic hormones (hPL, progesterone, cortisol, growth hormone) |
| Urinary tract infections | Glucosuria creates a favorable environment for bacterial growth |
| Worsening diabetic nephropathy (pregestational) | Hyperfiltration of pregnancy on already-compromised kidneys |
Fetal Complications
| Complication | Mechanism |
|---|---|
| Macrosomia / LGA (Large for Gestational Age) | Fetal hyperinsulinemia drives excess fat deposition; most common consequence of GDM - abdominal circumference enlargement is often the first ultrasound sign |
| Fetal growth restriction (FGR) | Occurs paradoxically in women with vascular disease causing uteroplacental insufficiency |
| Fetal cardiac hypertrophy / cardiomyopathy | Fetal hyperinsulinemia causes interventricular septal hypertrophy, detected on fetal echo |
| Fetal anomaly screening | Detailed anomaly scan is especially important given elevated malformation risk |
| Polyhydramnios onset | Begins to develop as fetal glycemia drives polyuria |
THIRD TRIMESTER (Weeks 28-40)
The most complication-rich period for GDM; glycemic control is hardest to maintain.
Maternal Complications
| Complication | Mechanism |
|---|---|
| Preeclampsia / Eclampsia | Highest risk period; GDM significantly increases this risk |
| Polyhydramnios | Progressive; causes discomfort, preterm labor, cord prolapse, placental abruption |
| Preterm labor | Uterine overdistension from polyhydramnios; also iatrogenic early delivery |
| Increased cesarean delivery rate | Due to macrosomia, failed labor progress, shoulder dystocia risk |
| Diabetic ketoacidosis (DKA) | Can occur at lower glucose levels than in non-pregnant women (euglycemic DKA); triggers include infection, steroids for fetal lung maturity |
| Worsening retinopathy | Proliferative retinopathy can progress; active proliferative disease is indication for early delivery |
| Difficult glycemic control | Insulin requirements peak at 0.9-1.2 units/kg/day in third trimester vs. 0.7-0.8 in first trimester |
Fetal / Neonatal Complications
| Complication | Mechanism |
|---|---|
| Macrosomia (>4000 g or >4500 g) | Primary impact of GDM; excess fetal fat from insulin-driven anabolism |
| Shoulder dystocia | Asymmetric macrosomia (large trunk relative to head) leads to bony obstruction at delivery |
| Birth trauma | Erb's palsy (brachial plexus injury), clavicle fracture, facial nerve palsy - all from macrosomia/shoulder dystocia |
| Intrauterine fetal demise (stillbirth) | Fetal hypoxia from placental insufficiency, ketoacidosis, and metabolic disturbance; risk is highest in poorly controlled GDM |
| Fetal growth restriction | In women with vascular disease; opposite extreme of macrosomia |
| Abnormal fetal surveillance (NST, BPP) | Hyperglycemia impairs fetal CNS responsiveness; reactive NST may be delayed |
PERINATAL / NEONATAL COMPLICATIONS
| Complication | Mechanism |
|---|---|
| Neonatal hypoglycemia | Fetal hyperinsulinemia persists after delivery but maternal glucose supply stops abruptly; most common neonatal metabolic complication |
| Respiratory Distress Syndrome (RDS) / Transient Tachypnea of Newborn (TTN) | Fetal hyperinsulinemia delays surfactant maturation; also from preterm delivery |
| Neonatal hyperbilirubinemia (jaundice) | Polycythemia from fetal hypoxia increases RBC turnover and bilirubin load |
| Neonatal polycythemia | Fetal hypoxia stimulates erythropoietin; increased RBC mass |
| Neonatal hypocalcemia | Functional hypoparathyroidism in infants of diabetic mothers |
| Hypertrophic cardiomyopathy | Insulin-driven septal hypertrophy may cause left ventricular outflow tract obstruction |
| Birth injuries | Shoulder dystocia-related: Erb's palsy, Klumpke's palsy, clavicle/humerus fractures |
LONG-TERM / POST-PREGNANCY COMPLICATIONS
| Who | Complication |
|---|---|
| Mother | 30-70% risk of developing type 2 diabetes within 10-20 years; recurrence of GDM in future pregnancies (~50%); increased cardiovascular risk |
| Child | Increased risk of obesity, insulin resistance, type 2 diabetes, and metabolic syndrome in later life (intrauterine programming) |
| Child's neurodevelopment | Some studies show lower scores on fine/gross motor tests and attention tasks in children born to diabetic mothers |
Summary Diagram
Quick Mnemonic: Complications of GDM
- Harrison's Principles of Internal Medicine 22E (2025) - Diabetes Mellitus in Pregnancy section
- Creasy & Resnik's Maternal-Fetal Medicine, Principles and Practice - GDM management and fetal outcomes
- Goldman-Cecil Medicine - Gestational Diabetes: Prognosis and complications
- Fuster & Hurst's The Heart, 15th Ed. - GDM and cardiovascular outcomes
trimester wise htn in pregnancy
hypertension in pregnancy preeclampsia eclampsia classification diagram
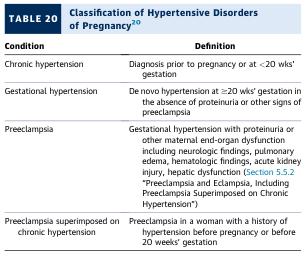
TABLE 20 Classification of Hypertensive Disorders of Pregnancy²⁰ <table><thead><tr><th>Condition</th><th>Definition</th></tr></thead><tbody><tr><td>Chronic hypertension</td><td>Diagnosis prior to pregnancy or at <20 wks' gestation</td></tr><tr><td>Gestational hypertension</td><td>De novo hypertension at ≥20 wks' gestation in the absence of proteinuria or other signs of preeclampsia</td></tr><tr><td>Preeclampsia</td><td>Gestational hypertension with proteinuria or other maternal end-organ dysfunction including neurologic findings, pulmonary edema, hematologic findings, acute kidney injury, hepatic dysfunction (Section 5.5.2 "Preeclampsia and Eclampsia, Including Preeclampsia Superimposed on Chronic Hypertension")</td></tr><tr><td>Preeclampsia superimposed on chronic hypertension</td><td>Preeclampsia in a woman with a history of hypertension before pregnancy or before 20 weeks' gestation</td></tr></tbody></table>
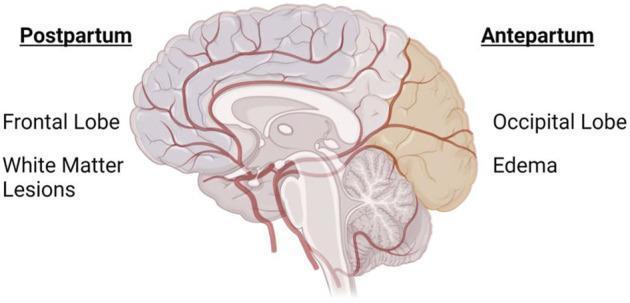
A medical anatomical diagram illustrating the differential cerebral involvement in preeclampsia during the antepartum and postpartum periods. The image features a sagittal view of the human brain with a red cerebral vasculature overlay, highlighting two distinct regions of clinical significance. The posterior region (occipital and parietal lobes) is shaded in tan and labeled 'Antepartum,' indicating the common occurrence of cerebral edema during pregnancy. The anterior region (frontal lobe) is labeled 'Postpartum,' specifically associated with the development of white matter lesions. This diagram serves as a visual explanation of the regional pathophysiology and neuroimaging findings associated with (pre)eclampsia, emphasizing how the timing relative to delivery (pregnancy vs. postpartum) correlates with specific anatomical localizations of brain injury. Key educational concepts include the clinical manifestations of hypertensive disorders of pregnancy, blood-brain barrier disruption, and regional vascular susceptibility in the brain.
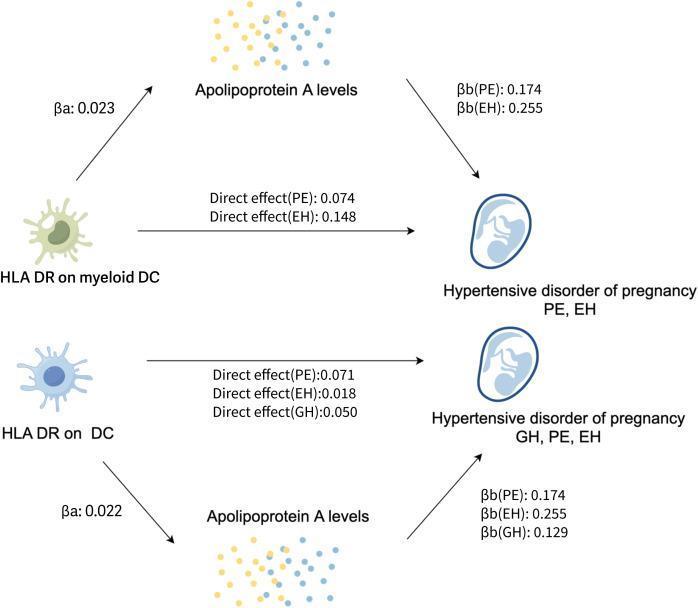
This pathophysiology diagram illustrates proposed causal pathways in the pathogenesis of Hypertensive Disorders of Pregnancy (HDP), specifically Pre-eclampsia (PE), Essential Hypertension (EH), and Gestational Hypertension (GH). The diagram is divided into two parallel signaling pathways demonstrating the relationship between HLA DR expression on Dendritic Cells (DCs) and HDP outcomes, mediated by Apolipoprotein A (apoA) levels. The top pathway shows 'HLA DR on myeloid DC' having both a direct effect on PE (0.074) and EH (0.148) and an indirect effect mediated through apoA levels. The bottom pathway shows 'HLA DR on DC' with direct effects on GH, PE, and EH, alongside a mediated pathway through apoA. Numerical beta values (βa and βb) quantify the causal associations at each node. Representative icons include a dendritic cell, a cluster of dots for apoA levels, and a stylized fetal/placental icon representing HDP. This infographic serves as a summary of Mendelian Randomization and mediation analysis results in obstetric immunology research.
Hypertension in Pregnancy - Trimester-wise
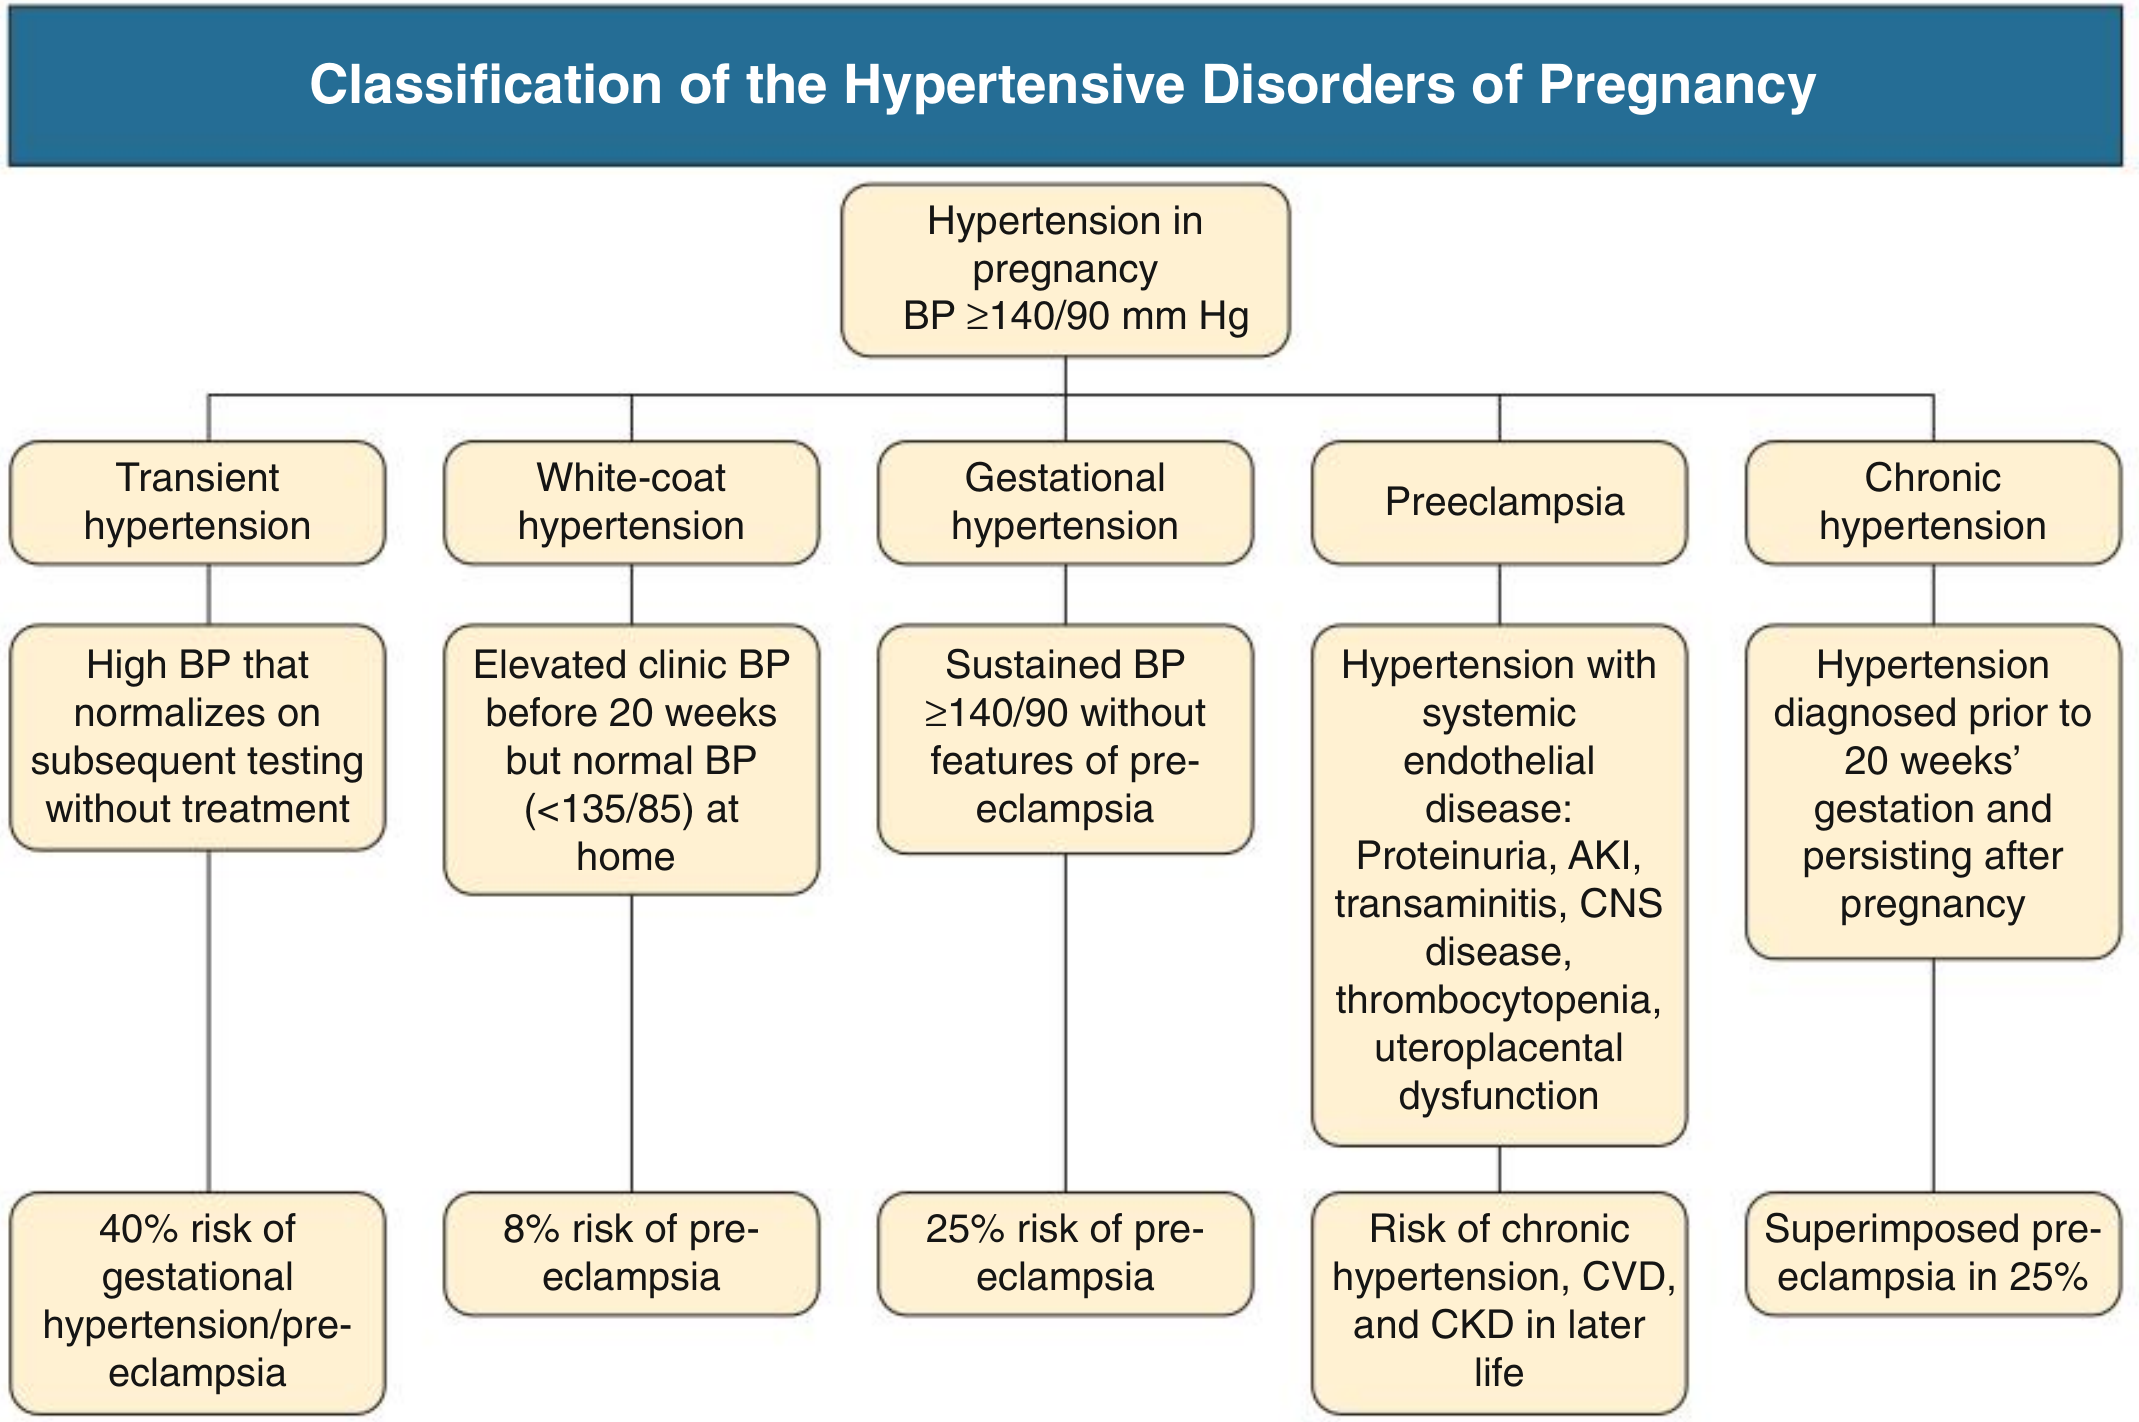
Classification of Hypertensive Disorders of Pregnancy (HDP)
| Category | Definition |
|---|---|
| Chronic hypertension | BP ≥140/90 diagnosed before pregnancy or before 20 weeks, persisting beyond 12 weeks postpartum |
| Gestational hypertension | New-onset BP ≥140/90 after 20 weeks without features of preeclampsia |
| Preeclampsia | New HTN after 20 weeks + proteinuria (uPCR >30 mg/mmol) OR end-organ dysfunction |
| Preeclampsia superimposed on chronic HTN | New preeclampsia features in a woman with known chronic HTN |
| White-coat hypertension | Elevated clinic BP (≥140/90) but normal home BP (<135/85) |
HTN affects 10-12% of all pregnancies; preeclampsia affects ~4.6% globally. Hypertensive disorders account for 10-20% of all maternal deaths worldwide.
FIRST TRIMESTER (Weeks 1-13)
Normal BP Changes in Early Pregnancy
Chronic Hypertension - Active in First Trimester
| Complication | Notes |
|---|---|
| Superimposed preeclampsia | ~20% of chronic HTN cases develop this; risk is much higher if pre-existing renal disease, diabetes, or antiphospholipid syndrome |
| Placental abruption | Hypertension-related placental vascular insufficiency |
| Worsening end-organ damage | Retinopathy, nephropathy, cardiac disease can worsen in first trimester |
| Drug adjustment needed | ACE inhibitors and ARBs must be stopped immediately (teratogenic/fetotoxic) |
| Complication | Notes |
|---|---|
| Fetal growth restriction (FGR) | Chronic vascular damage reduces uteroplacental perfusion |
| Spontaneous abortion | Increased in uncontrolled severe hypertension |
Preeclampsia Screening (First Trimester - 11-13+6 weeks)
SECOND TRIMESTER (Weeks 14-27)
Blood Pressure Pattern
Chronic Hypertension - Second Trimester
| Complication | Notes |
|---|---|
| Apparent "normalization" of BP | Up to 1/3 of women with essential HTN become normotensive in first half of pregnancy - antihypertensives may be temporarily stopped |
| Superimposed preeclampsia onset | Can begin from 20 weeks; combined morbidity higher than either alone |
| Placental abruption | Progressive risk with inadequately controlled HTN |
| Hypertensive urgency/emergency | If diastolic >105 mmHg persistently |
| Complication | Notes |
|---|---|
| FGR | Uteroplacental insufficiency; serial ultrasound for growth surveillance is mandatory |
| Oligohydramnios | Reduced renal perfusion from placental insufficiency |
| Abnormal umbilical artery Doppler | Early sign of placental insufficiency |
Early-Onset Preeclampsia (from 20 weeks onward, usually severe)
| Complication | Notes |
|---|---|
| Severe hypertension (≥160/110 mmHg) | Risk of hypertensive encephalopathy, stroke |
| HELLP syndrome | Hemolysis, Elevated Liver enzymes, Low Platelets - can be life-threatening |
| Acute kidney injury | Glomerular endotheliosis; rising creatinine |
| Pulmonary edema | Capillary leak + decreased oncotic pressure from proteinuria |
| DIC (Disseminated Intravascular Coagulation) | From placental abruption or HELLP |
| Hepatic capsule hemorrhage / rupture | Rare but catastrophic |
| Complication | Notes |
|---|---|
| Preterm birth | Iatrogenic delivery for maternal safety is the primary cause; associated with all prematurity complications |
| Severe FGR | Placental ischemia; head-sparing IUGR pattern |
| Intrauterine fetal demise | From placental insufficiency or abruption |
| Oligohydramnios | Reduced fetal renal perfusion |
THIRD TRIMESTER (Weeks 28-40)
Blood Pressure Pattern
Gestational Hypertension
| Feature | Details |
|---|---|
| Onset | After 20 weeks, peaks in third trimester |
| Risk of progression | ~25% progress to preeclampsia; must be monitored closely |
| Resolution | Usually resolves by 12 weeks postpartum; if not, reclassify as chronic HTN |
- Progression to preeclampsia/eclampsia
- Increased risk of cesarean delivery
- Cardiovascular disease risk in later life (40% risk of gestational HTN/preeclampsia)
- Mild FGR
- Slightly increased preterm birth risk (iatrogenic)
Preeclampsia - Third Trimester (Late Onset, Most Common Form)
- Proteinuria: uPCR >30 mg/mmol OR 300 mg/24h
- AKI (creatinine rise)
- Elevated transaminases (AST/ALT)
- Thrombocytopenia (<100,000/μL)
- Neurological features (severe headache, visual disturbances, hyperreflexia)
- Pulmonary edema
- Uteroplacental dysfunction (FGR, abnormal Doppler, stillbirth)
| System | Complication |
|---|---|
| CNS | Eclampsia (seizures), stroke/cerebral hemorrhage, hypertensive encephalopathy, cortical blindness (PRES - posterior reversible encephalopathy syndrome) |
| Renal | Acute kidney injury, proteinuria, oliguria |
| Hepatic | HELLP syndrome, hepatic infarction, subcapsular hematoma, hepatic rupture |
| Hematologic | DIC, thrombocytopenia, microangiopathic hemolytic anemia |
| Cardiovascular | Pulmonary edema, cardiomyopathy |
| Placental | Abruptio placentae |
| Maternal death | Due to eclampsia, cerebral hemorrhage, hepatic failure, renal failure, pulmonary edema |
| Complication | Mechanism |
|---|---|
| Preterm birth | Iatrogenic delivery is most common cause of neonatal mortality |
| FGR / SGA | Uteroplacental ischemia and placental infarction |
| Stillbirth / IUFD | Placental insufficiency, abruption |
| Oligohydramnios | Reduced fetal renal perfusion |
| Neonatal prematurity complications | RDS, IVH, NEC, retinopathy of prematurity |
| Perinatal mortality | 10% globally in preeclampsia |
HELLP Syndrome (Third Trimester / Peripartum)
- H - Hemolysis (microangiopathic)
- EL - Elevated Liver enzymes (AST/ALT)
- LP - Low Platelets (<100,000/μL)
Eclampsia
POSTPARTUM PERIOD
| Complication | Notes |
|---|---|
| Postpartum eclampsia | Can occur up to 4 weeks post-delivery; most within 48 hours |
| Persistent HTN | Preeclampsia/gestational HTN may take days-weeks to resolve |
| Chronic HTN | If BP does not normalize by 12 weeks postpartum |
| Long-term cardiovascular risk | 50% of women with preeclampsia develop hypertension later in life; increased risk of CKD, stroke, ischemic heart disease |
Quick Reference Summary Table
| Period | Type of HTN | Key Maternal Risk | Key Fetal Risk |
|---|---|---|---|
| <20 weeks | Chronic HTN | Superimposed PE (20%), abruption | FGR, spontaneous abortion |
| 20-28 weeks | Early PE (severe) | HELLP, stroke, AKI, pulmonary edema | Extreme prematurity, stillbirth |
| 28-34 weeks | PE / HELLP | DIC, hepatic rupture, eclampsia | Preterm birth, FGR, IUFD |
| 34-40 weeks | Gestational HTN, Late PE | Eclampsia, abruption, C/S | Mild FGR, iatrogenic preterm |
| Postpartum | Postpartum PE/eclampsia | Stroke, cardiac failure, CKD | Neonatal prematurity sequelae |
Safe Antihypertensives in Pregnancy
| Drug | Route | Use |
|---|---|---|
| Methyldopa | Oral | First-line chronic HTN |
| Labetalol | Oral / IV | Chronic + acute severe HTN |
| Nifedipine (slow release) | Oral | Second-line/add-on |
| Hydralazine | IV | Acute severe HTN |
| Magnesium sulfate | IV | Eclampsia prophylaxis/treatment (NOT antihypertensive) |
- Comprehensive Clinical Nephrology 7th Ed. - HYPERTENSION IN PREGNANCY (Classification, Epidemiology, Preeclampsia pathophysiology)
- Brenner and Rector's The Kidney - Maternal and Neonatal Mortality in preeclampsia
- Textbook of Family Medicine 9e - Classification and management of chronic HTN in pregnancy
- Creasy & Resnik's Maternal-Fetal Medicine - Preeclampsia spectrum and HELLP
- Tintinalli's Emergency Medicine - Severe preeclampsia/eclampsia/HELLP complications