
Lumbo pelvic rhythm 10 marks edu
lumbopelvic rhythm lumbar spine pelvis flexion diagram
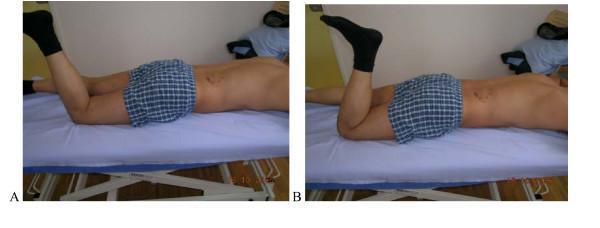
This clinical photograph set demonstrates the 'Prone Lying Active Knee Flexion' test, a movement control assessment for the lumbar spine and pelvis. Image A (left) displays the correct performance of the test: the subject is prone, actively flexing the knee toward 90 degrees while maintaining a neutral, stable lower back and pelvis without rotational compensation. Image B (right) illustrates a positive/incorrect finding: as the knee flexes, there is observable anterior tilting or rotation of the pelvis and lumbar spine, indicating poor segmental stabilization and movement dysfunction. This diagnostic protocol, based on Sahrmann and O'Sullivan criteria, is utilized in physical therapy and orthopedics to evaluate rotational control of the lumbopelvic region. The comparison highlights how regional interdependence between the hip and lumbar spine can manifest as compensatory movement patterns in patients with low back pain or instability.
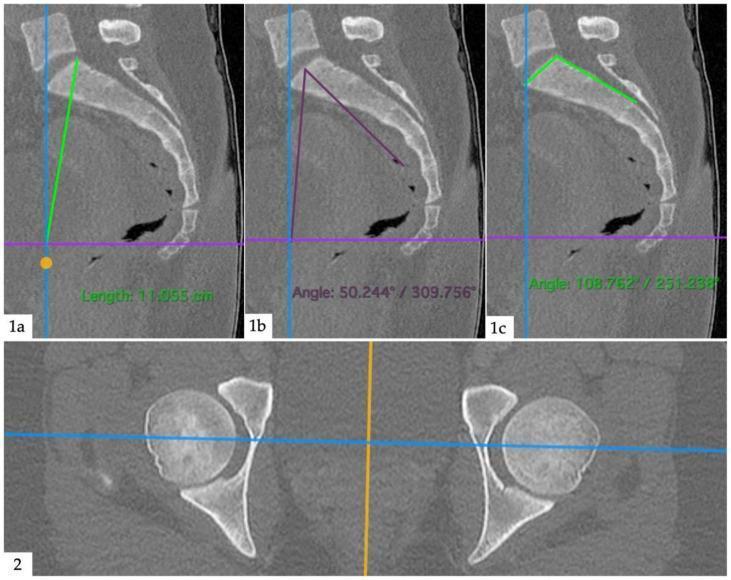
Diagnostic CT scans of the human pelvis and lumbar spine demonstrating lumbopelvic parameters. The image consists of four panels: three sagittal views (1a, 1b, 1c) and one axial view (2). Panel 1a illustrates the measurement of the Pelvic Radius (PR), shown as a green line connecting the posterior-superior corner of the S1 vertebra to the center point between the femoral heads. Panel 1b displays the Pelvic Incidence (PI) angle, formed between a line perpendicular to the sacral plateau and a line connecting the center of the sacral plateau to the midpoint of the femoral heads. Panel 1c shows the Sacral Table Angle (STA), defined by the angle between the posterior wall of the sacrum and the sacral plateau. Panel 2 provides an axial cross-section at the level of the hip joints, showing bilateral femoral heads within the acetabula, with horizontal and vertical reference lines intersecting the centers of rotation to aid spatial orientation and triangulation. These measurements are essential in orthopedic and radiological assessments of spinal sagittal balance and pelvic morphology.
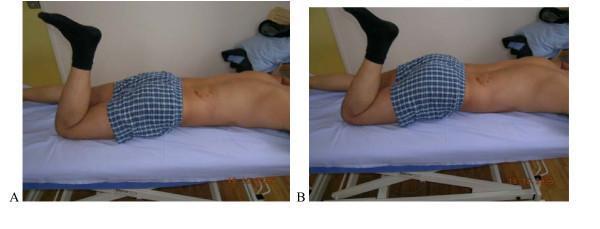
This clinical photograph displays a side-by-side comparison (A and B) of a Prone Lying Active Knee Flexion test, used to assess motor control of the lumbar spine and pelvis. The subject is positioned prone on an examination table. In Image A (Correct), the subject performs active knee flexion to 90 degrees while maintaining a neutral lumbar spine and stable pelvic alignment, with the torso remaining in contact with the bed. In Image B (Incorrect), the same movement results in a compensatory lumbo-pelvic dysfunction; as the knee flexes, the lower back exhibits an anterior pelvic tilt and lumbar extension (arching), creating visible space between the lower back and the table surface. This visual demonstrates movement impairment where the subject fails to dissociate knee flexion from spinal movement, suggesting a lack of lumbopelvic stability or 'extension control' dysfunction in the context of physical therapy and orthopedic assessment.
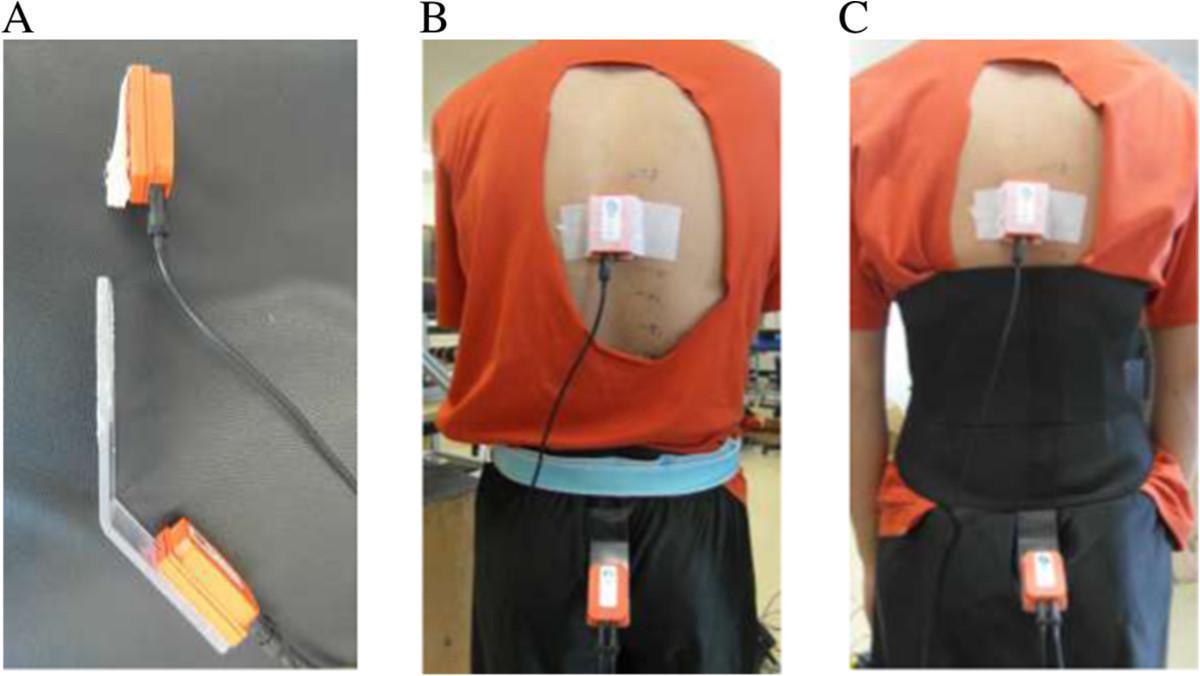
This composite procedural image details the instrumentation setup for 3D motion analysis of the pelvis and lumbar spine. Panel A shows two inertial sensors: the upper sensor is attached to a protective foam layer, and the lower sensor is fixed to an angulated plastic plate designed to avoid interference. Panel B displays the sensors applied to a subject in a control condition. The upper sensor is secured with medical adhesive tape over the thoracic spine through an aperture in the shirt. The lower sensor is positioned over the sacrum, stabilized by an elastic band and adhesive, and extends beneath the waistline. Panel C illustrates the experimental condition where a lumbar belt is worn. The belt is applied over the lower sensor's stabilization plate and elastic band, demonstrating how the specialized mounting allows for continuous pelvic monitoring without physical interference from the support garment. This setup is utilized in biomechanical research to evaluate the effects of lumbar belts on lumbopelvic rhythm and spinal range of motion.
lumbar spine forward flexion range of motion biomechanics
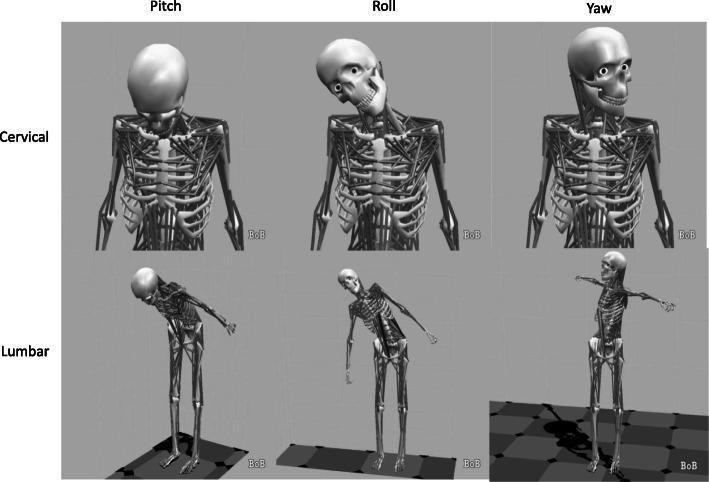
Anatomical biomechanics diagram illustrating the three planes of motion—pitch, roll, and yaw—applied to the cervical and lumbar spine using 3D musculoskeletal skeletal models. The top row focuses on the cervical spine and head: 'Pitch' shows flexion (forward tilting of the skull), 'Roll' shows lateral flexion (side tilting), and 'Yaw' shows axial rotation (horizontal turning of the head). The bottom row displays these movements in the lumbar spine and full body: 'Pitch' depicts trunk flexion at the waist, 'Roll' shows lateral trunk bending, and 'Yaw' illustrates axial rotation of the torso relative to the pelvis with arms extended. The diagram serves as an educational tool for understanding spinal kinematics, range of motion, and orientation during movement analysis or clinical extrication studies. Labels indicate the specific anatomical region (Cervical vs. Lumbar) and the rotational axis (Pitch/Roll/Yaw), utilizing precise biomechanical terminology to define multi-planar spinal movement.
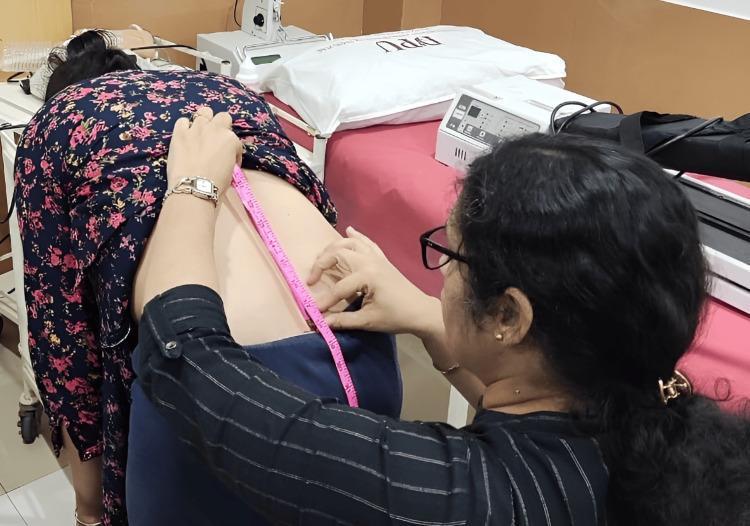
This clinical photograph demonstrates the assessment of lumbar flexion range of motion using the Modified-Modified Schober’s Test (MMST). The patient is positioned in active forward trunk flexion, while the clinician, standing to the side and slightly behind, uses a pink flexible measuring tape to determine the distance between two pre-marked anatomical landmarks on the lumbar spine. These landmarks typically include a point level with the inferior margins of the posterior superior iliac spines (PSIS) and a second point marked 15 cm superiorly along the midline. The image captures the dynamic measurement phase where the expansion of the skin over the lumbar vertebrae is quantified. The setting is a physiotherapy clinic, indicated by a treatment table with a red cover, a pillow, and therapeutic modalities like a pressure biofeedback unit or electrical stimulation machine in the background. This procedure is a standard clinical method for objectively evaluating spinal mobility and monitoring progress in patients with low back pain or movement control impairments.
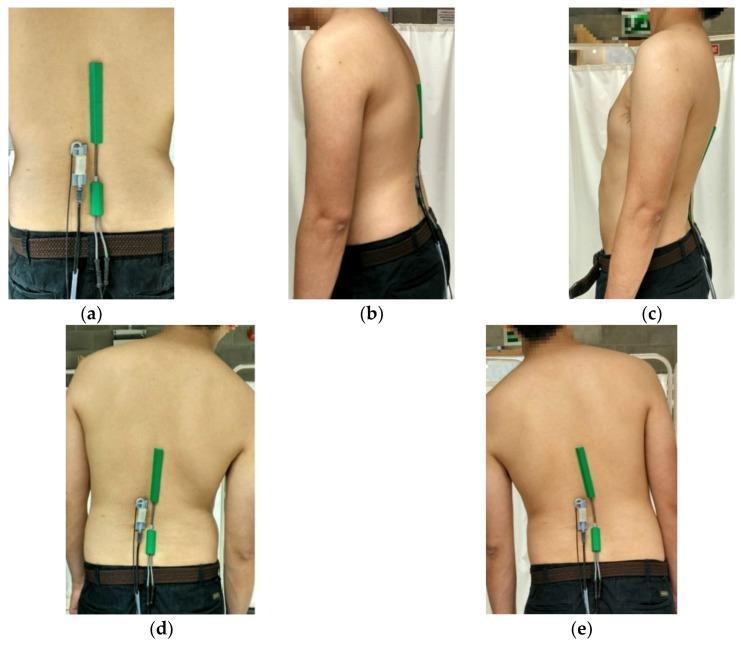
This set of clinical photographs demonstrates the application of wearable sensors for kinematic assessment of the lumbar spine. Image (a) shows the posterior view of a participant in a neutral standing position with two sensors vertically aligned on the lower back: a green twin-axis Biometrics electrogoniometer spanning L1–L5 and a shorter Plastic Optical Fiber (POF) sensor positioned at the L3–L4 level. Images (b) through (e) illustrate the participant performing fundamental spinal movements for range of motion (ROM) validation: (b) lumbar flexion (forward bending), (c) lumbar extension (backward bending), (d) right lateral flexion, and (e) left lateral flexion. The sensors are firmly adhered to the skin, conforming to the spinal curvature during movement to capture changes in sagittal and frontal plane angles. This setup is typical in physical therapy research and biomechanics for evaluating spinal mobility, postural control, and the accuracy of novel wearable diagnostic technologies against established goniometric standards.
lumbopelvic rhythm phases biomechanics clinical significance 10 marks
https://pmc.ncbi.nlm.nih.gov/articles/PMC5637395
Lumbo-Pelvic Rhythm (10 Marks)
Definition
Anatomy Involved
| Structure | Role |
|---|---|
| Lumbar vertebrae (L1-L5) | Flex through intervertebral joints; lordosis reverses |
| Sacroiliac joint | Transmits load between spine and pelvis |
| Hip joints (femoral heads) | Pivot point for pelvic rotation (anterior/posterior tilt) |
| Hamstrings | Limit pelvic anterior tilt; major determinant of pelvic contribution |
| Erector spinae | Eccentrically control forward flexion; concentrically drive extension |
| Iliopsoas | Stabilizes lumbar spine relative to pelvis |
Normal Lumbo-Pelvic Rhythm - Forward Flexion (0 to ~120°)
- ~60° lumbar flexion (reversal of lumbar lordosis + intervertebral flexion)
- ~60° pelvic rotation (anterior tilt over the femoral heads)
Three-Phase Description
Phase 1: Initiation (0-30° of trunk flexion)
- The lumbar spine flexes first - the normal lumbar lordosis flattens and reverses into flexion.
- The pelvis moves relatively little at this stage.
- The lumbo-pelvic ratio (lumbar:pelvic contribution) is approximately 2.5:1 at this early stage.
- Erector spinae contracts eccentrically to control the forward movement.
Phase 2: Mid-range (30-90° of trunk flexion)
- Both the lumbar spine and pelvis contribute simultaneously.
- The pelvis begins to rotate anteriorly (tilt forward) over the femoral heads as the hamstrings allow.
- The ratio transitions - pelvic contribution increases progressively.
Phase 3: Full flexion (90-120° of trunk flexion)
- The lumbar spine has reached near-maximum flexion.
- The pelvis dominates - contributing the bulk of remaining motion by anteriorly rotating further over the hip joints.
- The lumbopelvic ratio drops to approximately 1.3:1 (pelvis now more dominant).
- At full flexion, the erector spinae becomes electrically silent (the critical point or flexion relaxation phenomenon) - passive ligamentous structures bear load.
Return to Upright - Extension Phase
- Pelvis rotates posteriorly first (hip extensors - gluteus maximus and hamstrings initiate)
- Lumbar spine then extends to restore lordosis
- Erector spinae and multifidus fire concentrically to complete upright posture
The lumbopelvic ratio increases from ~1.2 (at full flexion) back to ~2.9 during the early return phase as the pelvis contributes more initially.
Flexion-Relaxation Phenomenon
- Posterior longitudinal ligament
- Supraspinous and interspinous ligaments
- Thoracolumbar fascia
- Facet joint capsules
Biomechanical Significance
- The normal rhythm minimizes compressive and shear forces at L5-S1. Research shows that the natural lumbopelvic coordination reduces L5-S1 compression forces by up to 21% and shear forces by up to 45% compared to altered ratios (Tafazzol et al., Clinical Biomechanics, 2014).
- A simultaneous rhythm exists - lumbar and pelvis movements are largely in-phase in healthy individuals.
Altered Lumbo-Pelvic Rhythm - Clinical Patterns
1. Hip-dominant pattern (Pelvis moves too early)
- Cause: tight erector spinae, lumbar stiffness, lumbar fusion
- Result: excessive early pelvic tilt, increased demand on hip extensors
2. Lumbar-dominant pattern (Lumbar moves too much, pelvis moves too little)
- Cause: tight hamstrings (most common cause)
- Result: excessive lumbar flexion stress, predisposes to lumbar disc herniation and facet injury
- Hamstring tightness limits anterior pelvic tilt, forcing the lumbar spine to compensate with excessive flexion
3. Reversal of rhythm
- Pelvis moves before lumbar spine on forward flexion
- Seen in hip pathology, ankylosing spondylitis
Clinical Assessment
Observation Method (Cailliet's Test)
- Patient stands, marks placed at L1 and S2
- Patient bends forward - observe sequential movement
- Normal: lumbar flattens first, then pelvis rotates
- Abnormal: pelvis tilts immediately with little lumbar motion (or vice versa)
Schober's Test
- Quantifies lumbar flexion contribution (normal expansion >5 cm on Modified Schober's)
Hamstring Flexibility
- Sit-and-reach test or passive straight leg raise - tight hamstrings (SLR <70°) are the most common cause of altered LPR
Clinical Relevance
| Condition | LPR Alteration |
|---|---|
| Lumbar disc herniation | Decreased lumbar contribution; hip compensates |
| Hamstring tightness | Decreased pelvic rotation; lumbar overworks |
| Hip osteoarthritis | Decreased hip/pelvic rotation; lumbar compensates |
| Ankylosing spondylitis | Rigid lumbar spine; pelvis initiates all motion |
| Low back pain (LBP) | Loss of flexion-relaxation phenomenon; increased paraspinal EMG at full flexion |
| Spondylolisthesis | Restricted motion segment; altered rhythm with pain avoidance |
Summary Diagram

Key Points to Remember (10-mark answer)
- Definition: Coordinated sequential movement of lumbar spine + pelvis during flexion/extension
- Phases: Lumbar first (early flexion) → Both together → Pelvis dominant (late flexion)
- Ratio: Lumbopelvic ratio decreases from ~2.5:1 (early) to ~1.3:1 (full flexion)
- Return: Pelvis posteriorly tilts FIRST, then lumbar extends
- Flexion relaxation: Erector spinae becomes silent at full flexion (absent in LBP)
- Most common cause of altered rhythm: Tight hamstrings
- Biomechanical purpose: Minimize L5-S1 compressive and shear forces
- Assessment: Clinical observation + Schober's test + hamstring flexibility
- Clinical conditions: LBP, disc herniation, hip OA, ankylosing spondylitis
- Rehabilitation: Hamstring stretching, core stability, movement re-education restore normal rhythm
Bpt lab consept in 1st year
Which BPT 1st year lab subject are you asking about? · What do you need this for?
BPT 1st year biochemistry lab practical concepts experiments viva
BPT physiotherapy 1st year biochemistry lab experiments syllabus India urine blood glucose protein
https://prakashinstitute.edu.in/wp-content/uploads/3.-BPT-Sy…
BPT 1st Year - Biochemistry Lab: Complete Concept Guide
Overview
Section A: Lab Safety and General Rules
- Wear a lab coat and gloves at all times
- Label all test tubes clearly
- Never pipette by mouth
- Dispose of blood/urine specimens in designated biohazard bins
- Wash hands before leaving the lab
- Report broken glassware immediately to the lab assistant
Section B: Core Lab Experiments (BPT 1st Year)
Experiment 1: Qualitative Tests for Carbohydrates in Urine
A. Benedict's Test (for Reducing Sugars - Glucose)
| Parameter | Detail |
|---|---|
| Principle | Glucose reduces Cu²⁺ (blue) to Cu⁺ (red/orange) in alkaline solution |
| Reagent | Benedict's reagent (sodium citrate + sodium carbonate + CuSO₄) |
| Procedure | 5 ml Benedict's + 8 drops urine → boil 5 min |
| Result | Green (trace) → Yellow → Orange → Brick-red precipitate = positive |
| Normal | Negative (no glucose in urine) |
| Significance | Glucosuria seen in diabetes mellitus, renal glycosuria |
B. Fehling's Test (Alternative for Reducing Sugar)
- Uses Fehling's A (CuSO₄) + Fehling's B (sodium potassium tartrate in NaOH)
- Same brick-red precipitate indicates reducing sugars
- Less commonly done now; Benedict's is preferred
C. Selivanoff's Test (for Fructose)
| Parameter | Detail |
|---|---|
| Principle | HCl converts fructose to HMF → reacts with resorcinol → red color |
| Reagent | Selivanoff's reagent (resorcinol in HCl) |
| Result | Cherry-red within 30 seconds = fructose present |
| Significance | Fructosuria (essential or hereditary) |
D. Bial's Test (for Pentoses)
- Pentoses → furfural (with HCl) + orcinol → green color
- Significance: Pentosuria (rare condition; benign essential pentosuria)
- (Tietz Textbook of Laboratory Medicine, 7th Ed, p. 1143)
E. Iodine Test (for Starch / Polysaccharides)
| Parameter | Detail |
|---|---|
| Reagent | Iodine solution (KI + I₂) |
| Result | Blue-black = starch present; Red/brown = glycogen |
| Principle | Iodine molecules trapped in helical coils of starch |
| Significance | Tests food/stool for starch content |
Experiment 2: Qualitative Tests for Proteins in Urine (Urinary Protein)
A. Heat and Acetic Acid Test
- Procedure: Fill 2/3 of test tube with urine → heat upper portion → add 2-3 drops glacial acetic acid
- Positive: White precipitate (persists after adding acid)
- Significance: Proteinuria - seen in nephrotic syndrome, glomerulonephritis, preeclampsia
B. Heller's Ring Test (for Protein)
- Concentrated nitric acid layered under urine
- Positive: White ring at interface
- Significance: Detects albumin in urine
C. Biuret Test (for Proteins in General)
| Parameter | Detail |
|---|---|
| Reagent | NaOH + CuSO₄ (dilute) |
| Principle | Cu²⁺ reacts with peptide bonds → violet/purple color |
| Positive | Presence of proteins (at least 2 peptide bonds needed) |
| Negative | Amino acids and dipeptides |
Experiment 3: Urine Analysis - Physical and Chemical Examination
Physical Examination of Urine
| Property | Normal | Abnormal |
|---|---|---|
| Color | Pale yellow to amber | Red (blood), Dark yellow (bilirubin), Milky (lipiduria) |
| Transparency | Clear | Turbid (infection, crystals) |
| pH | 4.6 - 8.0 | Acidic in fever, diabetes; Alkaline in UTI |
| Volume (24hr) | 1000-1500 ml | Oliguria <400 ml; Polyuria >3000 ml |
| Specific gravity | 1.003-1.030 | Low in diabetes insipidus; High in dehydration |
| Smell | Faint aromatic | Fruity (ketones in DM), Ammonia (UTI) |
Chemical Examination of Urine
| Test | Normal | Abnormal & Cause |
|---|---|---|
| Glucose (Benedict's) | Negative | + in Diabetes mellitus |
| Protein (Heat test) | Negative / trace | + in nephritis, nephrotic syndrome |
| Ketone bodies (Rothera's test) | Negative | + in diabetic ketoacidosis, starvation |
| Bilirubin | Negative | + in obstructive jaundice |
| Urobilinogen | Trace | Increased in hepatocellular jaundice |
| Blood/Hb | Negative | + in renal calculi, glomerulonephritis |
Experiment 4: Rothera's Test (Ketone Bodies in Urine)
| Parameter | Detail |
|---|---|
| Principle | Acetoacetate + acetone react with sodium nitroprusside in alkaline medium → purple ring |
| Reagent | Rothera's reagent (sodium nitroprusside) + ammonium sulphate + ammonia |
| Positive | Purple/lilac ring at interface |
| Significance | Ketonuria - seen in DKA, prolonged fasting, starvation, high-fat diet |
Experiment 5: Bile Salts and Bile Pigments in Urine
A. Hay's Sulfur Test (Bile Salts)
- Sprinkle sulfur powder on urine surface
- Positive: Sulfur sinks (bile salts reduce surface tension)
- Significance: Obstructive or hepatocellular jaundice
B. Gmelin's Test (Bile Pigments - Bilirubin)
- Add conc. nitric acid under urine
- Positive: Play of colors (green → blue → violet → red → yellow) at interface = bilirubin present
- Significance: Jaundice (conjugated hyperbilirubinemia)
C. Fouchet's Test (Bile Pigments - more sensitive)
- Procedure: Urine + BaCl₂ → filter → Fouchet's reagent on precipitate
- Positive: Green color = bilirubin
- Significance: Detection of even small amounts of bilirubin
Experiment 6: Blood Sugar (Glucose) Estimation
Folin-Wu Method (Classical method)
- Principle: Glucose reduces copper (Cu²⁺) in alkaline solution → Cu₂O → reduced phosphomolybdic acid → blue color (colorimetry at 420 nm)
- Normal blood glucose: Fasting: 70-110 mg/dL; Post-prandial: <140 mg/dL
- Significance: Diagnosis of diabetes mellitus, hypoglycemia
Glucose Oxidase-Peroxidase (GOD-POD) Method (Modern method)
- Glucose + O₂ → Gluconic acid + H₂O₂ (glucose oxidase)
- H₂O₂ + chromogen → colored product (peroxidase)
- Read at 505 nm
- More specific - only measures true glucose
| Condition | Glucose (mg/dL) |
|---|---|
| Fasting (normal) | 70-100 |
| Impaired fasting (pre-diabetic) | 100-125 |
| Diabetic (fasting) | ≥126 |
| 2hr post-glucose (normal) | <140 |
| Diabetic (post-glucose) | ≥200 |
Experiment 7: Estimation of Hemoglobin (Sahli's Method)
- Blood + N/10 HCl → acid hematin (brown)
- Dilute with water till color matches standard
- Read off percentage
- Normal Hb: Males 13-18 g/dL; Females 12-16 g/dL
- Significance for BPT: Exercise tolerance, oxygen-carrying capacity, anemia affecting rehabilitation
Experiment 8: Serum Protein Estimation (Biuret Method)
- Total protein: 6.0-8.0 g/dL
- Albumin: 3.5-5.0 g/dL
- Globulin: 2.0-3.5 g/dL
- A:G ratio: 1.2:1 to 2.0:1
| Condition | Change in A:G Ratio |
|---|---|
| Liver cirrhosis | Decreased (albumin falls) |
| Nephrotic syndrome | Decreased (albumin lost in urine) |
| Multiple myeloma | Reversed (globulins raised) |
| Malnutrition | Decreased albumin |
Section C: Important Qualitative Tests at a Glance (Viva Table)
| Test | Reagent | Positive Result | Detects |
|---|---|---|---|
| Benedict's | Cu²⁺ in alkaline | Brick-red precipitate | Reducing sugars |
| Selivanoff's | Resorcinol + HCl | Cherry-red (30 sec) | Fructose |
| Bial's | Orcinol + HCl | Green | Pentoses |
| Iodine | I₂/KI | Blue-black | Starch |
| Biuret | NaOH + CuSO₄ | Purple/violet | Proteins |
| Rothera's | Sodium nitroprusside | Purple ring | Ketones |
| Hay's sulfur | Sulfur powder | Sulfur sinks | Bile salts |
| Gmelin's | Conc. HNO₃ | Play of colors | Bile pigments |
| Heat + Acetic acid | Glacial CH₃COOH | White precipitate | Protein in urine |
Section D: Clinical Biochemistry Reference Values (Must Know for Viva)
| Parameter | Normal Range | Physiotherapy Relevance |
|---|---|---|
| Blood glucose (fasting) | 70-100 mg/dL | Monitor diabetic patients; hypoglycemia risk during exercise |
| HbA1c | <5.7% (normal) | Long-term glucose control in diabetic rehab patients |
| Blood urea | 15-40 mg/dL | Renal function; relevant in elderly patients |
| Serum creatinine | 0.6-1.2 mg/dL (M); 0.5-1.0 (F) | Renal function assessment |
| Serum uric acid | 3.5-7.2 mg/dL (M) | Gout diagnosis; joint pain patients |
| Total cholesterol | <200 mg/dL | Cardiac rehab patients |
| Serum calcium | 8.5-10.5 mg/dL | Muscle cramps, tetany, osteoporosis |
| Serum sodium | 135-145 mEq/L | Fluid balance, hyponatremia post-exercise |
| Serum potassium | 3.5-5.0 mEq/L | Muscle weakness, cardiac arrhythmias |
| pH (arterial blood) | 7.35-7.45 | Acid-base balance, respiratory conditions |
Section E: Key Metabolic Pathways (Lab Theory Background)
Glycolysis (Embden-Meyerhof Pathway)
- Glucose → Pyruvate (10 steps, cytoplasm)
- Net yield: 2 ATP + 2 NADH (anaerobic)
- Key enzymes: Hexokinase, Phosphofructokinase-1 (rate-limiting), Pyruvate kinase
- Relevance to PT: Explains energy production during exercise, lactic acid build-up in muscles
TCA Cycle (Krebs Cycle)
- Acetyl-CoA → CO₂ + H₂O + ATP
- Produces: 3 NADH + 1 FADH₂ + 1 GTP per turn
- Located in mitochondrial matrix
- Yields 24 ATP per cycle (indirectly via oxidative phosphorylation)
β-Oxidation of Fatty Acids
- Fatty acids broken down 2 carbons at a time → Acetyl-CoA
- Relevance to PT: Fat is the dominant fuel during low-intensity, prolonged exercise
Section F: Lab Record Writing Format
- Experiment No. and Date
- Title (e.g., "Detection of glucose in urine by Benedict's test")
- Aim - one sentence
- Principle - the chemical reaction or concept
- Requirements - apparatus + reagents
- Procedure - step-by-step (numbered)
- Observation - color, precipitate, ring formed
- Result - Positive / Negative
- Clinical Significance - why it matters clinically
- Precautions - 3-5 key points
Section G: Common Viva Questions (BPT Biochemistry Lab)
| Question | Answer |
|---|---|
| What is the renal threshold for glucose? | ~180 mg/dL |
| Name the enzyme inhibited by fluoride (used in blood glucose collection) | Enolase (prevents glycolysis in the sample) |
| What does a brick-red precipitate in Benedict's test indicate? | Heavy glucosuria (>2 g/dL) |
| What is Bence Jones protein? | Light chains of immunoglobulin in urine - seen in multiple myeloma; precipitates at 40-60°C, dissolves at boiling |
| What are ketone bodies? | Acetone, acetoacetate, β-hydroxybutyrate - produced from fatty acid breakdown |
| What is the normal A:G ratio? | 1.2:1 to 2.0:1 |
| Why is Benedict's test preferred over Fehling's test? | More stable reagent, single solution, less hazardous |
| What is the significance of bile salts reducing surface tension? | Basis of Hay's test; bile salts emulsify fats in digestion |