
Easy pathology related topics that can be depicted in a rangoli . Also give me creative ideas to make it
apoptosis versus necrosis cell morphology diagram
cell cycle diagram G1 S G2 M checkpoints

A pathophysiology diagram illustrating the regulatory influence of the Myc oncoprotein on the cell cycle machinery. The bottom section displays a circular flow of the cell cycle phases: G1, S (DNA replication), G2, and M (mitosis), marked with specific checkpoints (G1, G2, and M). The top section details the molecular signaling pathways involving the Max/Myc heterodimer complex. The Max/Myc complex is shown stimulating the Cyclin D2-CDK4 complex and CDK2, while simultaneously inhibiting Cki p27, a cyclin-dependent kinase inhibitor. These actions lead to the inactivation of the Retinoblastoma protein (Rb) through phosphorylation, indicated by a red 'P' tag. The downstream effect of Rb phosphorylation is depicted as the 'Initiation of S phase,' facilitating the transition from G1 to S phase. The diagram serves as an educational tool for understanding oncogenic signaling and cell cycle dysregulation in cancer biology.

This medical illustration depicts the biological roles of the RB1 tumor suppressor. Panel A shows a Pathophysiology Diagram of the cell cycle (G1, S, G2, M phases) highlighting the canonical G1 phase arrest mechanism. It visualizes the inhibition of E2F transcription factors by RB1 and the subsequent release of E2F following RB1 phosphorylation by Cyclin/CDK complexes (Cyclin C/CDK3, Cyclin D/CDK4/6, and Cyclin E/CDK2). Specific checkpoints (M/G1, G1/S, G2/M) and the G0 resting phase are indicated along the circular pathway. Panel B is a Comparison Chart of non-canonical RB1 and E2F functions, using symbolic icons to represent cell fate determination (differentiation), homologous recombination (DNA repair), silencing of repetitive regions (chromatin remodeling), centromere/pericentromeric and telomere structural maintenance (chromosomal stability), and immune responsiveness and evasion. The diagram serves as an educational resource for understanding cancer biology, cell cycle regulation, and the multi-faceted nature of tumor suppressor proteins.
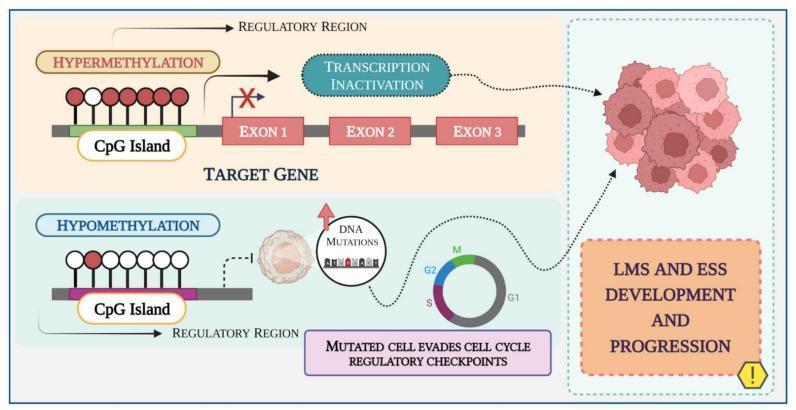
This pathophysiology diagram illustrates the role of DNA methylation in the development and progression of Leiomyosarcoma (LMS) and Endometrial Stromal Sarcoma (ESS). The schematic is divided into two primary epigenetic pathways. The upper panel depicts hypermethylation, where a CpG island in the regulatory region of a target gene is densely populated with methyl groups (red circles). This state leads to 'Transcription Inactivation,' represented by an 'X' blocking the pathway to the target gene's exons (Exon 1, 2, and 3), typically resulting in the silencing of tumor suppressor genes. The lower panel depicts hypomethylation, characterized by a lack of methyl groups (white circles) on the CpG island. This condition is associated with genomic instability, leading to DNA mutations. The diagram shows that mutated cells evade cell cycle regulatory checkpoints (G1, S, G2, M phases), ultimately contributing to the formation of a malignant cell mass. Both pathways converge on the clinical outcome of LMS and ESS development and progression, highlighting how epigenetic dysregulation drives gynecological oncogenesis.
medical rangoli ideas pathology theme anatomy rangoli competition
Easy pathology topics for a rangoli, with ideas for making them
Easiest topics (good for beginners)
| Topic | What to draw | Why it works |
|---|---|---|
| Apoptosis vs necrosis | Split circle. One half is a shrunken cell with a dense dark nucleus and small blebs. The other half is a swollen, bursting cell with spilled contents and an inflammation halo. | Two contrasting halves are easy to color. |
| Cell cycle wheel | Circle divided into G1, S, G2, M, with G0 as a small side loop. Mark the checkpoints with dots or diyas. | A circle is the classic rangoli base. |
| Five signs of inflammation | Five-petal flower, one petal each for rubor (red), calor (orange), tumor (swelling, a bulging petal), dolor (pain, a zigzag), and functio laesa (loss of function). | It matches the usual petal rangoli structure. |
| Reed-Sternberg cell ("owl eye") | An owl face with two large round nuclei and red nucleoli, in a pale cell outline. | It is recognizable and fun to draw. |
| Virchow's triad | Triangle with stasis, endothelial injury, and hypercoagulability at the corners, and a clot (thrombus) in the center. | Triangles are simple, and the labels are short. |
| Normal vs sickle RBC | Biconcave discs next to crescent-shaped sickle cells in a blood vessel border. | Red and dark red give high contrast. |
Slightly harder, good for competitions
- Hallmarks of cancer. A hexagon or wheel with a cancer cell at the center and small icons around it. The icons could show growth signals, evading apoptosis, angiogenesis, invasion and metastasis, and immortality.
- Atherosclerosis. An artery cross-section in concentric rings: lumen, plaque with a yellow lipid core, a fibrous cap, and the vessel wall.
- Granuloma (TB). Concentric rings with a white caseous center, then pink epithelioid cells, a Langhans giant cell with its horseshoe of nuclei, and an outer rim of lymphocytes. This works as a mandala.
- Dysplasia to carcinoma. A staircase or four panels: normal, dysplasia, carcinoma in situ, and invasion through the basement membrane.
- Malaria in an RBC. A large red disc with a blue ring form and a "signet ring" shape. You can add a Plasmodium life-cycle border.
- Mitosis phases. Five small circles in a ring: prophase, metaphase, anaphase, telophase, and cytokinesis. Chromosomes are just short colored sticks.
- Amyloid under Congo red. A red base that shows apple-green only at the center. Use green glitter or green powder for the birefringence.
Creative ideas to make it stand out
- H&E: pink (eosin) and purple (hematoxylin) for tissue and nuclei. This looks distinctive and also teaches the stain.
- Gram stain: purple for Gram-positive cocci in clusters and pink for Gram-negative rods.
- Prussian blue and Congo red: use blue for iron and red for amyloid.
- Turmeric for yellow lipid or fat, such as an atheroma core.
- Kumkum or beetroot powder for blood and RBCs.
- Rice flour for caseous necrosis, since it is white and crumbly.
- Dal, rajma, or mustard seeds for textured nuclei.
- Flower petals for giant cells and the inflammation flower.
- Raised effect: pile coarse salt or rice for swelling (tumor) or plaque, and keep the rest flat.
- Diyas or tea lights at the cell cycle checkpoints, or as nucleoli in the Reed-Sternberg cell.
- Glitter for birefringence, or for apoptotic bodies.
- Fairy lights under a translucent layer so a granuloma or an inflamed vessel appears to glow.
- Before and after: half healthy, half diseased, such as a normal artery and an atherosclerotic one.
- A journey: one long rangoli showing normal, injury, inflammation, repair, and cancer as a flowing path.
- A quiz rangoli: leave a label blank and add a QR code that links to a short explanation.
- Mnemonic rangoli: draw the mnemonic itself, such as the five Fs of thrombosis or the signs of inflammation, as a picture.
Practical tips
- Sketch the design on paper first and choose a symmetrical layout.
- Mark the outline with chalk or white powder. Use a dot grid for circles and wheels.
- Fill from the center outward, and do dark colors last so they don't smudge.
- Use a sieve, a squeeze bottle, or a stencil for thin lines such as membranes and chromosomes.
- Keep text minimal, since 1 to 3 words per label is enough. Put the title in a border.
- For competitions, accuracy and clarity usually count most, followed by color. Stick to one topic and show the pathology correctly rather than cramming in several.