
Teach me Mandelian mode of inheritance for Autosomal disease
autosomal dominant recessive inheritance pedigree diagram
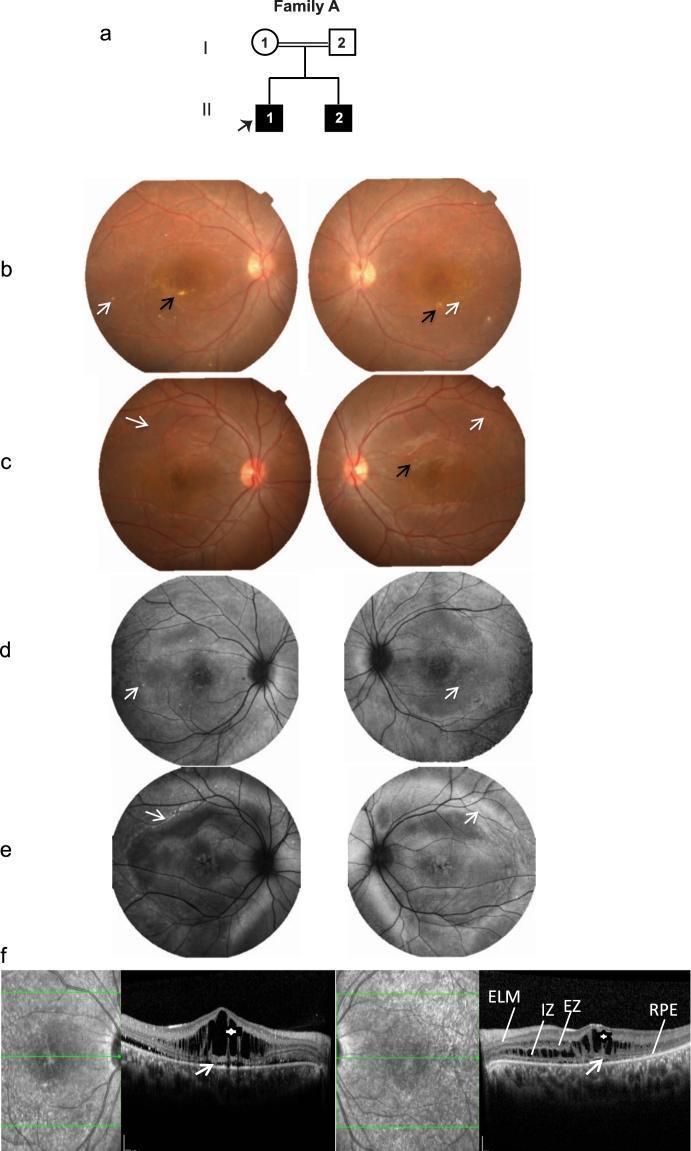
This composite educational image illustrates the clinical and multimodal imaging features of Autosomal Recessive Bestrophinopathy (ARB) in Family A. (a) A pedigree diagram shows two affected siblings with recessive inheritance. (b, c) Color fundus photographs of the proband and sibling display focal macular subretinal fibrosis (black arrows) and sparse, yellowish vitelliform deposits (white arrows). (d, e) Fundus autofluorescence (FAF) images demonstrate corresponding focal dots of hyper-autofluorescence in the macula. (f) Optical Coherence Tomography (OCT) cross-sections reveal significant intraretinal cystoid and schitic changes (white asterisks) primarily in the inner and outer nuclear layers, accompanied by minimal subretinal fluid (white arrows). The OCT images also label key retinal layers: External Limiting Membrane (ELM), Ellipsoid Zone (EZ), Interdigitation Zone (IZ), and Retinal Pigment Epithelium (RPE). The visual data emphasizes the macular structural disruption and retinal architectural changes characteristic of BEST1 gene mutations.
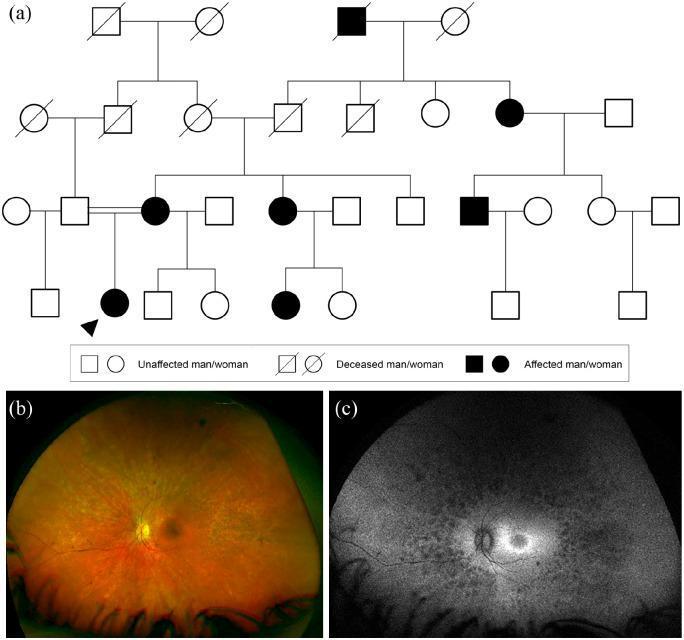
Educational panel illustrating the clinical and genetic characteristics of autosomal dominant retinitis pigmentosa (RP) with reduced penetrance. (a) A four-generation pedigree diagram demonstrating an autosomal dominant inheritance pattern. Affected individuals (filled symbols) are present in multiple generations, though the presence of an unaffected carrier mother of the proband highlights reduced penetrance. (b) Widefield color fundus photograph of a right eye showing classic RP features: significant retinal arteriolar attenuation and scattered, dark, bone spicule-like pigmentary deposits in the mid-periphery. The optic disc appears slightly pale, consistent with waxy disc pallor. (c) Widefield fundus autofluorescence (FAF) image of the same eye. It displays a characteristic perifoveal hyperautofluorescent ring, indicating metabolic stress and lipofuscin accumulation in the RPE at the border of progressing degeneration. Outside the vascular arcades, there are extensive mottled areas of hypoautofluorescence corresponding to RPE atrophy and loss of photoreceptor integrity. This composite serves as a diagnostic reference for hereditary retinal dystrophies, specifically highlighting the clinical manifestation of PRPF31-related retinitis pigmentosa.
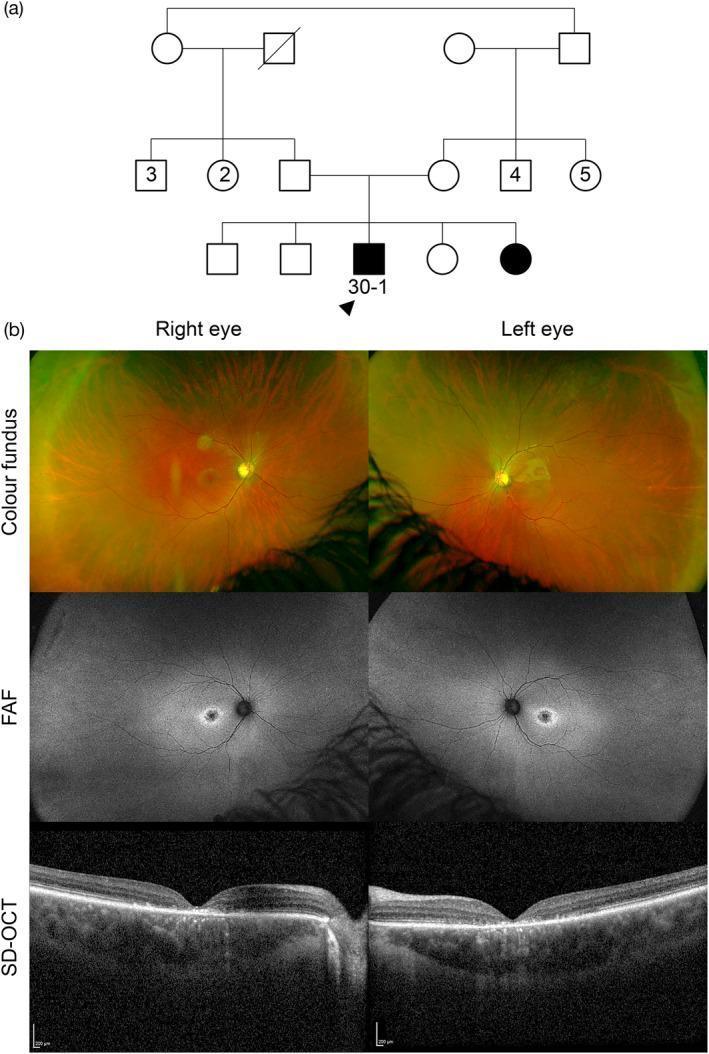
This composite educational graphic details the clinical and genetic profile of a patient with ABCA4-associated retinopathy, specifically Stargardt disease. Section (a) shows a pedigree diagram indicating autosomal recessive inheritance with parental consanguinity. Section (b) presents bilateral ophthalmic imaging: Ultra-widefield (UWF) color fundus photographs demonstrate well-circumscribed areas of central macular atrophy accompanied by scattered pisciform yellow macular flecks. Fundus Autofluorescence (FAF) images exhibit corresponding central hypoautofluorescence (representing retinal pigment epithelium loss) surrounded by a ring of hyperautofluorescence where the active yellow flecks are located. Spectral-domain optical coherence tomography (SD-OCT) horizontal line scans through the foveola reveal significant attenuation of the outer retinal layers, specifically the loss of the ellipsoid zone and thinning of the outer nuclear layer. The multimodal findings characterize the typical phenotype of Stargardt disease, including geographic atrophy and fleck accumulation, correlating with biallelic variants in the ABCA4 gene.
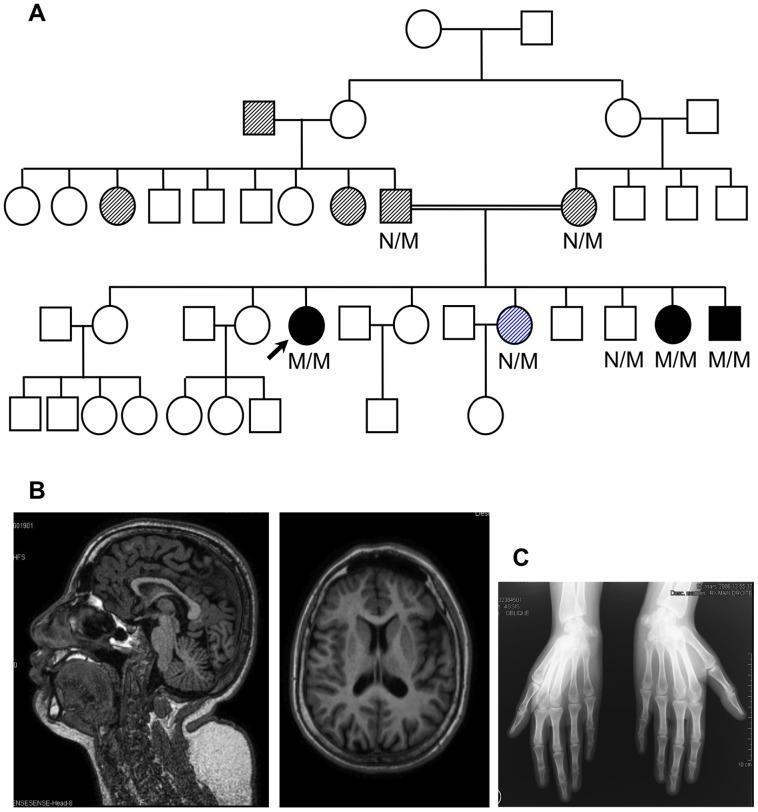
This composite educational figure consists of three panels representing a clinical case study of a genetic syndrome characterized by diabetes and microcephaly. Panel A is a pedigree diagram of a large consanguineous family. It illustrates an autosomal recessive inheritance pattern; affected individuals (black symbols) are homozygous (M/M) for a mutation, while carriers (hatched symbols) are heterozygous (N/M). Panel B presents T1-weighted MRI scans of the brain in sagittal and axial views. These images demonstrate primary microcephaly, showing a brain that is small for the patient's age but maintains normal anatomical architecture, including typical gyration and cortical folding patterns without gross malformations. Panel C is an anterior-posterior (AP) radiograph of both hands. The imaging shows normally shaped metacarpals and phalanges with an absence of epiphyseal dysplasia or significant skeletal deformities, illustrating that the clinical phenotype's growth abnormalities are primary to the central nervous system rather than generalized skeletal dysplasia. This figure is used to teach the clinical correlation between genetic variants (like TRMT10A) and multi-system neuro-metabolic disorders.
autosomal dominant inheritance pedigree family tree generations
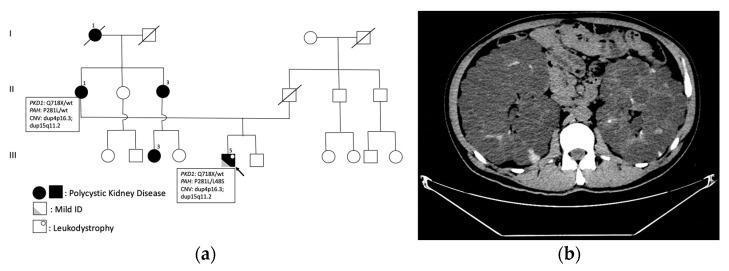
This composite educational figure illustrates the clinical and genetic presentation of Autosomal Dominant Polycystic Kidney Disease (ADPKD). Part (a) displays a multi-generational pedigree chart (family tree) demonstrating the autosomal dominant inheritance pattern of PKD. Black filled icons indicate family members affected by the disease; the proband is marked with an arrow and further labeled with specific genetic findings including PKD1 and PAH variants, and chromosomal microduplications. Part (b) is an axial non-contrast computed tomography (CT) scan of the abdomen. The image shows massive bilateral nephromegaly (enlarged kidneys) that occupy a significant portion of the abdominal cavity. The renal parenchyma is extensively replaced by numerous cystic formations. Several of these cysts exhibit hyperdense signals, which may suggest intracystic hemorrhage or high protein content. Additionally, multiple small cysts are visible within the liver parenchyma, consistent with a multi-organ manifestation of the disease. The image provides clinical evidence of severe polycystic changes in a patient with a family history of renal failure.
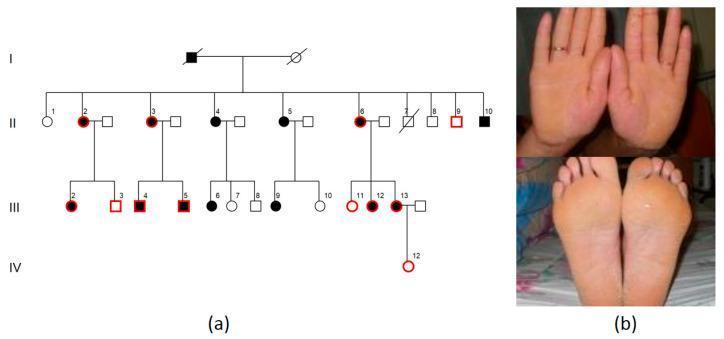
The visual content consists of two parts: a genetic pedigree (a) and clinical photographs (b). The pedigree charts an autosomal dominant inheritance pattern across four generations of a family affected by palmoplantar keratoderma (PPK), with black symbols representing affected individuals. The clinical photographs show the palms and soles of an affected patient. The skin exhibits diffuse, soft, yellowish hyperkeratosis spanning the entire surface of both palms and soles. Notable features include a smooth but thickened texture and evidence of keratolysis (breakdown of the keratin layer). The margins of the keratoderma lack a sharp demarcation line, showing a gradual transition to unaffected skin at the borders. There is no evidence of severe inflammatory erythema or deep fissuring in this specific manifestation. This visual is characteristic of diffuse palmoplantar keratoderma, an inherited skin disorder used for medical education in dermatology and clinical genetics to demonstrate phenotypic manifestations and pedigree analysis.
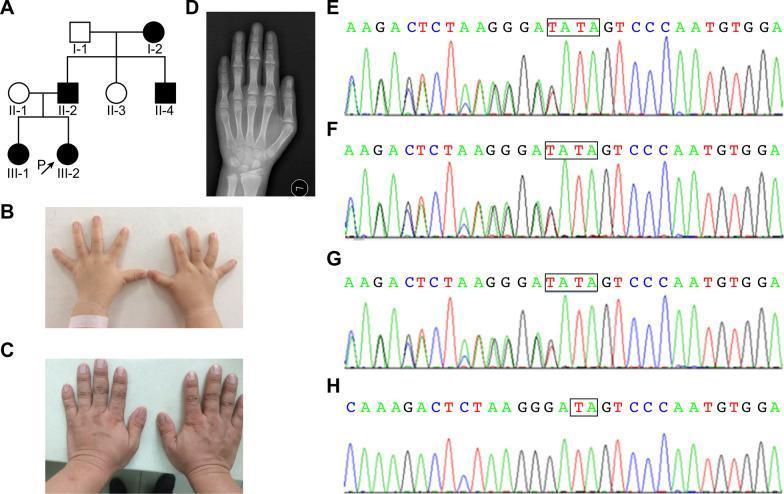
This composite educational graphic illustrates the clinical, genetic, and radiographic features of Trichorhinophalangeal Syndrome Type I (TRPS I) within a family pedigree. Panel A shows a multi-generational pedigree tree indicating an autosomal dominant inheritance pattern. Panels B and C are clinical photographs demonstrating brachydactyly, characterized by short, stubby hands and shortened fingers in both a child (proband) and an adult (father). Panel D is a posterior-anterior (PA) bone age radiograph of the hand, highlighting pathognomonic skeletal findings: cone-shaped epiphyses of the phalanges and shortening of the middle phalanges, particularly from the second to fifth digits. Panels E through H display Sanger sequencing chromatograms, identifying a TRPS1 gene mutation (c.2526_c.2527dupTA) in affected family members (E, F, G) compared to a normal sequence in the unaffected mother (H). This visual summary is designed for medical genetics and orthopedic education, focusing on the correlation between genotype and phenotype in skeletal dysplasias.
Mendelian Modes of Inheritance: Autosomal Diseases
1. Autosomal Dominant (AD) Inheritance
Core Concept
Molecular Mechanism
- Haploinsufficiency - one functional copy of the gene is not enough to maintain normal function (e.g., loss-of-function in a dosage-sensitive gene).
- Dominant negative / gain-of-function - the mutant protein actively interferes with the normal protein product (e.g., Marfan syndrome where a defective fibrillin-1 protein disrupts the entire extracellular matrix).
Pedigree Features (Rules to Recognize AD)
| Feature | Details |
|---|---|
| Vertical transmission | Disease appears in EVERY generation (parent → child → grandchild) |
| Male = Female | Both sexes affected equally |
| Risk for offspring | 50% if one parent is affected (heterozygous) |
| Unaffected members | Do NOT transmit the disease |
| No carrier state | You either have it or you don't |
Important Exceptions / Modifications
- Reduced penetrance: A person carries the pathogenic allele but does NOT show the disease (e.g., PRPF31-related retinitis pigmentosa). This can make a generation appear to "skip."
- Variable expressivity: All affected individuals carry the mutation but differ in disease severity (e.g., neurofibromatosis type 1 - some have only café-au-lait spots, others have tumors).
- New (de novo) mutations: If neither parent is affected, the child may carry a brand new mutation. This is common in severe AD conditions where affected individuals may not reproduce (e.g., achondroplasia - ~80% are de novo).
Classic Examples
- Huntington disease
- Marfan syndrome
- Achondroplasia
- Familial hypercholesterolemia
- Autosomal dominant polycystic kidney disease (ADPKD)
- Neurofibromatosis type 1 and 2
2. Autosomal Recessive (AR) Inheritance
Core Concept
- Homozygous (same pathogenic variant on both alleles), or
- Compound heterozygous (two different pathogenic variants, one on each allele).
Molecular Mechanism
Pedigree Features (Rules to Recognize AR)
| Feature | Details |
|---|---|
| Horizontal pattern | Affected individuals are in the same sibship, not across generations |
| Parents unaffected | Both parents are carriers (heterozygotes, genotype R/r) |
| Risk for offspring | 25% affected when both parents are carriers |
| Male = Female | Both sexes affected equally (same autosome) |
| Consanguinity | Increased risk - relatives share common ancestors and thus common alleles |
Carrier × Carrier Cross (Punnett Square)
        r           R
   ┌─────────┬─────────┐
r  │  r/r    │  R/r    │
   │ AFFECTED│ carrier │
   ├─────────┼─────────┤
R  │  R/r    │  R/R    │
   │ carrier │ normal  │
   └─────────┴─────────┘
Other Mating Combinations
| Parental Genotypes | Risk of Affected Child |
|---|---|
| Carrier × Carrier (R/r × R/r) | 25% |
| Carrier × Affected (R/r × r/r) | 50% |
| Affected × Affected (r/r × r/r) | 100% |
Sex-Influenced AR Disorders
- Hereditary hemochromatosis - AR, but 5-10x more common clinically in males (females are protected by menstrual iron loss).
Classic Examples
- Cystic fibrosis (CFTR gene)
- Phenylketonuria (PAH gene)
- Sickle cell disease (HBB gene)
- Thalassemias
- Congenital adrenal hyperplasia (CYP21A2 gene)
- Spinal muscular atrophy (SMN1 gene)
- Tay-Sachs disease
Head-to-Head Comparison
| Feature | Autosomal Dominant | Autosomal Recessive |
|---|---|---|
| Alleles needed for disease | ONE (heterozygote) | TWO (homozygote/compound het) |
| Carrier state | No (carriers are affected) | Yes (carriers are unaffected) |
| Pedigree pattern | Vertical (every generation) | Horizontal (same sibship) |
| Parents of affected child | At least one affected | Usually both unaffected carriers |
| Risk if one parent affected | 50% | 25% (if other parent is carrier) |
| De novo mutations | Common in severe disease | Rare |
| Consanguinity risk | Not affected | Strongly increases risk |
| Mechanism | Haploinsufficiency / dominant-negative | Loss of function |
| Sex ratio | M = F | M = F (with exceptions) |
Key Terms to Know
- Proband: The first affected family member who brings the family to medical attention.
- Penetrance: The proportion of individuals with the pathogenic genotype who actually show the phenotype. If 100% show it - complete penetrance. If only 80% do - 80% penetrance.
- Expressivity: The degree of severity of the disease among affected individuals.
- Obligate carrier: A person who MUST be a carrier based on pedigree analysis (e.g., an unaffected parent with two affected children).
By charts and images in easy manner
autosomal dominant inheritance pedigree chart pattern
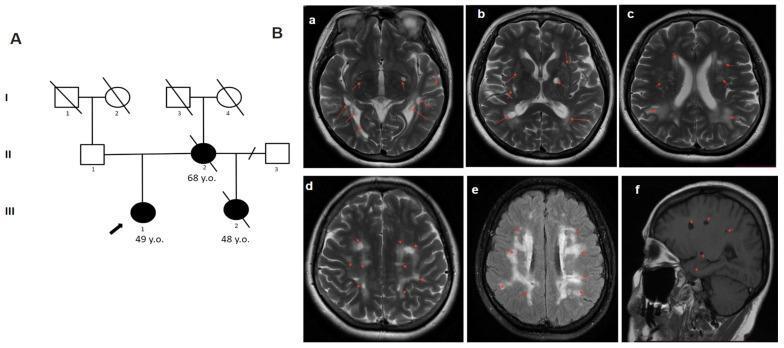
This composite educational image features a pedigree chart and neuroimaging findings consistent with Cerebral Autosomal Dominant Arteriopathy with Subcortical Infarcts and Leukoencephalopathy (CADASIL). Panel A presents a three-generation pedigree demonstrating an autosomal dominant inheritance pattern of a neurodegenerative condition. Panel B displays diagnostic brain MRI sequences, including T2-weighted axial sections (a-d), a FLAIR axial section (e), and a T1-weighted sagittal section (f). The imaging reveals extensive, bilateral, and often symmetrical white matter hyperintensities (WMH). Key findings include confluent hyperintensities in the periventricular and deep white matter, and multiple subcortical lacunar lesions marked by red arrows. Notable features include the involvement of the temporal lobes and external capsules, which are characteristic markers for CADASIL. The sagittal view demonstrates the vertical distribution of these lesions within the white matter. This visual is intended for clinical training in identifying hereditary small vessel diseases and understanding the correlation between genetic family history and characteristic radiological signatures of leukoencephalopathy.
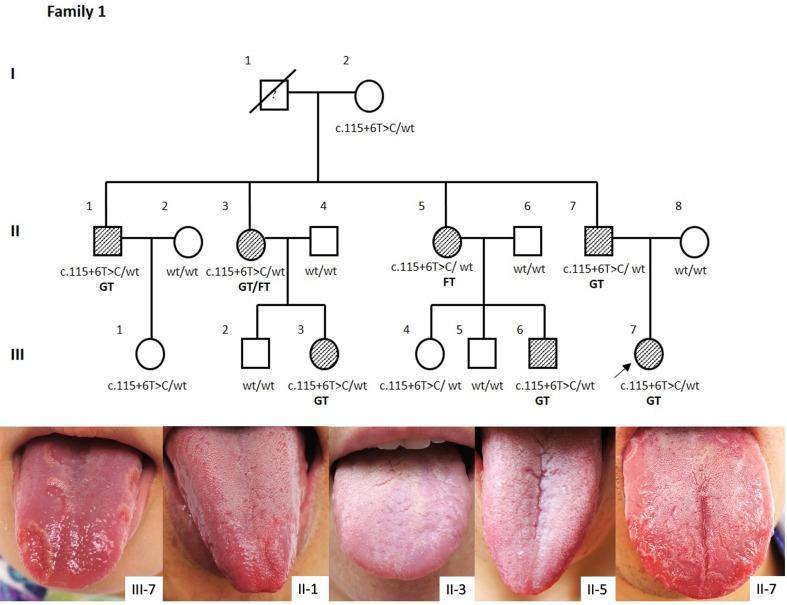
This medical visual combines a three-generation pedigree chart and clinical photographs depicting the inheritance and phenotypic expression of Geographic Tongue (GT) and Fissured Tongue (FT) in a Chinese Han family. The pedigree illustrates an autosomal dominant inheritance pattern associated with the IL36RN mutation (c.115+6T>C). Symbols are used to categorize severity: filled symbols indicate severe GT/FT, cross-hatched symbols indicate mild presentations, and open symbols denote clinical absence. The clinical photographs show phenotypic variability among five family members (III-7, II-1, II-3, II-5, II-7). Key visible features include: (III-7) severe geographic tongue with erythematous patches, white borders, and deep fissures; (II-5 and II-7) prominent midline longitudinal fissures and irregular lateral grooves; and (II-1 and II-3) milder forms of fissuring and varying degrees of lingual papillae atrophy. The composite demonstrates the clinical spectrum of 'GT alone'—a localized manifestation of IL-36 receptor antagonist deficiency—highlighting the correlation between IL36RN genotypes and tongue pathology.
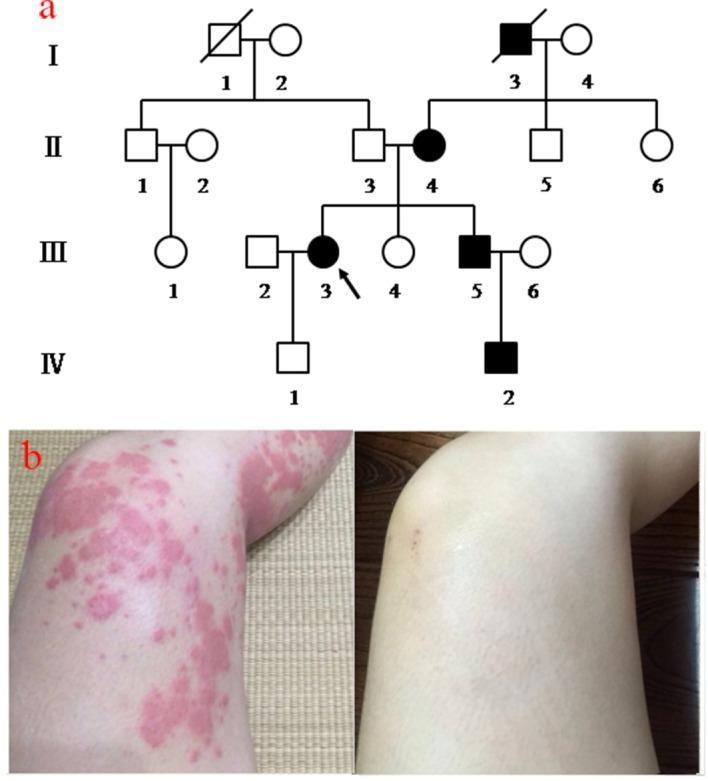
This composite educational image illustrates Familial Cold Autoinflammatory Syndrome (FCAS) through genetic and clinical data. Panel (a) presents a four-generation pedigree chart demonstrating an autosomal dominant inheritance pattern. Standard nomenclature is used: squares represent males, circles represent females, and black filled symbols denote individuals affected by FCAS. A diagonal line indicates deceased members, and the proband is identified with an arrow at III-3. Panel (b) provides a side-by-side clinical comparison of the patient's skin on the lower limbs. The left photograph shows cold-induced urticaria following 30 minutes of exposure to 4°C. The skin exhibits diffuse, erythematous, edematous plaques and papules (wheals) with irregular, coalescing borders across the knee and thigh. The right photograph shows the same anatomical region at room temperature, demonstrating complete resolution of the rash with normal skin texture and pigmentation. This visual supports the diagnosis of cold-induced urticarial-like rashes typical of NLRP12-related autoinflammatory disorders.
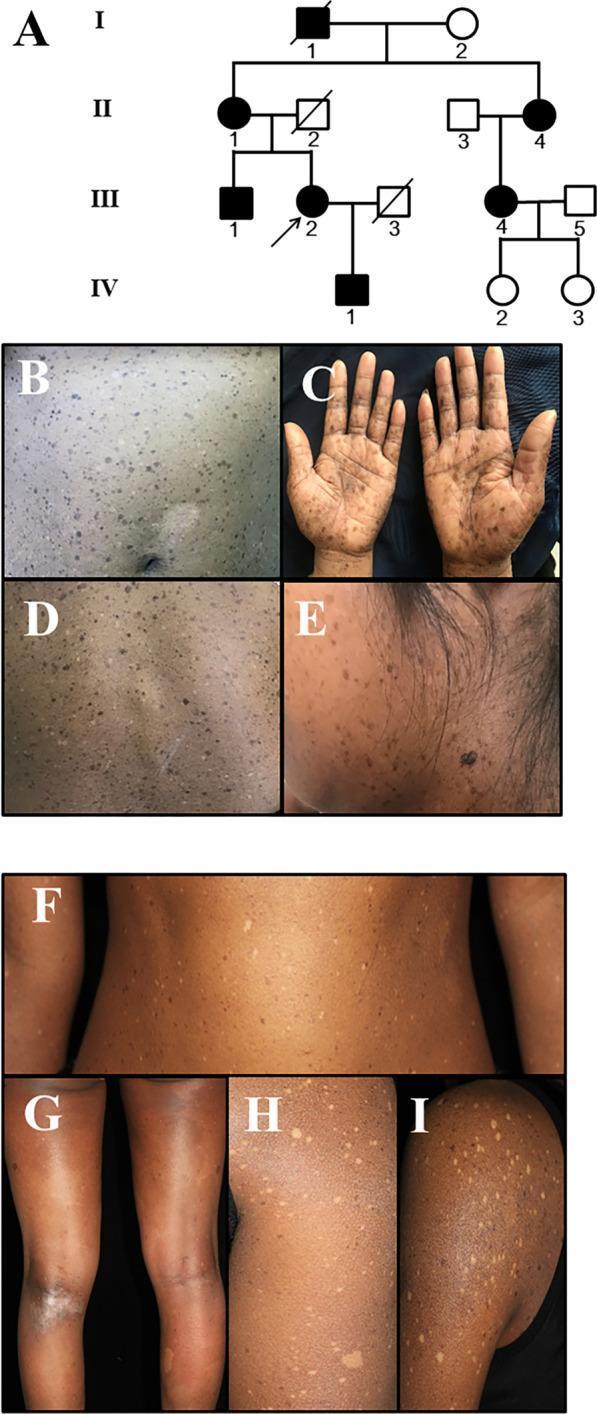
This composite educational image features a pedigree chart and clinical photographs illustrating Familial Progressive Hyper- and Hypopigmentation (FPHH). (A) A four-generation pedigree shows an autosomal dominant inheritance pattern. (B-I) Clinical photographs demonstrate a generalized, progressive pigmentary genodermatosis. The skin displays a distinctive intermixed pattern of hyperpigmented and hypopigmented lesions. Smaller macules (0.2–0.8 cm) are distributed across the face, neck, trunk, limbs, and palms (C), with larger, centimeter-scale irregular patches appearing on the trunk and extremities. The hyperpigmented areas present as dark brown lentigines and macules, while hypopigmented lesions appear as pale, depigmented spots. These findings are characteristic of mutations in the KITLG gene, which affect melanoblast migration and melanin synthesis. The image serves as a clinical reference for identifying mixed pigmentary disorders and understanding their genetic transmission in a medical genetics or dermatology context.
autosomal recessive inheritance pedigree carrier parents affected child
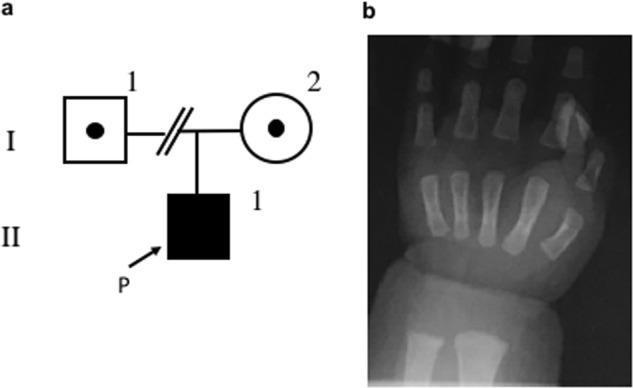
This composite educational graphic includes a family pedigree chart and a pediatric diagnostic radiogram. Panel A displays a pedigree indicating an autosomal recessive inheritance pattern; the proband (P) is an affected male (shaded square) born to carrier parents (dotted circle and square). Panel B is an anteroposterior (AP) roentgenogram of a pediatric hand and wrist. The primary diagnostic finding is significant metaphyseal cupping and fraying of the distal ulna. The skeletal structures, including the radius, carpal bones, metacarpals, and phalanges, exhibit generally reduced radiographic bone density (osteopenia). The visible cupping of the distal ulnar metaphysis is a hallmark sign of metabolic bone disease, typically associated with conditions such as rickets. This visual serves to illustrate the clinical manifestations of inherited metabolic disorders—specifically those affecting calcium, magnesium, or vitamin D homeostasis—leading to skeletal mineralization defects in early childhood.
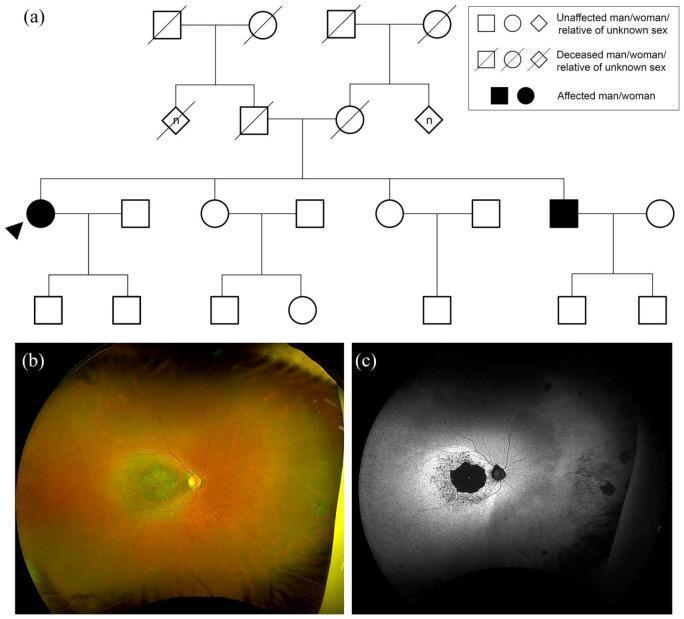
Educational medical composite illustrating autosomal recessive cone-rod dystrophy (CERKL variant). Panel (a) presents a four-generation pedigree chart demonstrating an autosomal recessive inheritance pattern; affected individuals (black symbols) appear in a single sibship from unaffected parents, highlighting the carrier status of ancestors. Panel (b) is a widefield color fundus photograph of the right eye, showing extensive macular atrophy characterized by a central zone of retinal pigment epithelium (RPE) thinning and pigmentary changes. Panel (c) displays widefield fundus autofluorescence (FAF) of the same eye, revealing a central, well-demarcated area of dense hypoautofluorescence (black) indicating RPE loss. This central atrophy is surrounded by a prominent ring of hyperautofluorescence, signifying metabolic stress or accumulation of lipofuscin in the transitioning retinal tissue. These visual findings are hallmark indicators of advanced retinal dystrophy and facilitate the correlation between genetic inheritance and clinical phenotype.
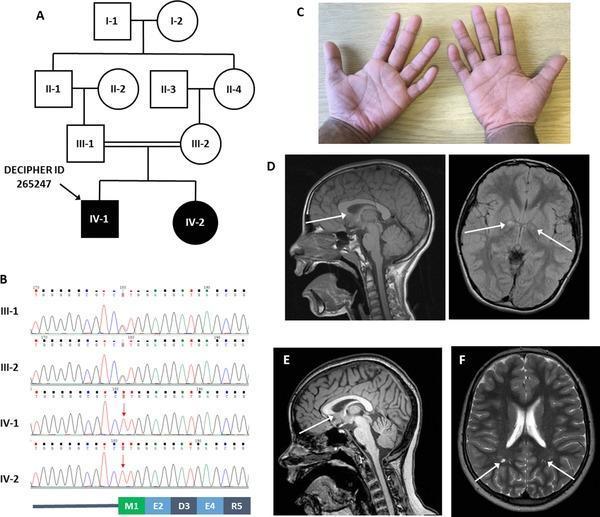
Multi-panel figure combining clinical genetics and neuroimaging. (A) Pedigree chart showing autosomal recessive inheritance in a consanguineous family. (B) Sanger sequencing chromatograms identifying a homozygous c.1A>T (p.Met1?) mutation in the PIGH gene for the affected siblings (IV-1, IV-2), with parents as heterozygous carriers. (C) Clinical photograph of an 8-year-old child's hands exhibiting bilateral clinodactyly of the fifth fingers. (D, E) Sagittal T1-weighted MRI images of the siblings showing mild dysplasia of the corpus callosum, specifically characterized by a truncated and slightly rounded appearance of the rostrum (white arrows). (D, right) Axial T2 FLAIR sequence showing hyperintense signals in the globus pallidi, more prominent on the right. (F) Axial T2-weighted MRI scan demonstrating bilateral, non-specific hyperintense foci in the deep white matter of the parietal regions (white arrows). The figure illustrates the clinical and molecular findings associated with PIGH-related glycosylphosphatidylinositol (GPI) anchor deficiency, categorized under clinical genetics and neuroradiology.
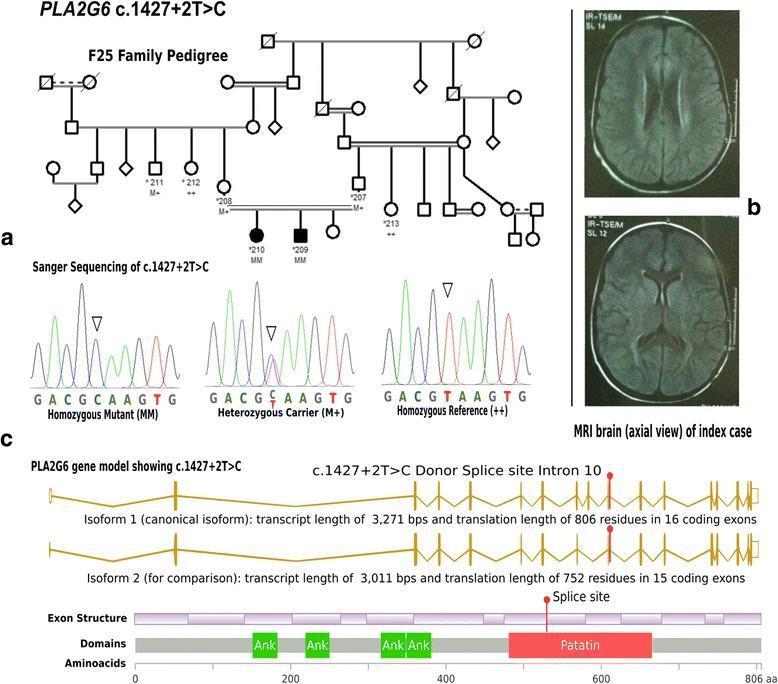
A multi-panel medical infographic detailing the genetic and clinical findings of Infantile Neuroaxonal Dystrophy (INAD) associated with a PLA2G6 mutation. Panel (a) presents a multi-generational pedigree chart (Family F25) demonstrating an autosomal recessive inheritance pattern. Affected individuals (represented by solid black symbols) correspond to the homozygous mutant (MM) genotype, while unaffected parents are heterozygous carriers (M+). Panel (b) displays two axial T2-weighted/FLAIR brain MRI slices of an index patient, showing bilateral, symmetrical hyperintense signal changes in the periventricular white matter, basal ganglia, and globus pallidus. Panel (c) includes Sanger sequencing chromatograms comparing homozygous mutant, heterozygous carrier, and homozygous reference genotypes at the c.1427+2T>C donor splice site. The bottom section provides a PLA2G6 gene model and protein domain map, illustrating the mutation's location at the intron 10 splice site relative to the Ankyrin (Ank) repeats and the Patatin-like phospholipase domain. The visual serves to correlate molecular genetics with neuroradiological manifestations in neurodegenerative disorders.
A clean medical genetics educational diagram showing Autosomal Dominant inheritance. Left side shows a pedigree chart with 3 generations: Generation I has one affected father (filled square) and unaffected mother (open circle). Generation II shows 4 children: 2 affected (1 filled square, 1 filled circle) and 2 unaffected (1 open square, 1 open circle). Generation III shows affected children from one of the affected Gen II individuals. Standard pedigree symbols used. Right side shows a Punnett square: Aa x aa cross giving Aa (affected), Aa (affected), aa (normal), aa (normal) - showing 50% risk. Key features labeled: "Every generation affected", "50% risk", "Male = Female". White background, bold clear labels, color-coded (red for affected).
A clean medical genetics educational diagram showing Autosomal Recessive inheritance. Left side shows a pedigree chart with 2 generations: Generation I has two unaffected carrier parents (squares and circles with a dot inside to show carrier status). Generation II shows 4 children: 1 affected child (filled symbol), 2 carriers (dotted symbols), 1 completely normal. Right side shows a Punnett square: Aa x Aa cross giving AA (normal 25%), Aa (carrier 50%), aa (affected 25%). Key features labeled: "Parents unaffected but carriers", "25% risk of affected child", "Horizontal pattern - siblings affected", "Consanguinity increases risk". White background, bold clear labels, blue color scheme for carriers, red for affected.
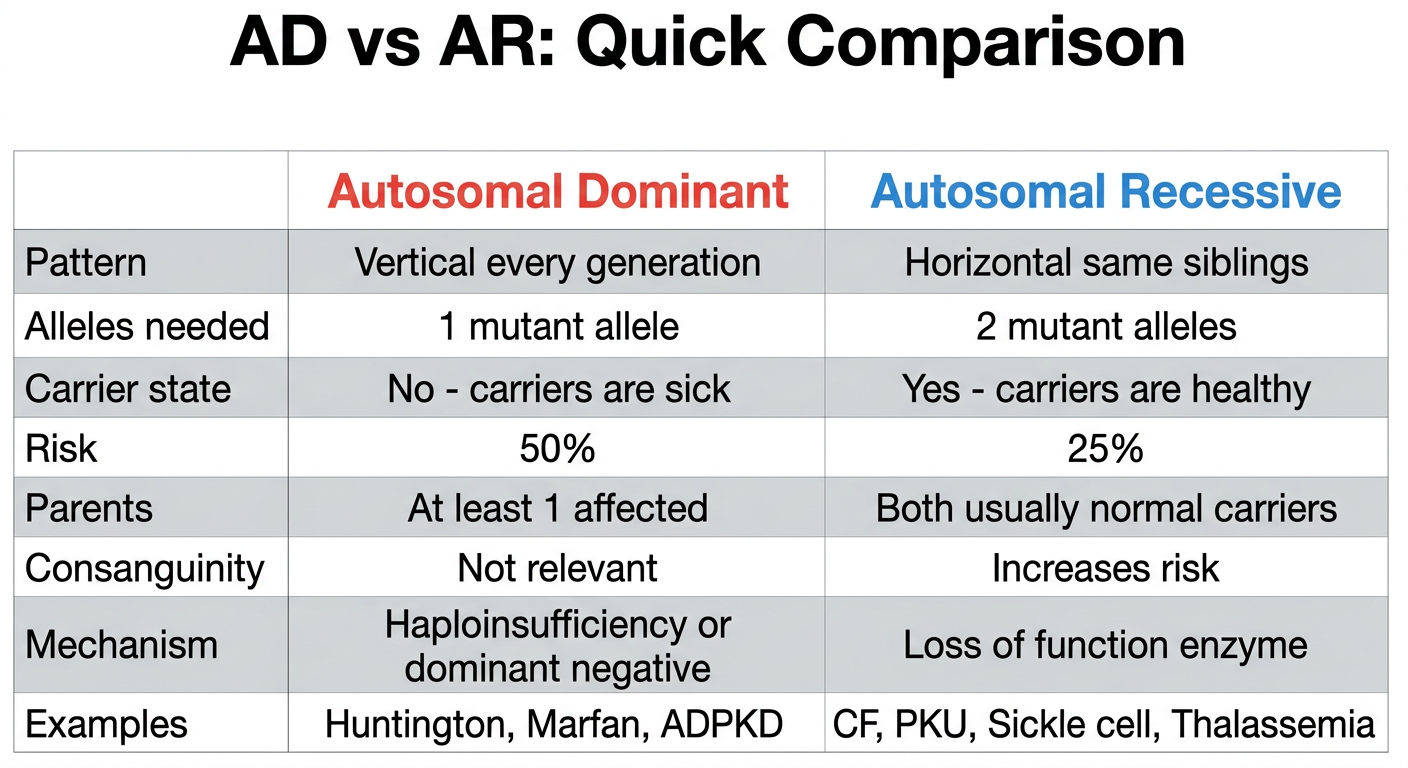
A clean medical education comparison table infographic titled "AD vs AR: Quick Comparison". Two columns side by side - left column header "Autosomal Dominant" in red, right column header "Autosomal Recessive" in blue. Rows compare: Pattern (Vertical every generation vs Horizontal same siblings), Alleles needed (1 mutant allele vs 2 mutant alleles), Carrier state (No - carriers are sick vs Yes - carriers are healthy), Risk (50% vs 25%), Parents (At least 1 affected vs Both usually normal carriers), Consanguinity (Not relevant vs Increases risk), Mechanism (Haploinsufficiency or dominant negative vs Loss of function enzyme), Examples row showing "Huntington, Marfan, ADPKD" vs "CF, PKU, Sickle cell, Thalassemia". Clean white background, large readable font, color coded rows alternating light gray and white.
Medical genetics educational infographic showing pedigree symbols legend and key concepts. Top section: Pedigree symbol legend showing - open square = unaffected male, filled square = affected male, open circle = unaffected female, filled circle = affected female, half-filled circle = carrier female, horizontal line = mating, vertical line = offspring, double horizontal line = consanguineous mating. Middle section: Two mini pedigrees side by side - one showing vertical transmission pattern labeled "Autosomal Dominant" and one showing horizontal siblings affected pattern labeled "Autosomal Recessive". Bottom section: Three key terms defined simply - Penetrance (having gene but not showing disease), Expressivity (different severity among affected), De novo mutation (new mutation, no family history). Clean colorful design, white background, educational poster style.
🧬 Mendelian Autosomal Inheritance - Visual Guide
📌 STEP 1 - Learn the Symbols First
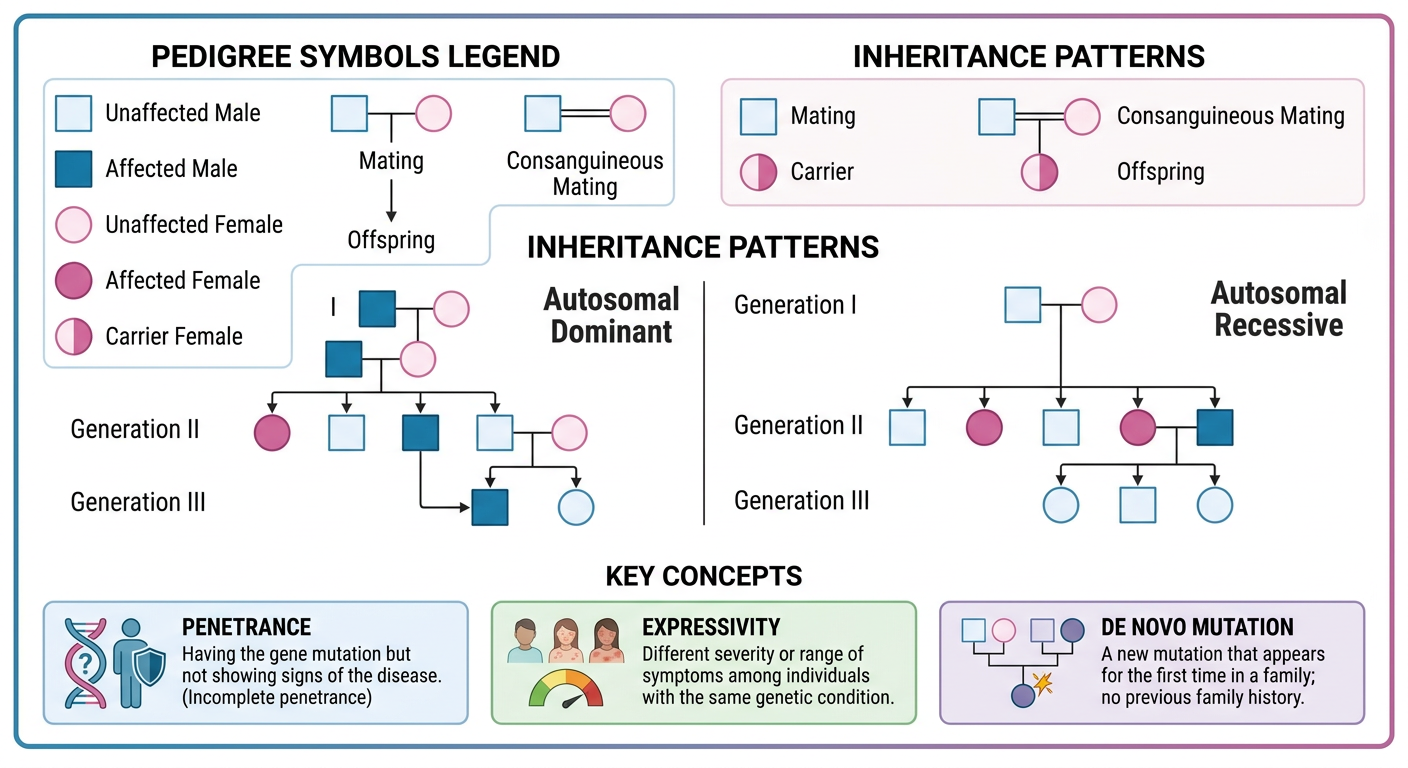
Memory tip: Squares = Males, Circles = Females. Filled = Affected. Half-filled = Carrier.
🔴 PART A: Autosomal Dominant (AD)
The Big Idea
ONE bad copy is enough to cause disease. The disease gene "dominates" over the normal one.
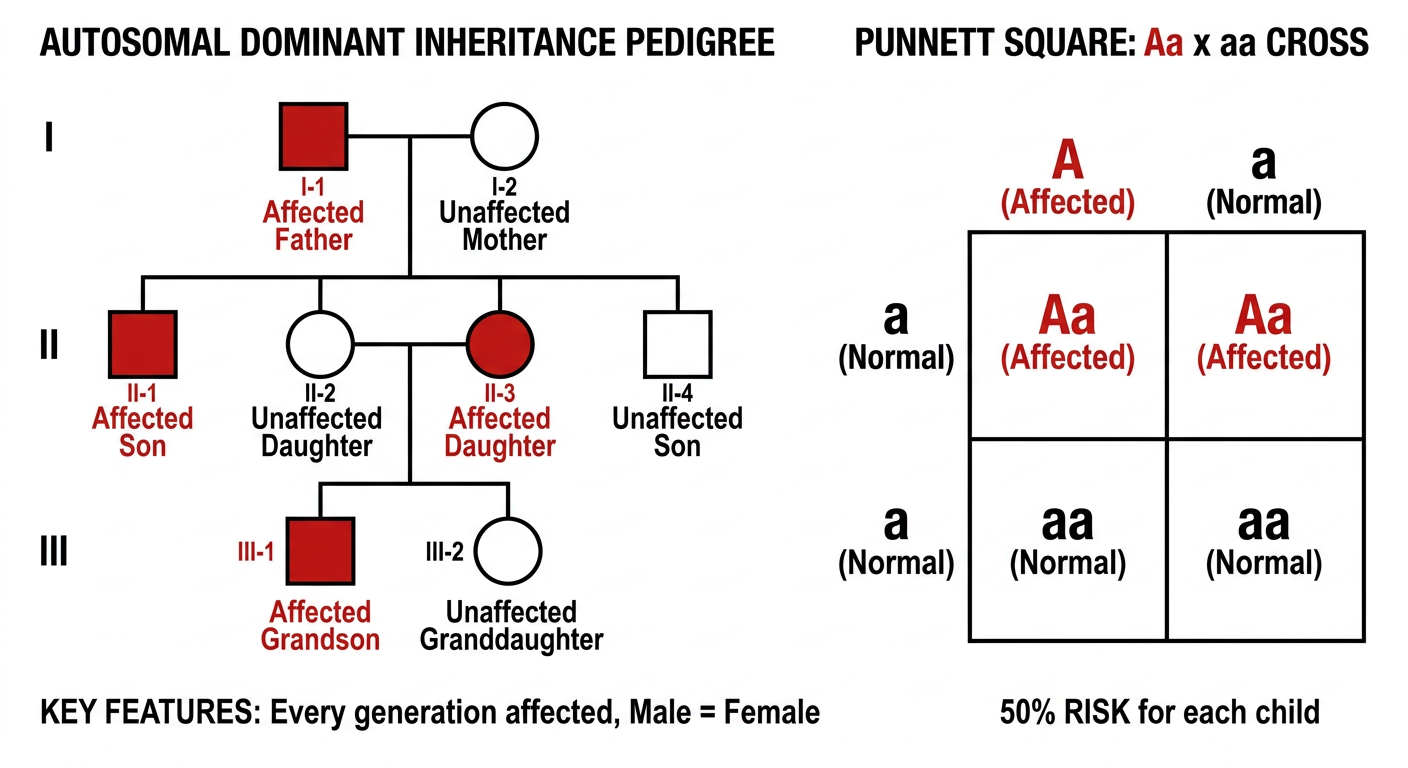
3 Things to Spot in a Pedigree ✅
✔ Disease appears in EVERY generation (vertical pattern - like a waterfall going down)
✔ Affected parent → 50% of children affected
✔ Unaffected children → CANNOT pass it on
Punnett Square (Affected Dad × Normal Mum)
         A (bad)      a (normal)
        ┌────────────┬────────────┐
a       │   Aa ❌    │   aa ✅    │
(normal)│  AFFECTED  │   NORMAL   │
        ├────────────┼────────────┤
a       │   Aa ❌    │   aa ✅    │
(normal)│  AFFECTED  │   NORMAL   │
        └────────────┴────────────┘
         2 affected : 2 normal = 50% risk
Real Pedigree Example (ADPKD - Polycystic Kidney Disease):
Classic AD Diseases
| Disease | Gene | Key Feature |
|---|---|---|
| Huntington disease | HTT | Late onset, neurodegeneration |
| Marfan syndrome | FBN1 | Tall, lens dislocation, aortic aneurysm |
| Achondroplasia | FGFR3 | Short limbs, large head |
| ADPKD | PKD1/PKD2 | Kidney cysts, hypertension |
| Familial hypercholesterolemia | LDLR | High LDL, early heart disease |
🔵 PART B: Autosomal Recessive (AR)
The Big Idea
BOTH copies must be bad to cause disease. One good copy is enough to stay healthy - but you become a silent carrier.
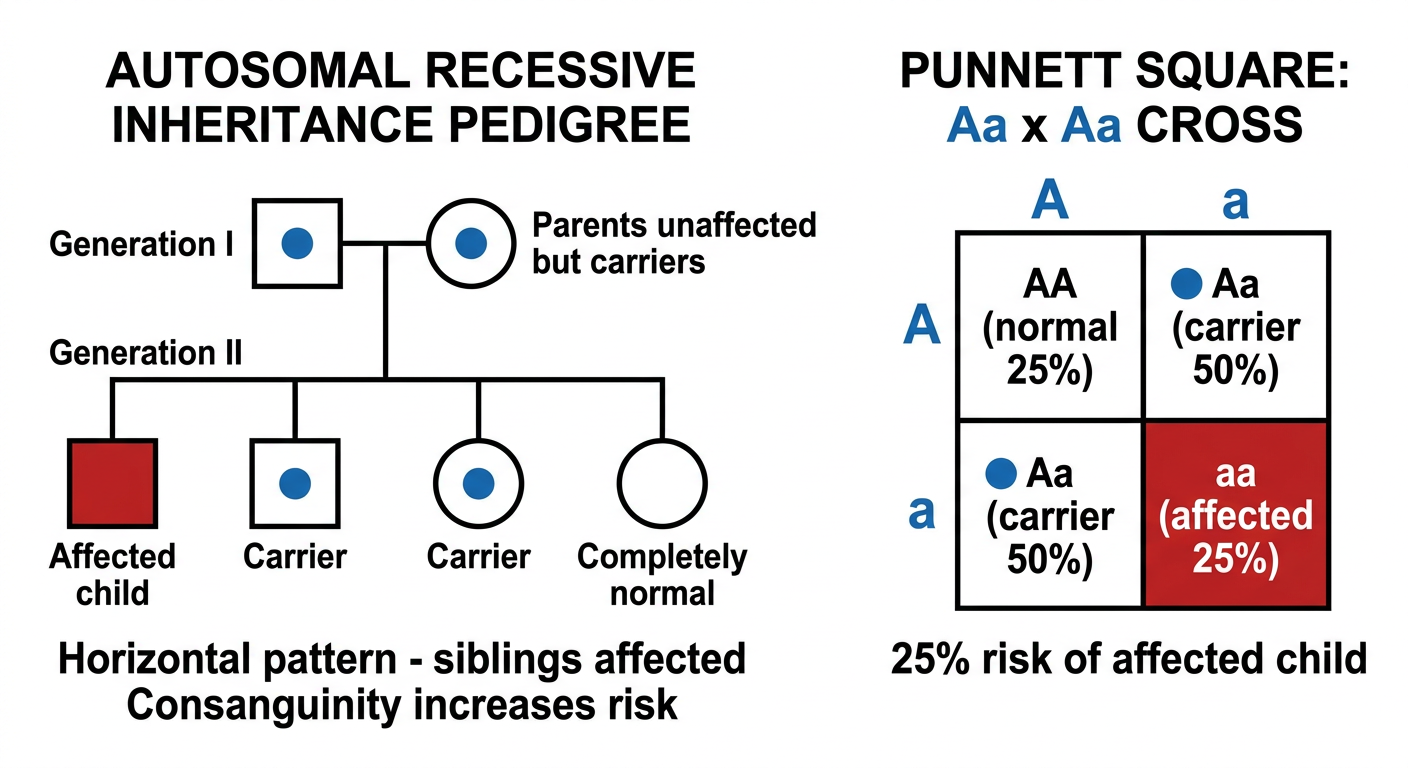
3 Things to Spot in a Pedigree ✅
✔ Disease appears in ONE generation only (horizontal pattern - siblings)
✔ Parents look NORMAL but are secret carriers
✔ Consanguinity (related parents) = BIG red flag
Punnett Square (Both Parents are Carriers)
         A (normal)    a (bad)
        ┌────────────┬────────────┐
A       │   AA ✅    │   Aa 🔵    │
(normal)│  NORMAL    │  CARRIER   │
        ├────────────┼────────────┤
a       │   Aa 🔵    │   aa ❌    │
(bad)   │  CARRIER   │  AFFECTED  │
        └────────────┴────────────┘
  25% Normal : 50% Carrier : 25% Affected
Risk Chart for Different Mating Combinations
| Parents | Risk of Affected Child |
|---|---|
| Carrier × Carrier | 25% |
| Carrier × Affected | 50% |
| Affected × Affected | 100% |
| Carrier × Normal | 0% affected (50% will be carriers) |
Real Pedigree Example (AR Rickets - carrier parents, affected child):
Classic AR Diseases
| Disease | Gene | Key Feature |
|---|---|---|
| Cystic fibrosis | CFTR | Thick mucus, lung/pancreas disease |
| Sickle cell disease | HBB | Abnormal hemoglobin, painful crises |
| PKU (Phenylketonuria) | PAH | Enzyme deficiency, intellectual disability if untreated |
| Thalassemia | HBA/HBB | Reduced hemoglobin production, anemia |
| Congenital adrenal hyperplasia | CYP21A2 | Enzyme block in cortisol pathway |
| Spinal muscular atrophy | SMN1 | Motor neuron degeneration |
⚡ PART C: Side-by-Side Comparison
🧠 PART D: Common Tricks & Exceptions
For Autosomal Dominant:
| Trick | Explanation |
|---|---|
| Reduced penetrance | Person has the gene but NO symptoms - looks like a "skip" in the pedigree |
| Variable expressivity | Same mutation → different severity in different family members |
| De novo mutation | New mutation - neither parent is affected. Common in severe AD disease |
For Autosomal Recessive:
| Trick | Explanation |
|---|---|
| Consanguinity | Related parents share ancestors → same rare allele → higher AR disease risk |
| Compound heterozygote | Two DIFFERENT bad alleles (one from each parent) - still gets AR disease |
| Carrier detection | Biochemical tests (enzyme assay) or DNA testing can find carriers |
🎯 Quick Memory Tricks
AD = "Dominant = Doesn't need a partner" → ONE bad allele enough
AR = "Recessive = Requires a partner"    → NEED TWO bad alleles

AD pedigree = VERTICAL (top to bottom, every generation)
AR pedigree = HORIZONTAL (left to right, within siblings only)

AD risk = 50% (flip of a coin)
AR risk  = 25% (1 in 4 chance)