
Guillian Barre syndrome clinical scores
"Guillain-Barre syndrome"[MeSH Terms] AND "clinical score" AND prognosis
"Guillain-Barre syndrome"[MeSH Terms] AND prognosis AND score
PMID: 37814552
Guillain Barre syndrome clinical scoring systems GBS disability scale Brighton criteria EGOS mEGOS EGRIS 2023 2024
https://gbs.tghn.org/clinical-guideline/prognosis-tools
Guillain-Barré Syndrome: Clinical Scoring Systems
1. Diagnostic Criteria
Asbury-Cornblath Criteria (Clinical Diagnosis)
- Progressive weakness of both legs and arms
- Areflexia or hyporeflexia
- Progression over days to 4 weeks
- Relative symmetry of symptoms and signs
- Mild sensory symptoms or signs
- Bifacial palsies
- Autonomic dysfunction
- Absence of fever at onset
- Recovery beginning 2-4 weeks after progression ceases
- Elevated CSF protein with <10 cells/µL (albuminocytological dissociation)
- Electrodiagnostic features of nerve conduction slowing or block
Brighton Criteria (Surveillance/Epidemiological Certainty Levels)
| Level | Criteria Met |
|---|---|
| 1 (Highest certainty) | Bilateral flaccid limb weakness + decreased/absent DTRs in weak limbs + monophasic course + albuminocytological dissociation + EMG consistent with GBS |
| 2 | Bilateral flaccid limb weakness + decreased/absent DTRs in weak limbs + monophasic course + either CSF or EMG consistent |
| 3 | Bilateral flaccid limb weakness + decreased/absent DTRs in weak limbs + monophasic course (without CSF or EMG) |
| 4 | Reported as GBS but not meeting levels 1-3 |
2. Disability / Functional Status Scores
Hughes GBS Disability Scale (GBS-DS)
| Score | Description |
|---|---|
| 0 | Healthy state |
| 1 | Minor symptoms, capable of running |
| 2 | Able to walk 10m or more without assistance, but unable to run |
| 3 | Able to walk 10m across open space with help |
| 4 | Bedridden or chairbound |
| 5 | Requiring assisted ventilation for at least part of the day |
| 6 | Dead |
MRC Sum Score
Overall Neuropathy Limitation Scale (ONLS)
3. Prognostic Scores: Respiratory Failure
EGRIS - Erasmus GBS Respiratory Insufficiency Score
| Measure | Category | Score |
|---|---|---|
| Days between onset of weakness and hospitalization | >7 days | 0 |
| 4-7 days | 1 | |
| ≤3 days | 2 | |
| Facial and/or bulbar weakness at hospitalization | Absent | 0 |
| Present | 1 | |
| MRC sum score at hospitalization | 60-51 | 0 |
| 50-41 | 1 | |
| 40-31 | 2 | |
| 30-21 | 3 | |
| ≤20 | 4 |
| EGRIS | Risk Category | Risk of Intubation |
|---|---|---|
| 0-2 | Low | ~4% |
| 3-4 | Intermediate | ~24% |
| 5-7 | High | ~65% |
- Patients with EGRIS 5-7 should be admitted to ICU for close observation.
- Internationally validated in 2022 (Doets et al., Ann Neurol).
mEGRIS - Modified Erasmus GBS Respiratory Insufficiency Score
- Vital capacity <20 mL/kg or declining 30% from baseline
- Maximal inspiratory pressure < -30 cm H₂O
- Maximal expiratory pressure <40 cm H₂O
| Major (1 criterion = intubate) | Minor (2 criteria = intubate) |
|---|---|
| PaCO₂ ≥48 mmHg | Ineffective cough |
| PaO₂ ≤56 mmHg | Impaired swallowing |
| VC <15 cc/kg | Atelectasis |
4. Prognostic Scores: Functional Outcome
EGOS - Erasmus GBS Outcome Score
| Variable | Options | Score |
|---|---|---|
| Age at onset | <40 years | 0 |
| ≥40 years | 1 | |
| Preceding diarrheal illness (past 4 weeks) | No | 0 |
| Yes | 1 | |
| GBS Disability Score at 2 weeks | 0-2 | 0 |
| 3 | 3 | |
| 4 | 6 | |
| 5 | 9 |
mEGOS - Modified Erasmus GBS Outcome Score
- Uses: age, preceding diarrheal illness, and MRC sum score (instead of GBS disability score)
- Validated internationally including in South Asian populations (Papri et al., 2022; Doets et al., Neurology 2022)
- The 2023 EAN/PNS guideline specifically recommends mEGOS for assessing functional outcome prognosis
Summary Table
| Score | Purpose | Timing | Key Variables |
|---|---|---|---|
| Hughes GBS-DS | Disability/functional status | Any time | Ambulation, ventilation need |
| MRC Sum Score | Muscle strength | Any time | 6 muscle groups, bilateral, 0-60 |
| Brighton Criteria | Diagnostic certainty | At diagnosis | CSF, EMG, clinical features |
| EGRIS | Respiratory failure risk | At admission | Days to admission, bulbar weakness, MRC |
| mEGRIS | Respiratory failure risk (simplified) | At admission | Simplified EGRIS - preferred by 2023 EAN/PNS guideline |
| EGOS | Functional outcome at 6 months | Day 14 of admission | Age, diarrhea, GBS-DS at 2 weeks |
| mEGOS | Functional outcome at 6 months (earlier) | Day 7 of admission | Age, diarrhea, MRC sum score |
2023 EAN/PNS Guideline Recommendations
- mEGOS to assess functional outcome prognosis
- mEGRIS to assess risk of requiring mechanical ventilation
- IVIg 0.4 g/kg for 5 days or plasma exchange for patients unable to walk unaided within 4 weeks of onset
- Gabapentinoids, TCAs, or carbamazepine for pain management
How to calculate MRC sum score in guillian Barre syndrome
MRC Medical Research Council muscle strength grading scale table
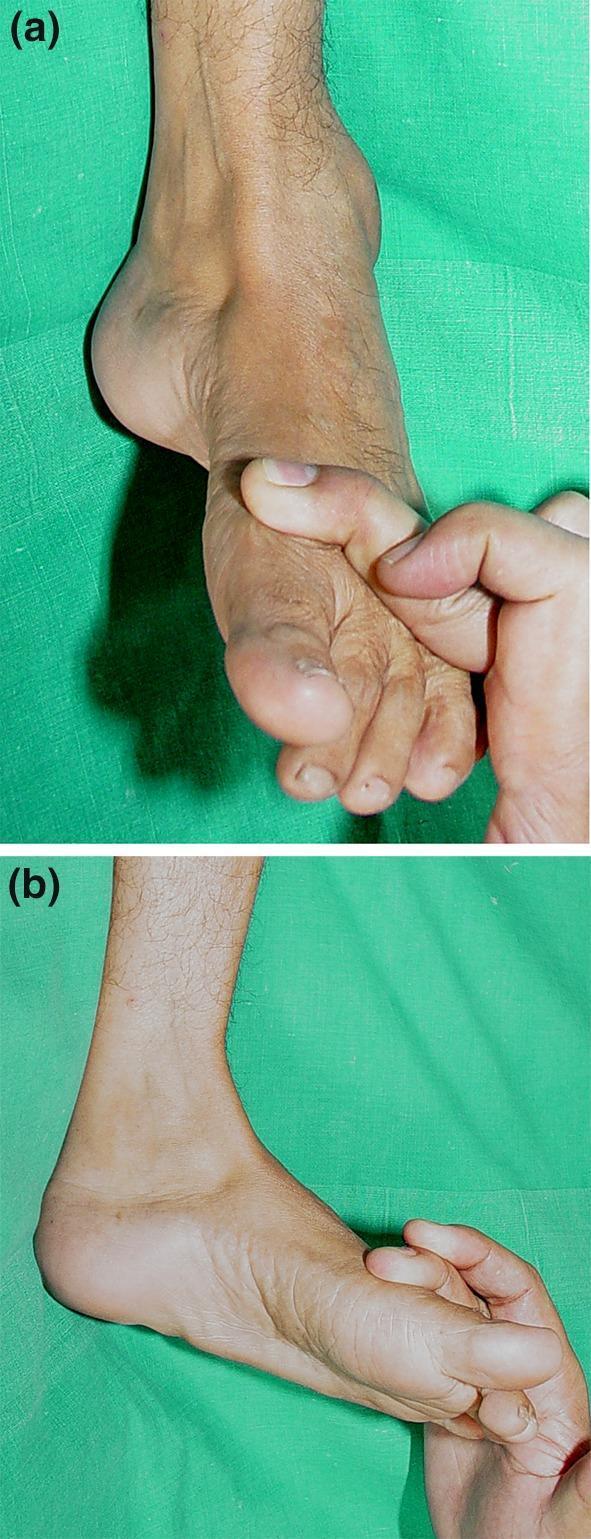
This composite clinical photograph demonstrates manual muscle testing (MMT) of the foot and ankle, typically performed to assess neurological or musculoskeletal impairment, such as in post-polio sequelae. Image (a) depicts the assessment of ankle dorsiflexor power. The clinician's hand applies downward resistance against the dorsal aspect of the forefoot and toes while the patient attempts to lift the foot, testing the tibialis anterior and extensor muscles. The foot shows a slight cavus arch. Image (b) demonstrates the testing of the foot invertors (primarily the tibialis posterior). The examiner applies lateral and eversional force against the medial border of the forefoot while the patient attempts to pull the foot inward (inversion). These clinical maneuvers are essential for grading muscle strength according to the Medical Research Council (MRC) scale, particularly when planning surgical interventions like tendon transfers or stabilizing arthrodesis to correct deformities such as equinovarus or calcaneocavovalgus.
A multi-panel medical graphic illustrating clinical course and diagnostic imaging of a spinal cord infarction. Panel A is a line graph and bar chart summarizing clinical events over 20 days post-symptom onset, tracking platelet count, D-dimer, Fibrinogen Degradation Products (FDP), and Medical Research Council (MRC) muscle strength scores. Panel B shows a coronal maximum intensity projection (MIP) reconstruction of a CT angiography (CTA) image of the thoracolumbar region. An arrow points to tandem narrowing of the artery of Adamkiewicz (Aka) at the T10-11 level. An inset curved multiplanar reformatted image displays the artery's continuity from the left T9-10 lumbar artery and aorta around the vertebral arch pedicle. Panel C presents a T2-weighted axial MRI of the spinal cord at the T9-11 level, demonstrating focal hyperintensity (edema) in the central gray matter. Red arrows highlight bilateral high signal intensity in the ventral horns, forming the characteristic 'owl's eyes sign,' which is highly suggestive of anterior spinal artery syndrome or spinal cord ischemia.
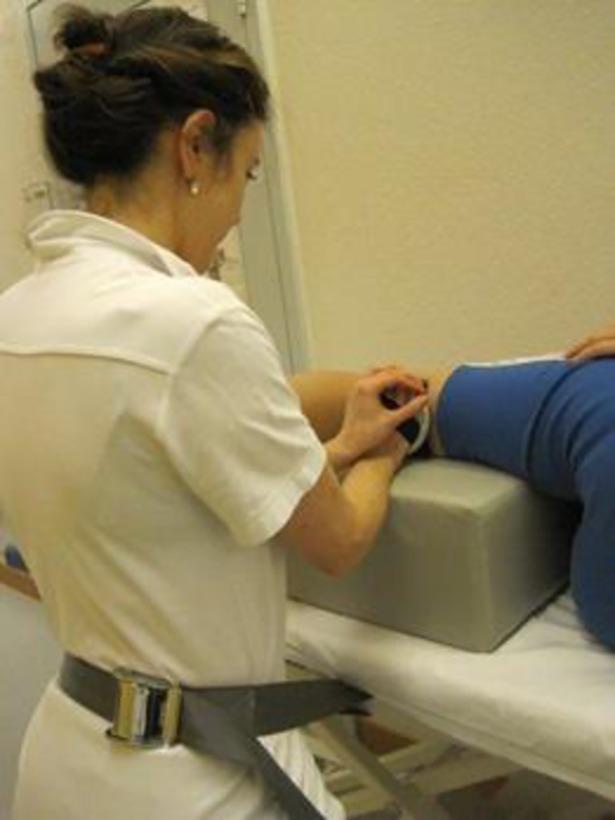
This clinical photograph demonstrates a standardized procedure for measuring muscle strength using hand-held dynamometry (HHD), specifically focusing on hip extension. The patient is positioned in a side-lying posture on a medical examination table. A large, grey rectangular support block is placed between the patient’s legs to maintain neutral alignment and provide stability for the upper limb during the assessment. The examiner, wearing a white uniform, is seen applying a hand-held dynamometer to the posterior aspect of the patient's lower leg, just proximal to the ankle joint. A notable technical feature shown is the use of a wide stabilization belt worn by the examiner around their waist and anchored to the table. This belt serves as a mechanical brace to counteract the force exerted by a strong patient, ensuring that the measurement reflects the patient's actual peak force rather than being limited by the physical strength of the tester. This procedural setup is indicative of clinical research or advanced physiotherapy protocols aimed at improving the reliability and validity of objective muscle strength testing.
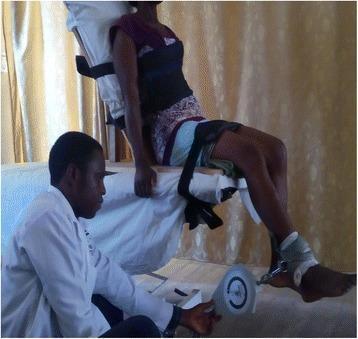
A clinical photograph depicting a participant undergoing static quadriceps muscle strength testing in a clinical or research setting. The individual is seated upright on a testing table with the back firmly supported against a vertical backrest. Safety and stabilization straps are visible across the chest and thighs to prevent compensatory movements. The participant's knees are positioned at the edge of the table, flexed at approximately 60 degrees. A cable tensiometer is attached to the participant's distal lower leg using a padded ankle cuff. This device measures isometric force (kg or Newtons) as the participant attempts to extend the knee against the resistance of the fixed cable. A clinician in a white lab coat is shown monitoring the tensiometer scale. This setup is typical for physical therapy assessments and rehabilitation research to evaluate quadriceps peak force and muscle function, particularly in the management of knee osteoarthritis or post-surgical recovery.
MRC Sum Score in Guillain-Barré Syndrome
The MRC Grading Scale (Per Individual Muscle)
| Grade | Description |
|---|---|
| 0 | No contraction at all |
| 1 | Flicker or trace of contraction, but no movement |
| 2 | Active movement possible, but only with gravity eliminated (limb can move sideways on flat surface) |
| 3 | Active movement against gravity, but not against added resistance |
| 4 | Active movement against gravity AND against some resistance (weaker than normal) |
| 5 | Normal strength - movement against gravity and full resistance |
The 6 Muscle Groups Tested (Each Side)
| # | Muscle Group | Movement Tested | Nerve Root |
|---|---|---|---|
| 1 | Shoulder abductors (deltoid) | Raise arm out to the side to 90° | C5 |
| 2 | Elbow flexors (biceps) | Bend the elbow against resistance | C5-C6 |
| 3 | Wrist extensors (extensor carpi radialis) | Cock the wrist back against resistance | C6-C7 |
| 4 | Hip flexors (iliopsoas) | Lift the thigh off the bed against resistance | L2-L3 |
| 5 | Knee extensors (quadriceps) | Straighten the knee against resistance | L3-L4 |
| 6 | Ankle dorsiflexors (tibialis anterior) | Pull the foot up against resistance | L4-L5 |
How to Calculate the Total Score
MRC Sum Score = Σ (6 muscles × left side) + Σ (6 muscles × right side)
              = max 30 + max 30 = 60 total
| Score | Meaning |
|---|---|
| 60 | Normal, full strength bilaterally |
| 51-59 | Mild weakness |
| 41-50 | Moderate weakness |
| 31-40 | Significant weakness |
| 21-30 | Severe weakness |
| ≤20 | Very severe - near complete paralysis |
How MRC Sum Score Is Used in GBS Clinical Scoring
In EGRIS (Respiratory Failure Prediction)
| MRC Sum Score | EGRIS Points |
|---|---|
| 60-51 | 0 |
| 50-41 | 1 |
| 40-31 | 2 |
| 30-21 | 3 |
| ≤20 | 4 |
In mEGOS (Functional Outcome Prediction at 1 Week)
Practical Tips for Bedside Testing
- Position matters - test in standard positions: sitting for upper limbs, supine for lower limbs.
- Gravity elimination - for grade 2 testing, position the limb in the horizontal plane (e.g., hip flexion tested with the patient on their side).
- Serial testing - repeat every 4-6 hours during the progressive phase to track deterioration.
- Symmetric assessment - always score both sides separately; GBS is usually symmetric but asymmetric forms exist.
- Pain limitation - GBS commonly causes severe radicular/limb pain (~70% of patients); this can confound testing - document if effort is pain-limited.
- Bulbar muscles are NOT included in the MRC sum score - they are assessed separately (facial/bulbar weakness is the second EGRIS variable).