
Fetal circulation
fetal circulation diagram placenta ductus arteriosus foramen ovale
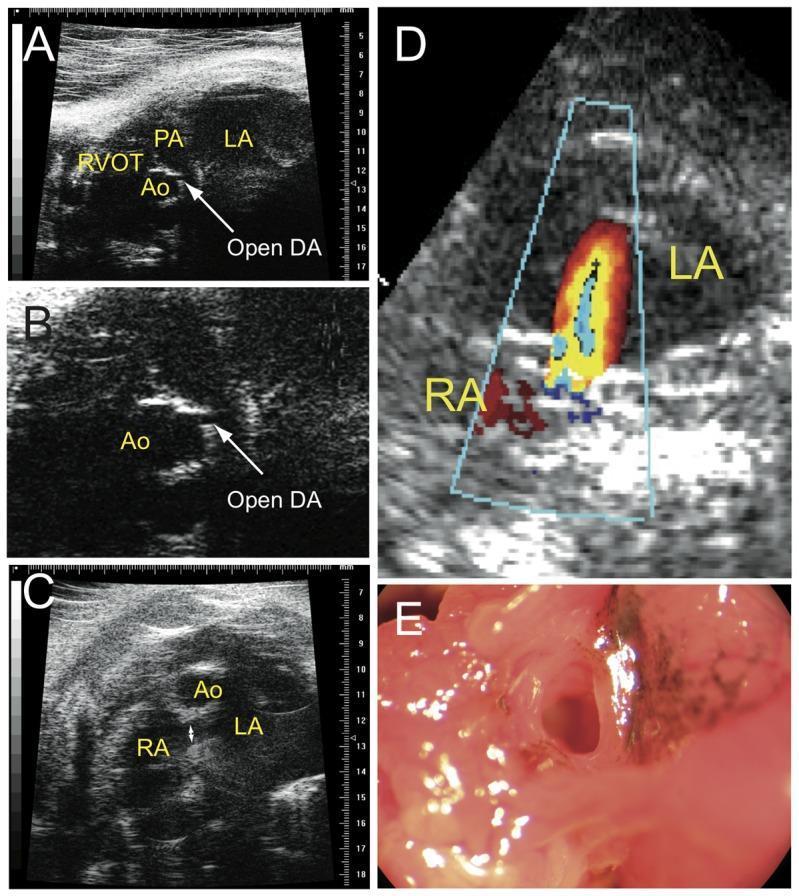
A multi-panel medical diagnostic and clinical series demonstrating congenital cardiovascular anomalies in a ctnnb1Δex3 model. Panels A and B are ultrasound images illustrating a Patent Ductus Arteriosus (PDA), with labels identifying the Left Atrium (LA), Aorta (Ao), Right Ventricle Outflow Tract (RVOT), and Pulmonary Artery (PA). An arrow points to the 'Open DA' (Ductus Arteriosus). Panel C provides an ultrasound view of the atrial septum with labels for the Right Atrium (RA), LA, and Ao, showing a patent foramen ovale. Panel D utilizes Color Doppler imaging to show a pathological right-to-left shunt of blood flow through the foramen ovale. Panel E is a clinical photograph of a dissected heart confirming the presence of an open foramen ovale, notable for the presence of dark pigmented cells (melanocytes) around the aperture. The collection demonstrates how failure of fetal cardiovascular shunts to close postnatally leads to abnormal circulation and chamber dilation.
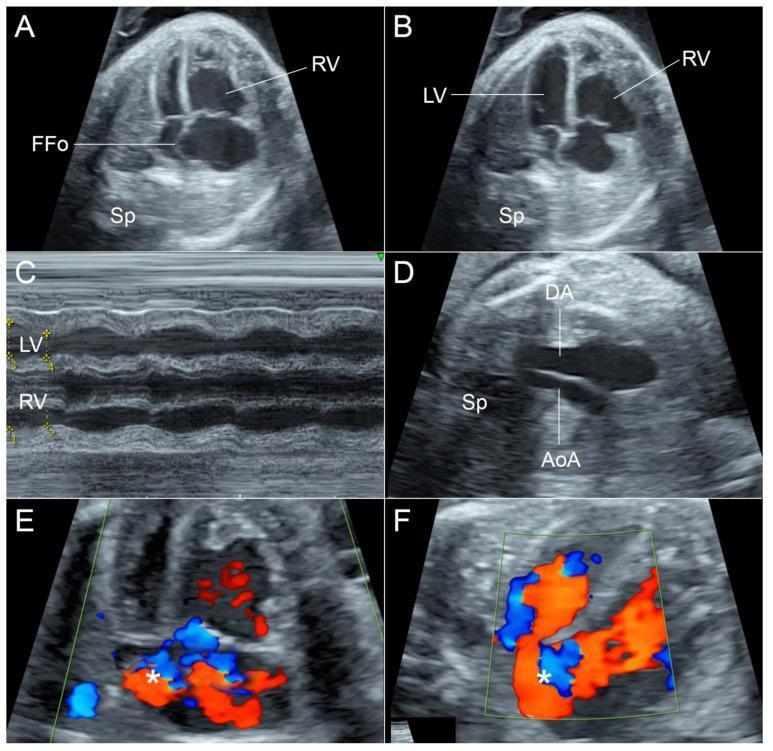
This composite figure presents a detailed fetal echocardiographic evaluation at 35 weeks of gestation. Panels A and B (four-chamber views) demonstrate significant chamber disproportion, with a dilated right ventricle (RV) compared to the left ventricle (LV). The flap of the foramen ovale (FFo) appears relatively fixed and exhibits tense bulging throughout both systole (A) and diastole (B). Panel C (M-mode) confirms impaired RV contractility, showing a reduced shortening fraction compared to the LV. Panel D (three-vessel and trachea view) reveals a hypoplastic aortic arch (AoA) in comparison to the larger ductus arteriosus (DA). Panels E and F utilize color Doppler imaging to illustrate abnormal hemodynamics at the interatrial septum, characterized by turbulent blood flow (marked with asterisks) and restricted passage across the foramen ovale. These findings are clinically significant for identifying secondary cardiac changes due to fetal anemia and altered preload conditions, emphasizing the assessment of the foramen ovale and ventricular function in high-risk pregnancies.
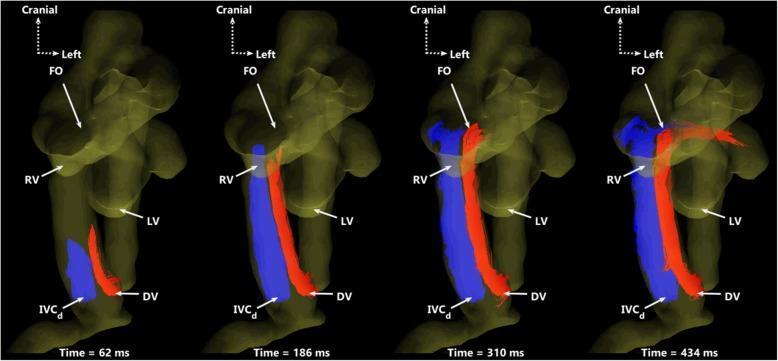
This diagnostic image series utilizes 4D flow MRI-derived particle tracing to illustrate fetal circulatory dynamics in a ventral view. The visualization demonstrates the preferential streaming of blood from two distinct venous sources over one cardiac cycle (62 ms, 186 ms, 310 ms, and 434 ms). Red particles represent blood from the ductus venosus (DV), while blue particles represent blood from the distal inferior vena cava (IVCd). The series highlights the maintenance of separate flow streams within the proximal inferior vena cava. The red DV stream is directed preferentially through the foramen ovale (FO) toward the left ventricle (LV) to supply oxygenated blood to the systemic circulation. Concurrently, the blue IVCd stream is routed primarily toward the right ventricle (RV) for delivery to the main pulmonary artery. Anatomical landmarks labeled include the ductus venosus (DV), distal inferior vena cava (IVCd), foramen ovale (FO), right ventricle (RV), and left ventricle (LV). This pedagogical tool illustrates the physiological shunting essential for fetal development and the minimal mixing of nutrient-rich and nutrient-poor blood streams.
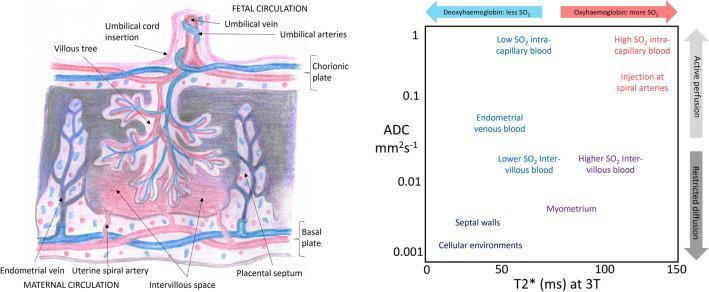
A composite medical illustration and graph depicting placental anatomy and related MRI biophysical properties. The left panel is a detailed anatomical diagram of a human placenta at approximately 32 weeks gestation. It illustrates the fetal circulation, including the umbilical cord (vein and arteries), chorionic plate, and the branching villous tree. The maternal circulation is shown via the basal plate, uterine spiral arteries, endometrial veins, and the intervillous space. The diagram highlights the proximity of maternal and fetal blood vessels at the exchange surface, separated by placental septa. The right panel is a bivariate plot used for diagnostic imaging analysis. The x-axis represents T2* relaxation time (ms) at 3T, a proxy for tissue oxygenation (SO2), ranging from deoxyhemoglobin to oxyhemoglobin. The y-axis represents the Apparent Diffusion Coefficient (ADC, mm²/s) on a logarithmic scale, indicating water mobility (restricted diffusion vs. active perfusion). Various placental tissue environments, such as septal walls, myometrium, and intervillous blood, are mapped onto the plot based on their specific oxygenation and diffusion characteristics, serving as a model for interpreting combined diffusion-relaxation MRI data.
Fetal Circulation
The Fetal Circulation Diagram
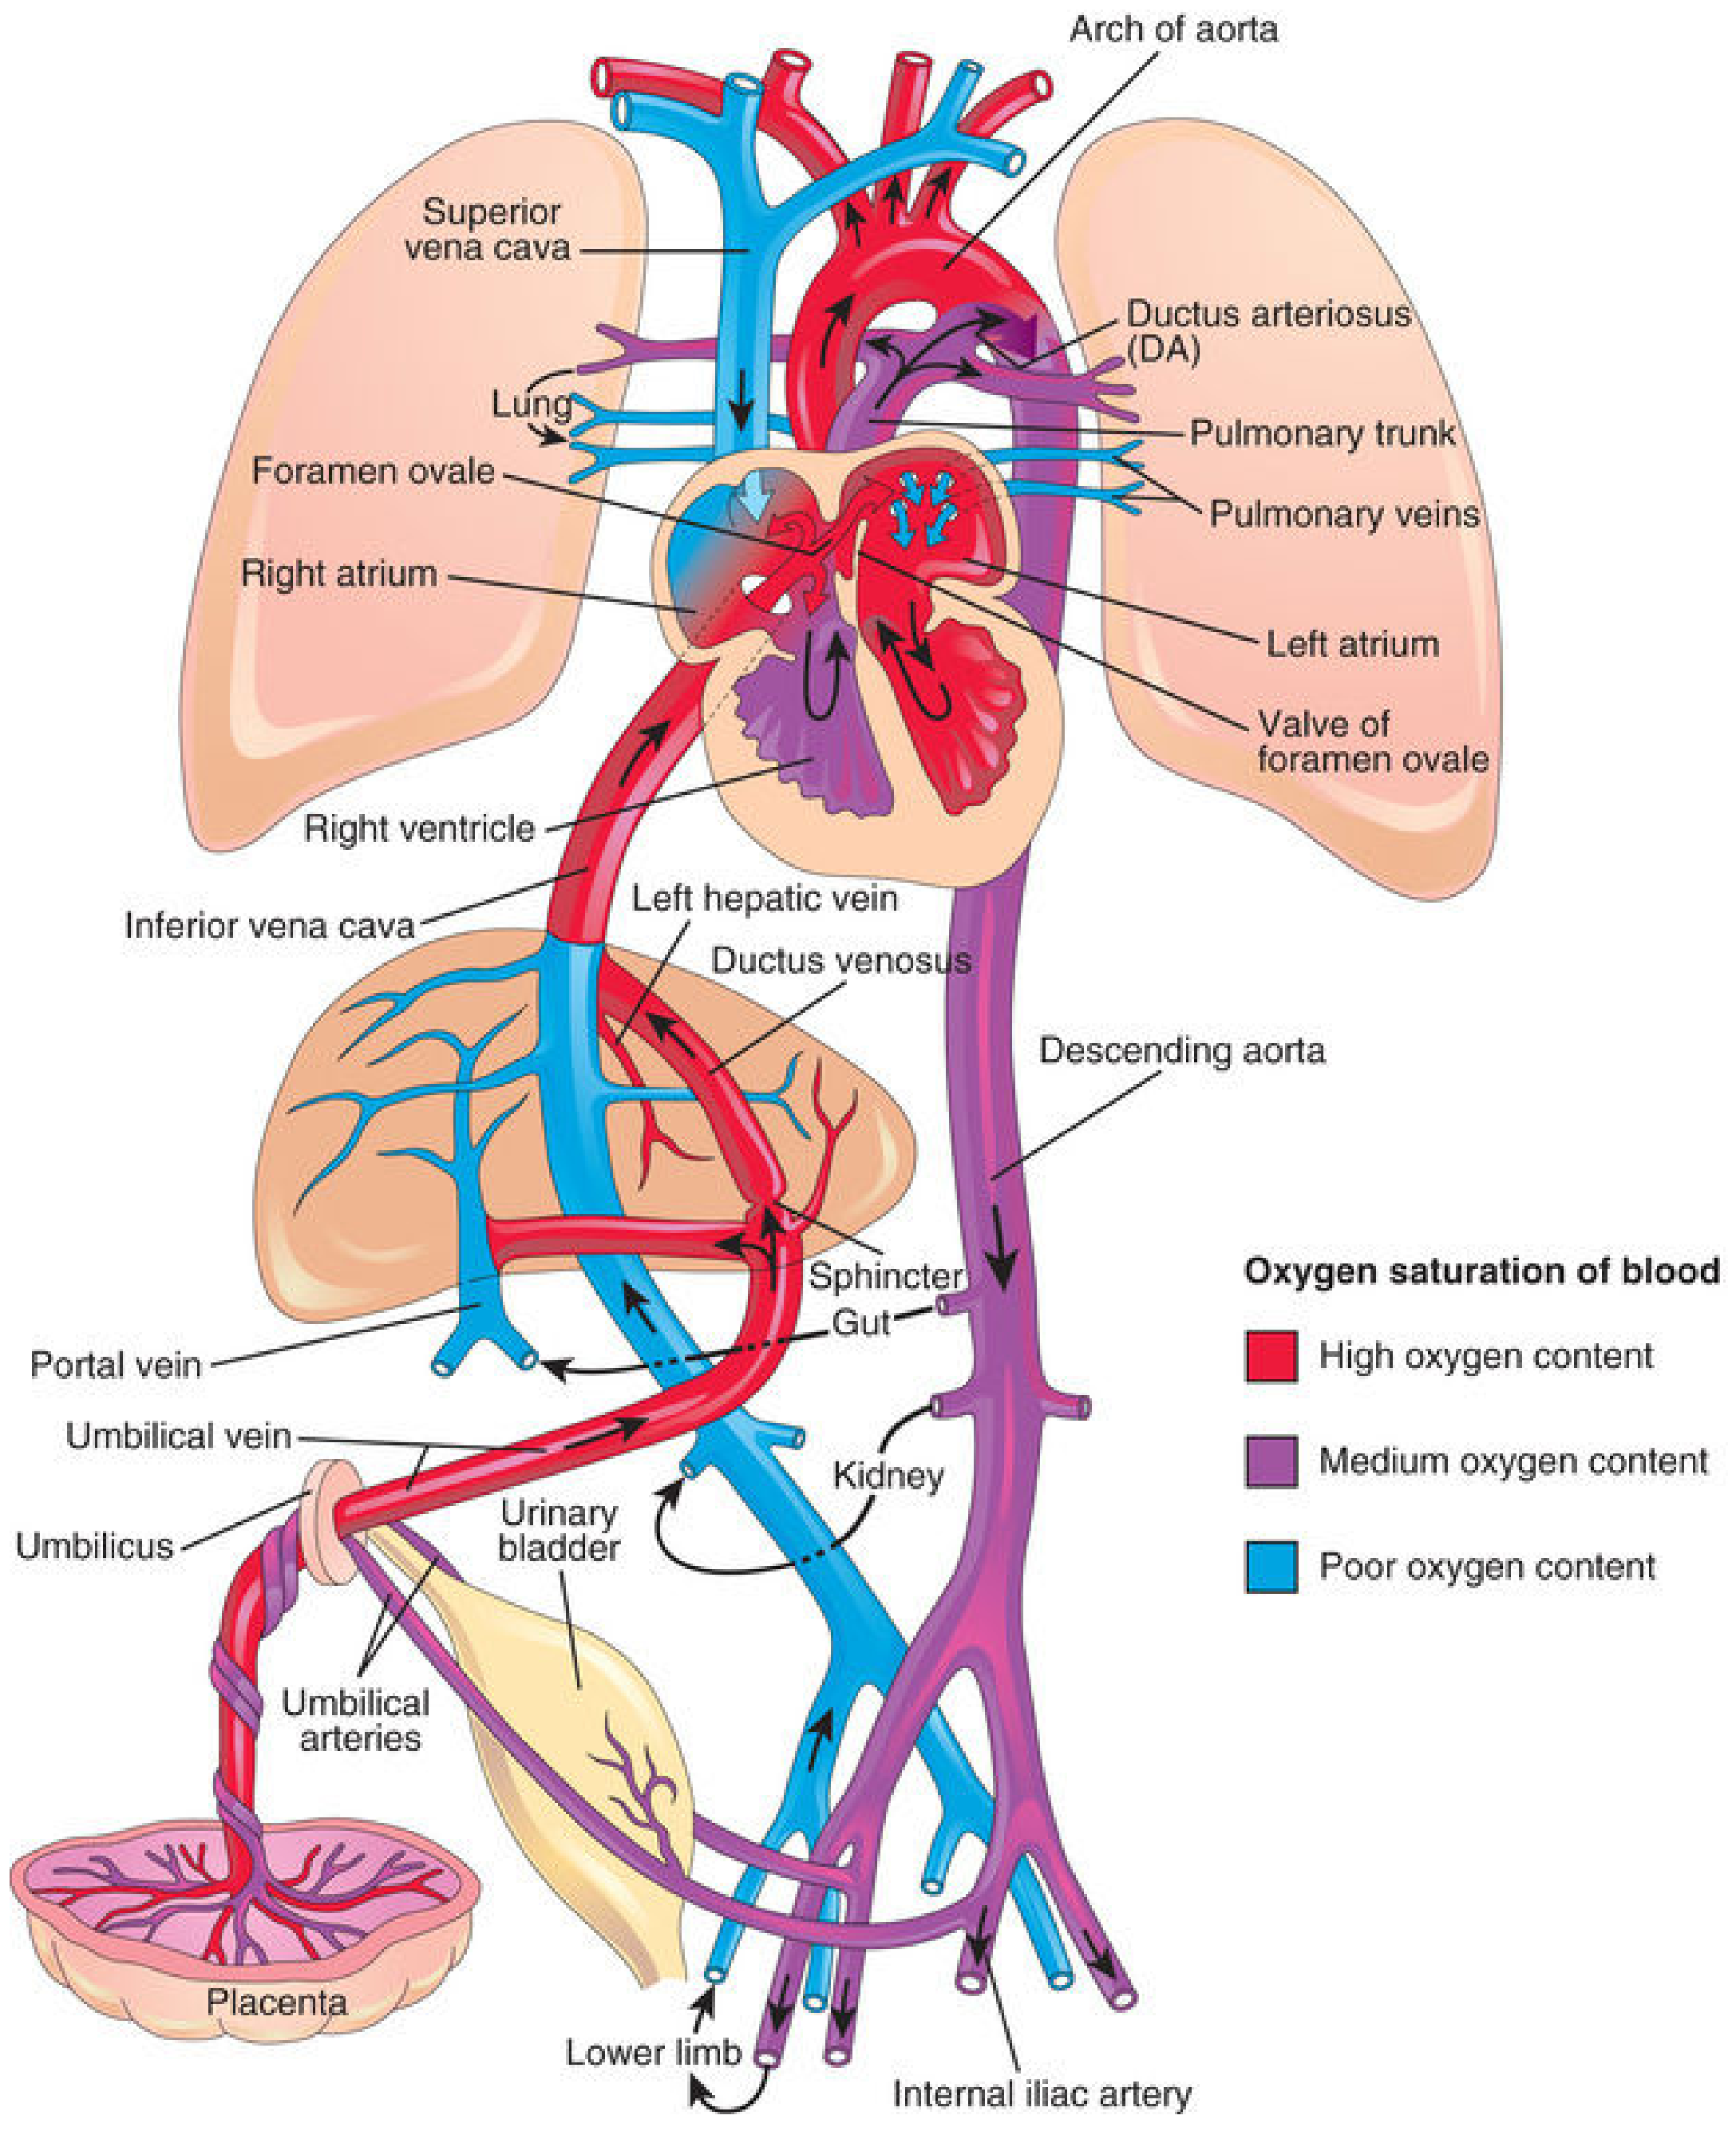
Step-by-Step Blood Flow
1. Placenta → Umbilical Vein
- The umbilical vein carries oxygenated, nutrient-rich blood (~80% O₂ saturation) from the placenta to the fetus under high pressure.
- It is the only fetal vessel that carries oxygenated blood.
2. Ductus Venosus (Shunt #1 - Liver Bypass)
- As the umbilical vein approaches the liver, approximately 50% of the blood passes directly into the ductus venosus, bypassing the liver and entering the inferior vena cava (IVC) directly.
- The remaining 50% enters the portal circulation and hepatic sinusoids, then drains into the IVC via the hepatic veins.
- A physiologic sphincter near the umbilical vein regulates this flow - it prevents cardiac overloading during high flow states (e.g., uterine contractions).
3. Inferior Vena Cava → Right Atrium
- Blood in the IVC is a mixture: well-oxygenated umbilical/hepatic blood mixes with poorly oxygenated blood from the lower limbs, kidneys, and pelvis.
- The IVC blood saturation at this point is approximately 67%.
4. Foramen Ovale (Shunt #2 - Lung Bypass, Right → Left Atrium)
- Blood entering the right atrium is directed by the crista dividens (inferior edge of the septum secundum).
- Most of the IVC blood passes directly through the foramen ovale into the left atrium.
- A small amount of IVC blood remains in the right atrium, where it mixes with poorly oxygenated blood from the superior vena cava (SVC) and coronary sinus.
5. Left Atrium → Left Ventricle → Ascending Aorta
- From the left atrium, blood passes to the left ventricle and out into the ascending aorta.
- This route delivers relatively well-oxygenated blood to the coronary arteries (heart) and carotid arteries (brain) - the body's most oxygen-demanding organs.
6. Right Atrium → Right Ventricle → Pulmonary Trunk
- The mixed blood that stays in the right atrium (from SVC + some IVC) passes into the right ventricle and out the pulmonary trunk.
- Pulmonary vascular resistance is high in fetal life (collapsed, fluid-filled lungs). Only ~10% of this blood reaches the lungs.
7. Ductus Arteriosus (Shunt #3 - Lung Bypass, Pulmonary Trunk → Aorta)
- ~90% of blood from the pulmonary trunk passes through the ductus arteriosus directly into the descending aorta, bypassing the lungs entirely.
- Pulmonary artery pressure in the fetus is slightly higher than aortic pressure, which drives this shunt.
- The ductus arteriosus also allows the right ventricle to strengthen and prepare for postnatal function.
8. Descending Aorta → Umbilical Arteries → Placenta
- Blood in the descending aorta is relatively deoxygenated (~60% saturation in umbilical arteries).
- 65% of descending aorta blood is returned to the placenta via the two umbilical arteries (branches of internal iliac arteries) for reoxygenation.
- The remaining 35% supplies the abdominal viscera and lower body.
Summary of the Three Fetal Shunts
| Shunt | Connection | Purpose |
|---|---|---|
| Ductus venosus | Umbilical vein → IVC | Bypasses the liver |
| Foramen ovale | Right atrium → Left atrium | Bypasses the lungs (atrial level) |
| Ductus arteriosus | Pulmonary trunk → Descending aorta | Bypasses the lungs (arterial level) |
Sites of O₂ Mixing (Blood Loses Purity)
- Liver - mixes with portal blood
- IVC - mixes with deoxygenated blood from lower limbs
- Right atrium - mixes with blood from head and arms (SVC)
- Left atrium - mixes with small amount of pulmonary venous return
- Descending aorta - where ductus arteriosus blood enters
Changes at Birth (Transitional Neonatal Circulation)
- Clamping of the umbilical cord stops placental blood flow → drops IVC and right atrial pressure.
- Lung expansion → dramatic fall in pulmonary vascular resistance → massive increase in pulmonary blood flow.
- Left atrial pressure rises (more pulmonary return) and right atrial pressure falls → the foramen ovale valve (septum primum) is pushed against septum secundum → functional closure of the foramen ovale.
- Ductus arteriosus: As pulmonary resistance drops below systemic resistance, flow reverses (aorta → pulmonary trunk). Rising arterial pO₂ stimulates muscular contraction of the ductus wall. Functional closure typically occurs within 24-48 hours (by 48 hours, ~82% are functionally closed; permanent anatomic closure by 3 weeks in most cases).
- Ductus venosus: Sphincter constricts at birth; undergoes fibrous obliteration over 2-3 months.
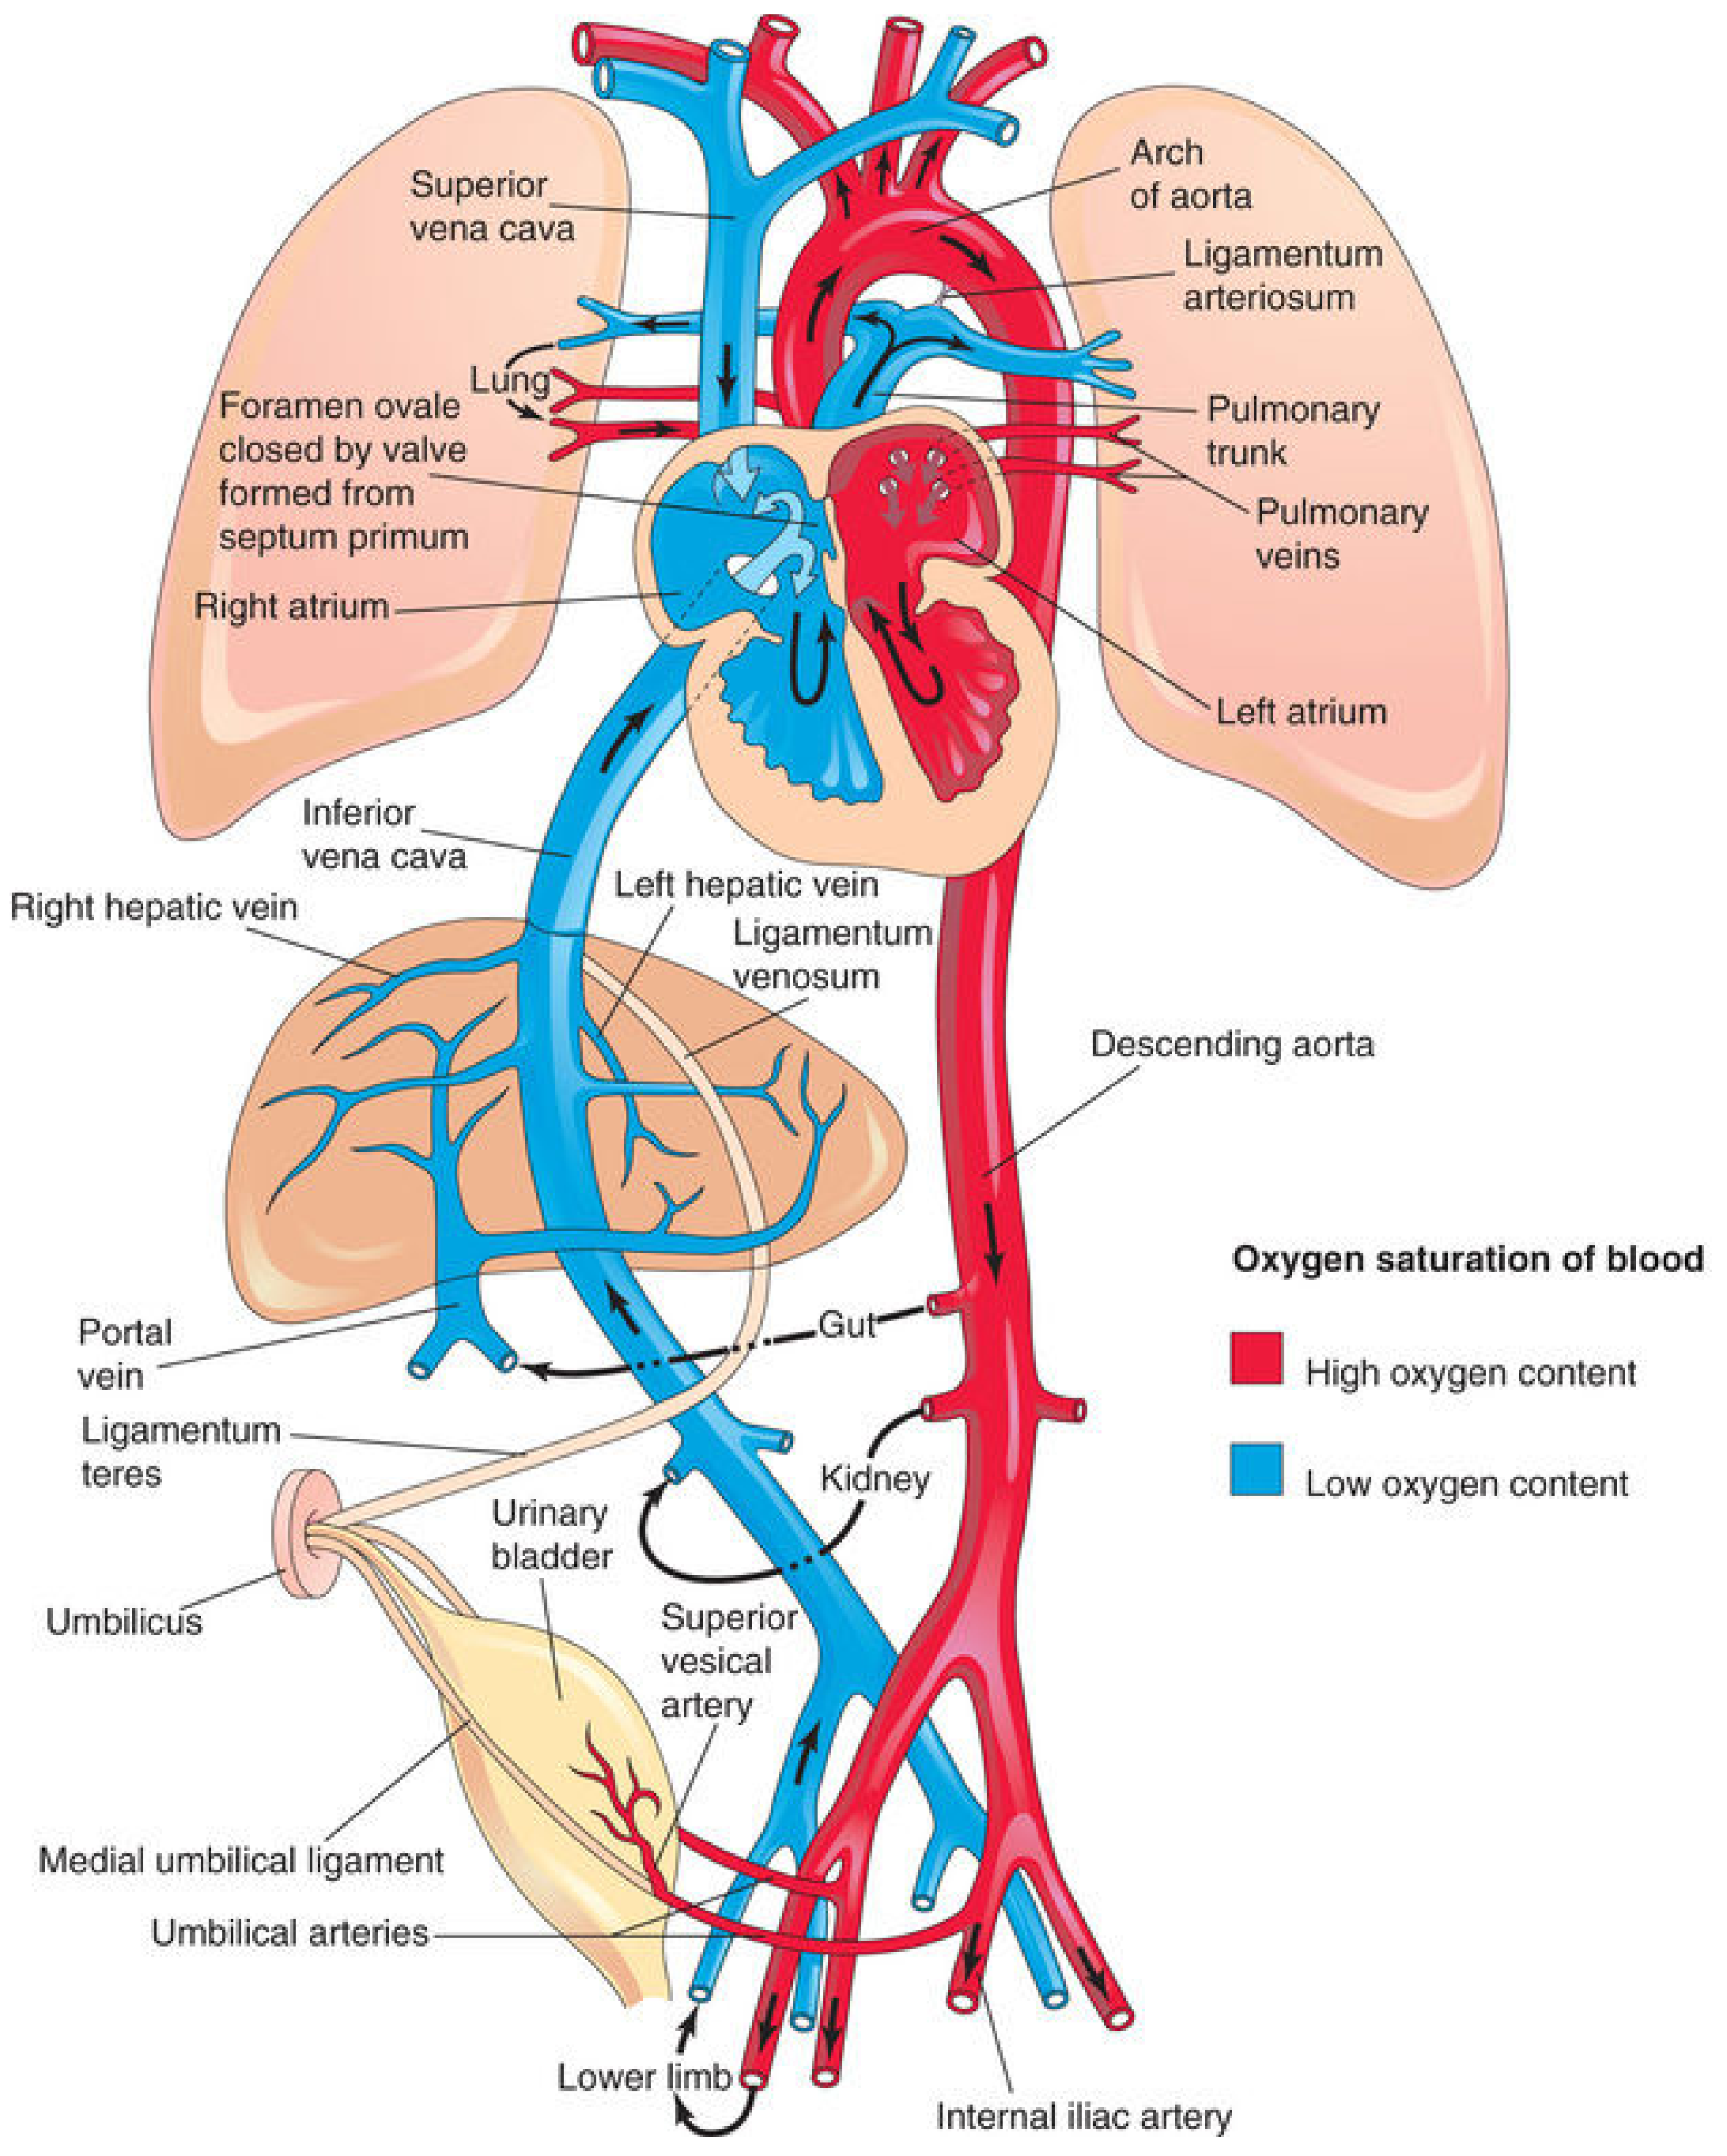
Adult Remnants of Fetal Structures
| Fetal Structure | Adult Remnant |
|---|---|
| Umbilical vein | Ligamentum teres (round ligament of liver) |
| Ductus venosus | Ligamentum venosum |
| Foramen ovale | Fossa ovalis |
| Ductus arteriosus | Ligamentum arteriosum |
| Umbilical arteries (proximal) | Superior vesical arteries |
| Umbilical arteries (distal) | Medial umbilical ligaments |
Key Physiological Features of Fetal Circulation
- Fetal Hb (HbF) has a higher O₂ affinity than adult HbA, with a left-shifted oxyhemoglobin dissociation curve. This allows HbF to extract more O₂ from maternal blood across the placenta even at the relatively low pO₂ of the placental sinuses.
- Right ventricular dominance: In the fetus, the right ventricle is thicker than the left (it works harder against pulmonary hypertension). By 1 month postnatal, the left ventricle becomes thicker due to the higher systemic resistance.
- Pulmonary vascular resistance is high in the fetus due to hypoxic vasoconstriction and the physical state of collapsed lungs.
- The umbilical vein is the only vessel in the fetal body carrying oxygenated blood (a notable exception to the adult rule that veins carry deoxygenated blood).
Congenital heart disease
congenital heart disease classification acyanotic cyanotic defects diagram
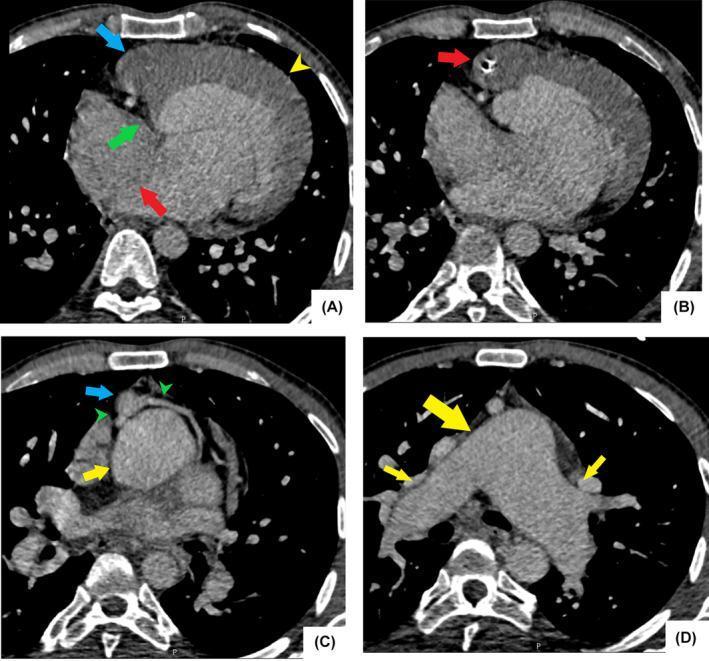
This diagnostic image consists of four axial cardiothoracic CT scan slices (A-D) demonstrating complex cyanotic congenital heart disease in an adult. Panel A (four-chamber view) shows tricuspid atresia, a hypoplastic right ventricle, a large atrial septal defect (ASD), and a significantly enlarged, hypertrophic left ventricle. Panel B identifies an atretic and calcified aortic valve originating from the hypoplastic right ventricle, consistent with levo-transposition of the great arteries (L-TGA). Panel C reveals a hypoplastic ascending aorta situated anteriorly to the main pulmonary artery, with evidence of normal coronary artery anatomy. Panel D illustrates significantly dilated central pulmonary arteries, a hallmark of secondary pulmonary hypertension. The series provides an educational overview of the structural remodeling and vascular changes associated with uncorrected tricuspid atresia Type IIc, including the specific spatial relationship of the great vessels and chambers. This content is suitable for advanced medical education in cardiology and radiology focusing on congenital heart defects and their late-stage clinical manifestations.
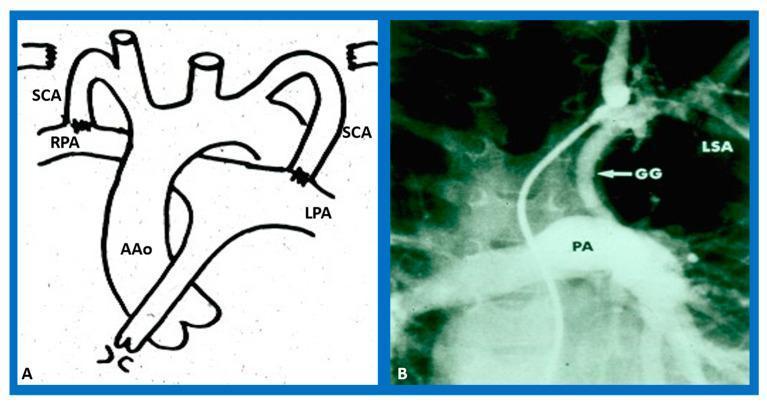
This composite educational image illustrates the concept and clinical application of a Blalock-Taussig (BT) shunt for congenital heart disease. Panel A is a historical anatomical diagram showing the surgical connection between the subclavian arteries (SCA) and the right and left pulmonary arteries (RPA, LPA) arising from the ascending aorta (AAo). This represents the classic palliative procedure intended to increase pulmonary blood flow. Panel B is a cineangiographic frame demonstrating a modified Blalock-Taussig anastomosis in a clinical setting. It shows a Gore-Tex graft (GG) connecting the left subclavian artery (LSA) to the pulmonary artery (PA). The angiography reveals a patent, wide-open anastomosis with robust contrast opacification of the pulmonary artery, confirming successful systemic-to-pulmonary shunting. This visual material is used to teach surgical management of cyanotic heart defects, such as Tetralogy of Fallot or pulmonary atresia, where increasing pulmonary perfusion is critical for patient stabilization.
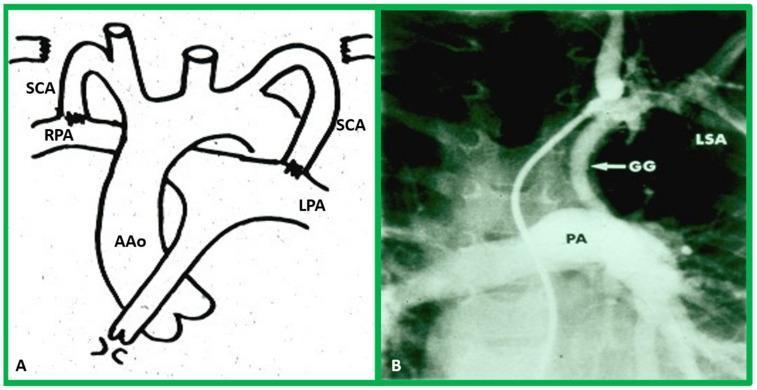
This dual-panel image illustrates surgical approaches for augmenting pulmonary blood flow in cyanotic heart disease. Panel A is a historical anatomical diagram showing the classic Blalock-Taussig shunt, depicting the end-to-side anastomosis of the subclavian arteries (SCA) to the right (RPA) and left (LPA) pulmonary arteries, respectively, branching from the ascending aorta (AAo). Panel B is a clinical diagnostic image consisting of a selective cine-angiogram frame demonstrating a modified Blalock-Taussig (mBT) shunt. It shows a tubular, radio-opaque Gore-Tex graft (GG) originating from the region of the left subclavian artery (LSA) and connecting inferiorly to a widely patent pulmonary artery (PA). This comparison highlights the evolution from direct arterial anastomosis to the use of synthetic interposition grafts to increase pulmonary perfusion. The material is relevant for pediatric cardiology and cardiothoracic surgery education regarding palliative procedures for complex congenital heart defects.
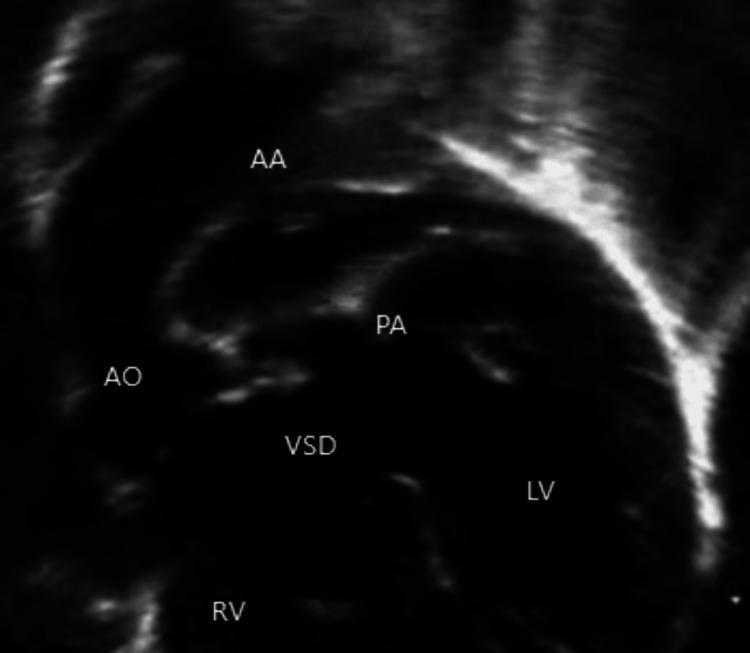
A grayscale two-dimensional (2D) echocardiogram image illustrating complex congenital heart disease anatomy, specifically Tetralogy of Fallot (TOF) associated with pulmonary atresia and a patent ductus arteriosus (PDA). The image shows the aortic arch (AA) superiorly and the descending aorta (AO). Key cardiac structures are labeled, including the right ventricle (RV), left ventricle (LV), and a prominent ventricular septal defect (VSD) indicating an interventricular communication. The pulmonary artery (PA) is visualized originating from the undersurface of the aortic arch, characteristic of ductal-dependent pulmonary circulation in the setting of pulmonary atresia. This diagnostic image demonstrates the spatial relationships between the great vessels and the ventricles required for the clinical management of cyanotic congenital heart defects in pediatric patients. Labels present: AA (Aortic Arch), AO (Aorta), PA (Pulmonary Artery), VSD (Ventricular Septal Defect), LV (Left Ventricle), and RV (Right Ventricle).
Tetralogy of Fallot four components VSD pulmonary stenosis right ventricular hypertrophy overriding aorta
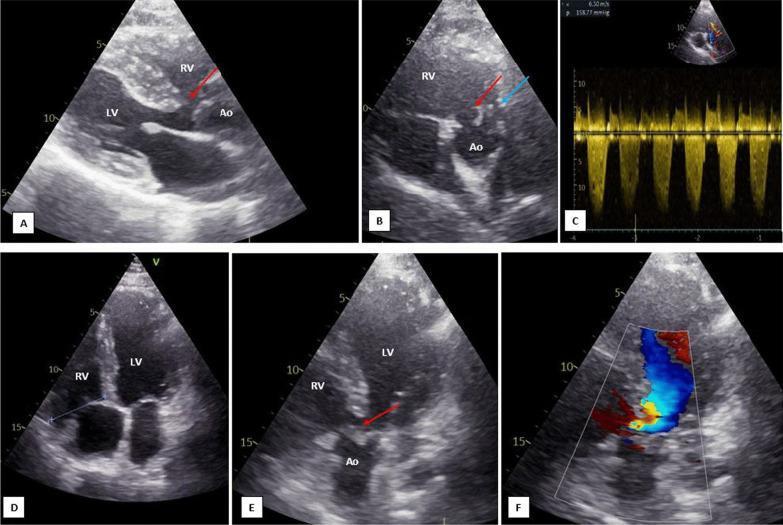
This composite of transthoracic echocardiographic (TTE) images displays key diagnostic features of Tetralogy of Fallot (TOF). The 2D grayscale images (A, B, E) identify a large malalignment-type ventricular septal defect (VSD, red arrows) and an overriding aorta (Ao) positioned over the interventricular septum. Image B, a parasternal short-axis view, further highlights a hypoplastic main pulmonary artery (blue arrow). Image D, an apical four-chamber view, shows a moderately dilated and hypertrophied right ventricle (RV) compared to the left ventricle (LV). Functional assessment via Continuous Wave Doppler (C) demonstrates severe right ventricular outflow tract (RVOT) obstruction with a peak velocity (Vmax) of 6.3 m/s, indicating a high pressure gradient. Image F uses Color Doppler to visualize bidirectional shunt flow across the VSD. This set illustrates the classic anatomical components of TOF: VSD, overriding aorta, RVOT stenosis/pulmonary hypoplasia, and subsequent RV hypertrophy, providing a comprehensive pedagogical overview of cyanotic congenital heart disease imaging.
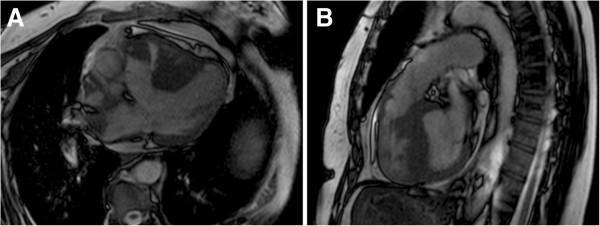
This diagnostic image consists of two panels (A and B) showing Cardiac Magnetic Resonance Imaging (MRI) in a patient with Tetralogy of Fallot. Panel A presents an axial view demonstrating a large ventricular septal defect (VSD) and an overriding aorta, where the aortic root is positioned directly above the septal defect rather than solely over the left ventricle. Panel B provides a sagittal/oblique view highlighting significant right ventricular hypertrophy, characterized by thickened muscular walls of the right ventricle. Additionally, this view illustrates subpulmonary stenosis, visible as an anatomical narrowing of the right ventricular outflow tract (RVOT) below the pulmonary valve. These findings represent the classic morphological components of Tetralogy of Fallot, a cyanotic congenital heart disease. The images serve as an educational example of how cardiac MRI can definitively characterize complex intracardiac shunts, valvular obstructions, and ventricular remodeling for surgical planning.
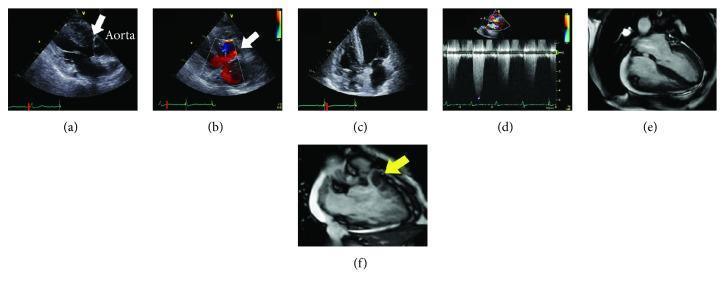
This composite figure presents multi-modal cardiac imaging of a patient with Tetralogy of Fallot. Panels (a) through (d) utilize transthoracic echocardiography: (a) Parasternal long-axis view showing a large subaortic ventricular septal defect (VSD, white arrow) with an overriding aorta. (b) Color Doppler confirms bidirectional shunting across the VSD. (c) Apical four-chamber view demonstrating marked right ventricular (RV) hypertrophy. (d) Spectral Doppler showing significant RV outflow tract (RVOT) obstruction with a high-velocity jet of 4.9 m/s. Panels (e) and (f) display Cardiac Magnetic Resonance Imaging (CMRI): (e) 4-chamber cine image used for volumetric analysis showing RV enlargement. (f) Detailed CMRI of the RVOT (yellow arrow) identifying severe infundibular (subvalvular) pulmonary stenosis. Collectively, these images illustrate the classic anatomical components of Tetralogy of Fallot including VSD, overriding aorta, RV hypertrophy, and RVOT obstruction, emphasizing the importance of multimodality imaging in assessing congenital heart disease.
Congenital Heart Disease (CHD)
Classification
| Category | Mechanism | Examples |
|---|---|---|
| Left-to-right shunts (Acyanotic) | Oxygenated blood recirculates through the lungs | ASD, VSD, PDA |
| Right-to-left shunts (Cyanotic) | Deoxygenated blood enters systemic circulation | Tetralogy of Fallot, Transposition of Great Arteries |
| Obstructive lesions | Outflow obstruction without initial shunt | Coarctation of Aorta, Pulmonary/Aortic Stenosis |
Relative Frequency of Common Defects
| Defect | Approximate Frequency |
|---|---|
| Ventricular Septal Defect (VSD) | ~25-30% (most common at birth) |
| Atrial Septal Defect (ASD) | ~10% (most common in adults) |
| Patent Ductus Arteriosus (PDA) | ~7% |
| Tetralogy of Fallot | ~5% (most common cyanotic CHD) |
| Coarctation of Aorta | ~5% |
| Transposition of Great Arteries | ~5% |
| Others | ~43% |
LEFT-TO-RIGHT SHUNTS (Acyanotic)
Diagram: Common Left-to-Right Shunts
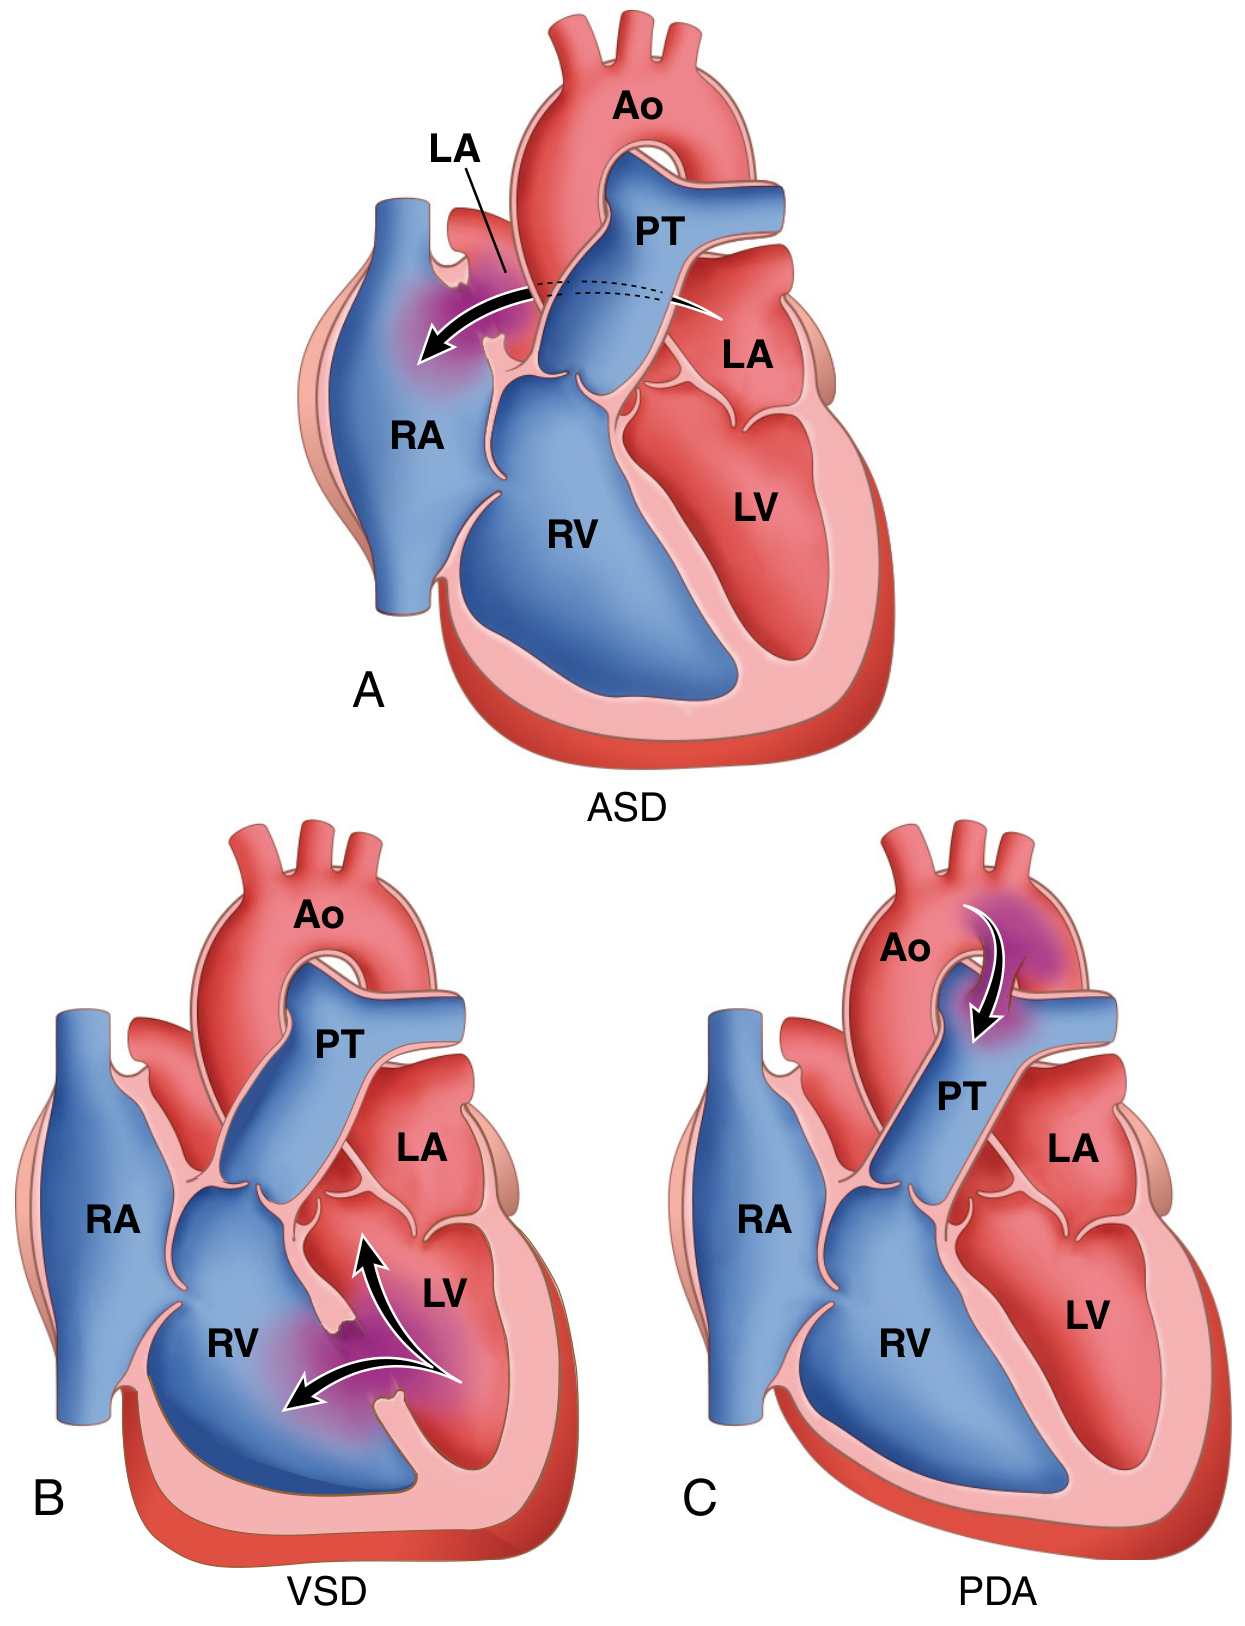
1. Atrial Septal Defect (ASD)
- Secundum ASD (90%) - deficient septum secundum formation near the center of the atrial septum. Usually isolated.
- Primum ASD (5%) - near the AV valves; often associated with AV valve abnormalities and/or VSD (part of endocardial cushion defects).
- Sinus venosus defect (5%) - near the SVC entry; can be associated with anomalous pulmonary venous return.
- Left-to-right shunt (pulmonary vascular resistance << systemic vascular resistance)
- Pulmonary flow volumes may be 2-8 times normal
- Right-sided volume overload, right heart dilation
- Usually asymptomatic until adulthood (the most common CHD diagnosed in adults, because VSDs are more common but tend to close spontaneously)
- Fixed, widely split S2 (classic auscultatory finding)
- Systolic flow murmur over pulmonary area
- Irreversible pulmonary hypertension is uncommon
- Complications: heart failure, paradoxical embolism, atrial arrhythmias
2. Ventricular Septal Defect (VSD)
- Membranous (perimembranous) VSD (~90%) - in the region of the membranous interventricular septum, typically 2-3 cm in diameter
- Muscular VSD - within the muscular septum; may be multiple ("Swiss cheese")
- Infundibular (supracristal) VSD - below the pulmonary valve
- Left-to-right shunt at ventricular level (high-pressure shunt)
- Right ventricular hypertrophy and pulmonary trunk dilation
- Pressure hypertrophy of RV + volume hypertrophy of LV
- Small VSDs may be asymptomatic; ~50% of muscular VSDs close spontaneously
- Harsh holosystolic murmur at lower left sternal border
- Larger defects cause CHF, failure to thrive
- VSD causes pulmonary hypertension earlier and more frequently than ASD (due to higher pressures)
- Jet lesions on RV endocardium predispose to infective endocarditis
3. Patent Ductus Arteriosus (PDA)
- High-pressure left-to-right shunt (aorta → pulmonary trunk)
- Pulmonary overcirculation and left heart volume overload
- Harsh, continuous "machinery-like" murmur (best heard at left infraclavicular area)
- Wide pulse pressure, bounding pulses
- Small PDA: often asymptomatic
- Large PDA: CHF, pulmonary hypertension → Eisenmenger
- Indomethacin/Ibuprofen (prostaglandin synthesis inhibitors) - effective in premature infants
- Catheter-based occlusion or surgical ligation for larger defects
RIGHT-TO-LEFT SHUNTS (Cyanotic)
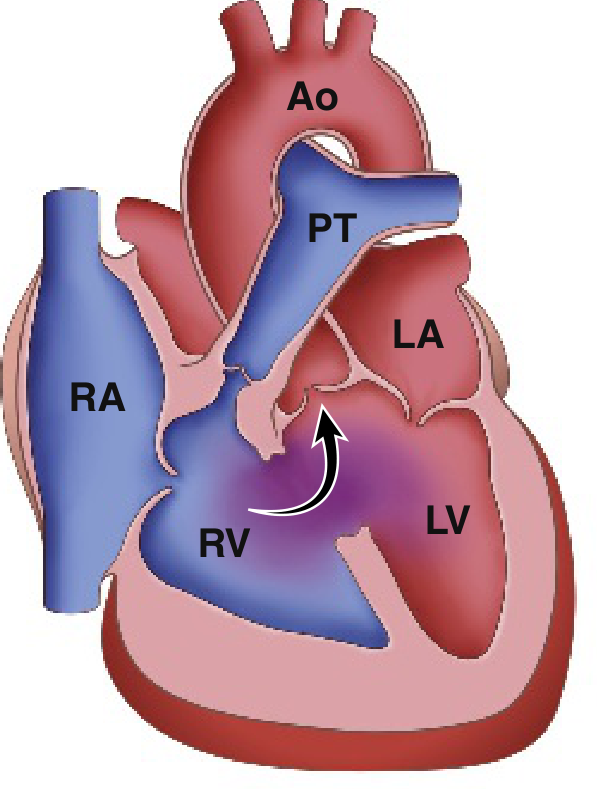
4. Tetralogy of Fallot (ToF)
- VSD (large, membranous)
- Right ventricular outflow tract obstruction (subpulmonic/infundibular stenosis)
- Overriding aorta (aortic valve lies directly over the VSD)
- Right ventricular hypertrophy
- Boot-shaped heart (coeur en sabot) on CXR - due to right ventricular hypertrophy and hypoplastic pulmonary trunk
- Proximal aorta is dilated; pulmonary trunk is hypoplastic
- RV wall hypertrophy may exceed LV wall thickness
- Right-to-left shunting through VSD → decreased pulmonary blood flow, increased aortic volume
- Severity depends on degree of pulmonary outflow obstruction
- Pulmonic stenosis protects pulmonary vasculature from pressure/volume overload → pulmonary hypertension and RV failure are rare (unlike VSD)
- Early cyanosis (degree depends on RVOT obstruction severity)
- "Tet spells" (hypercyanotic spells) - acute paroxysmal cyanosis in infants due to spasm of the RVOT, relieved by squatting (increases SVR, reduces R→L shunt)
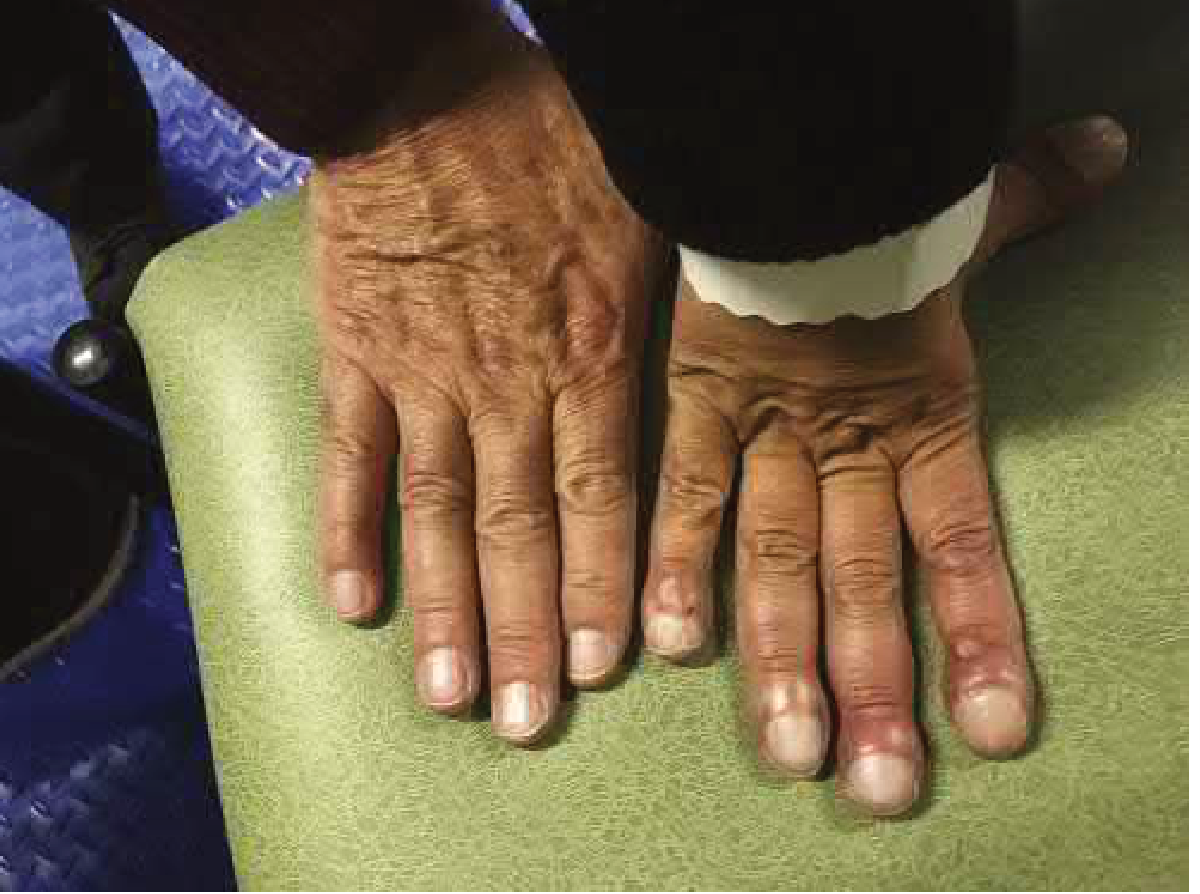
- Polycythemia, clubbing
- Risk of infective endocarditis, cerebral abscesses (paradoxical embolism)
- Echocardiography shows the classic features - see imaging below
5. Transposition of the Great Arteries (TGA)
- Creates two parallel, separate circulations - systemic and pulmonary circuits do not connect
- Incompatible with postnatal life unless a shunt allows mixing:
- VSD (present in ~1/3 of cases)
- PDA
- Patent foramen ovale
- Marked RV hypertrophy (functioning as the systemic ventricle)
- LV is hypoplastic (pumps only to low-resistance pulmonary circuit)
- Severe cyanosis from birth
- Rapid clinical deterioration as PDA and PFO close
- Requires emergent intervention within the first days of life
OBSTRUCTIVE LESIONS
6. Coarctation of the Aorta
| Feature | Preductal ("Infantile") | Postductal ("Adult") |
|---|---|---|
| Location | Proximal to PDA | Adjacent to ligamentum arteriosum |
| PDA | Patent | Absent (ligamentum) |
| Cyanosis | Lower body cyanosis (differential) | None (typically) |
| Presentation | Neonatal period | Often incidental in adults |
- Postductal (most common):
- Upper extremity hypertension + lower extremity hypotension - the classic pairing
- Weak/absent femoral pulses, claudication, cold lower limbs
- Systolic murmur (heard over the back)
- Rib notching on CXR from dilated intercostal collateral arteries
- Preductal:
- Lower body cyanosis (PDA delivers deoxygenated blood distally)
- Fatal in neonatal period without intervention
EISENMENGER SYNDROME
- Chronic pulmonary overcirculation → pulmonary vascular remodeling
- Rising pulmonary vascular resistance (PVR)
- When PVR exceeds systemic vascular resistance (SVR) → shunt reversal (right-to-left)
- Cyanosis develops
- Large post-tricuspid shunts (VSD, PDA) → Eisenmenger in first years of life
- ASD (pre-tricuspid shunt) → Eisenmenger in adulthood (less common, <10%)
- Hematologic: erythrocytosis, hyperviscosity, iron deficiency, thrombocytopenia
- Thromboembolism + paradoxical embolism → CVA, cerebral abscess
- Hemoptysis
- Infective endocarditis
- Gout, hyperuricemia
- Digital clubbing (see image below)
Etiology and Risk Factors
| Risk Factor | Associated CHD |
|---|---|
| Trisomy 21 (Down syndrome) | AVSD, VSD, ASD |
| Trisomy 18 (Edwards) | VSD, PDA, ASD |
| Trisomy 13 (Patau) | VSD, ASD, PDA |
| Turner syndrome (45,X) | Coarctation of aorta, bicuspid aortic valve |
| 22q11 deletion (DiGeorge) | ToF, truncus arteriosus, interrupted aortic arch |
| Congenital rubella (1st trimester) | PDA, pulmonary artery stenosis |
| Maternal diabetes | TGA, VSD, hypertrophic cardiomyopathy |
| Maternal alcohol use | VSD, ASD, PDA |
| Maternal lithium use | Ebstein anomaly (tricuspid valve) |
Summary Table
| Defect | Shunt Direction | Cyanosis | Key Feature | Murmur |
|---|---|---|---|---|
| ASD | L→R | No | Fixed split S2 | Systolic flow murmur (pulmonic area) |
| VSD | L→R | No (initially) | Most common at birth | Harsh holosystolic (LSB) |
| PDA | L→R | No (initially) | Prematurity, rubella | Continuous "machinery" murmur |
| ToF | R→L | Yes | Boot-shaped heart, tet spells | Systolic ejection (RVOT) |
| TGA | Parallel circuits | Yes from birth | Emergency at birth | Variable |
| Coarctation | Obstructive | Lower body only (preductal) | Rib notching, upper HTN | Systolic (heard over back) |