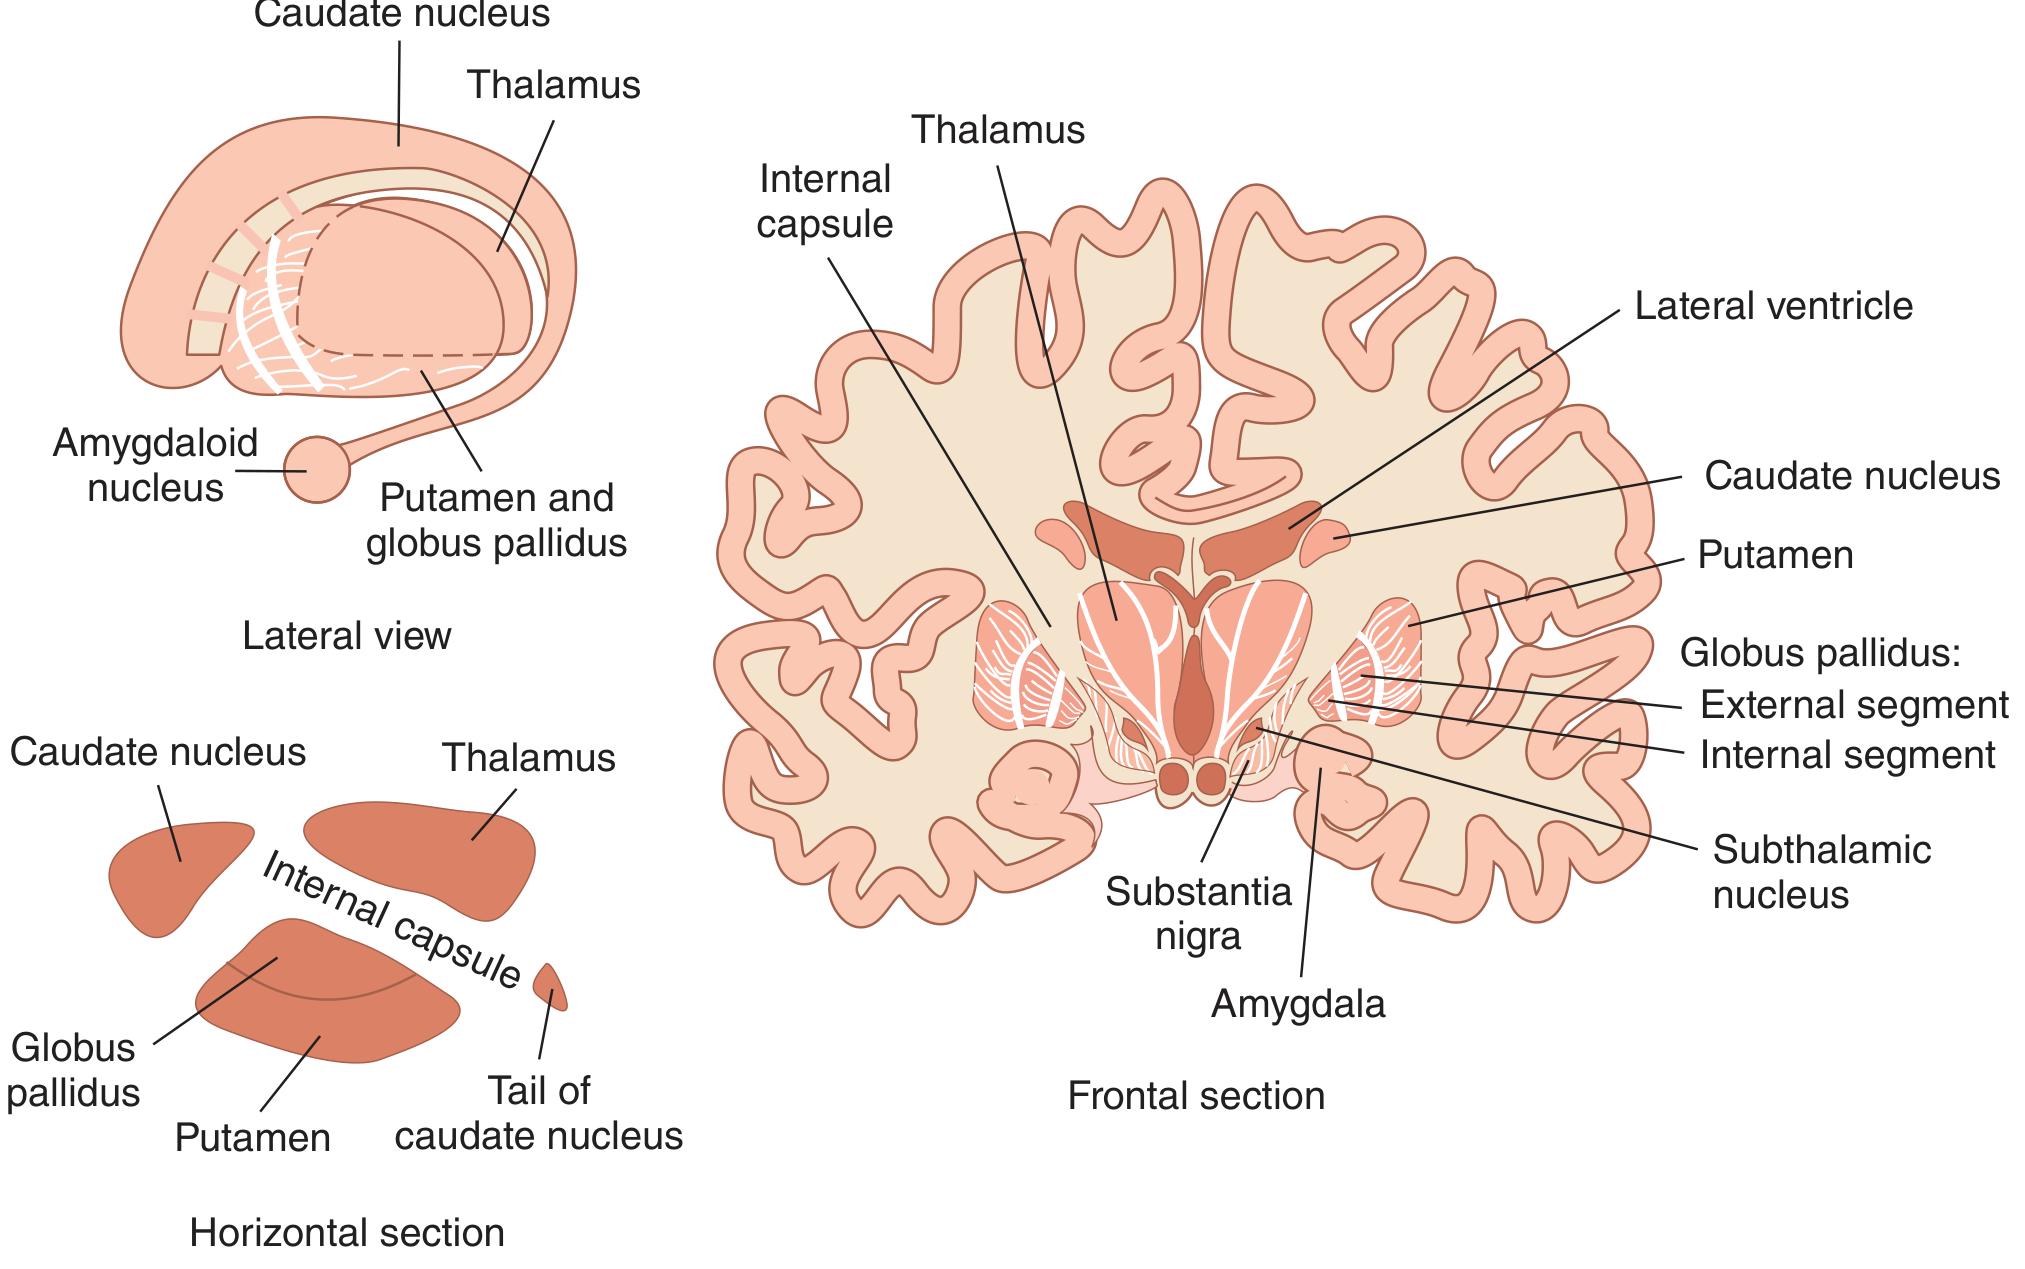
Location of basal ganglia
basal ganglia location diagram caudate putamen internal capsule thalamus
basal ganglia anatomy coronal section brain
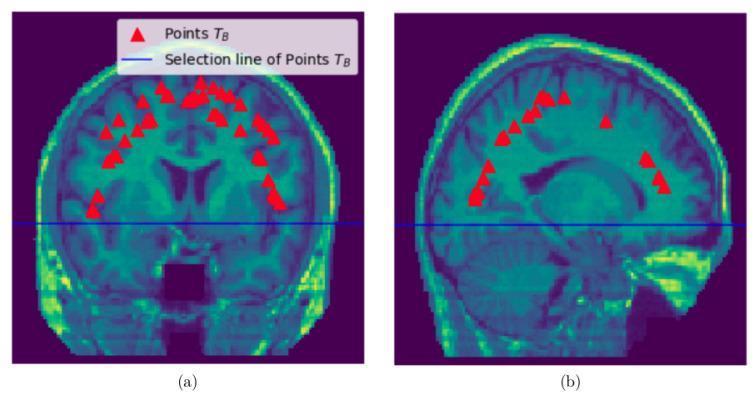
This diagnostic image illustrates brain sampling points (TB) for segmentation methodology using MRI data. The figure is divided into two panels: (a) a coronal section and (b) a sagittal section of the human brain. Both images utilize a teal-to-green false-color scale for anatomical visualization. In panel (a), the coronal view displays the cerebral cortex, ventricular system, and basal ganglia. In panel (b), the sagittal view reveals the cortex, cerebellum, brainstem, and corpus callosum. A horizontal blue 'selection line' bisects both images at the level of the lateral ventricles. Red triangle markers, labeled as 'Points TB,' are distributed above this selection line, primarily localized within the cortical gray matter and subcortical regions. This visual demonstrates the spatial distribution of sampling nodes used in graph-based brain segmentation algorithms to distinguish brain tissue from non-brain structures and the skull. The educational focus is on neuroimaging processing and computational anatomy.
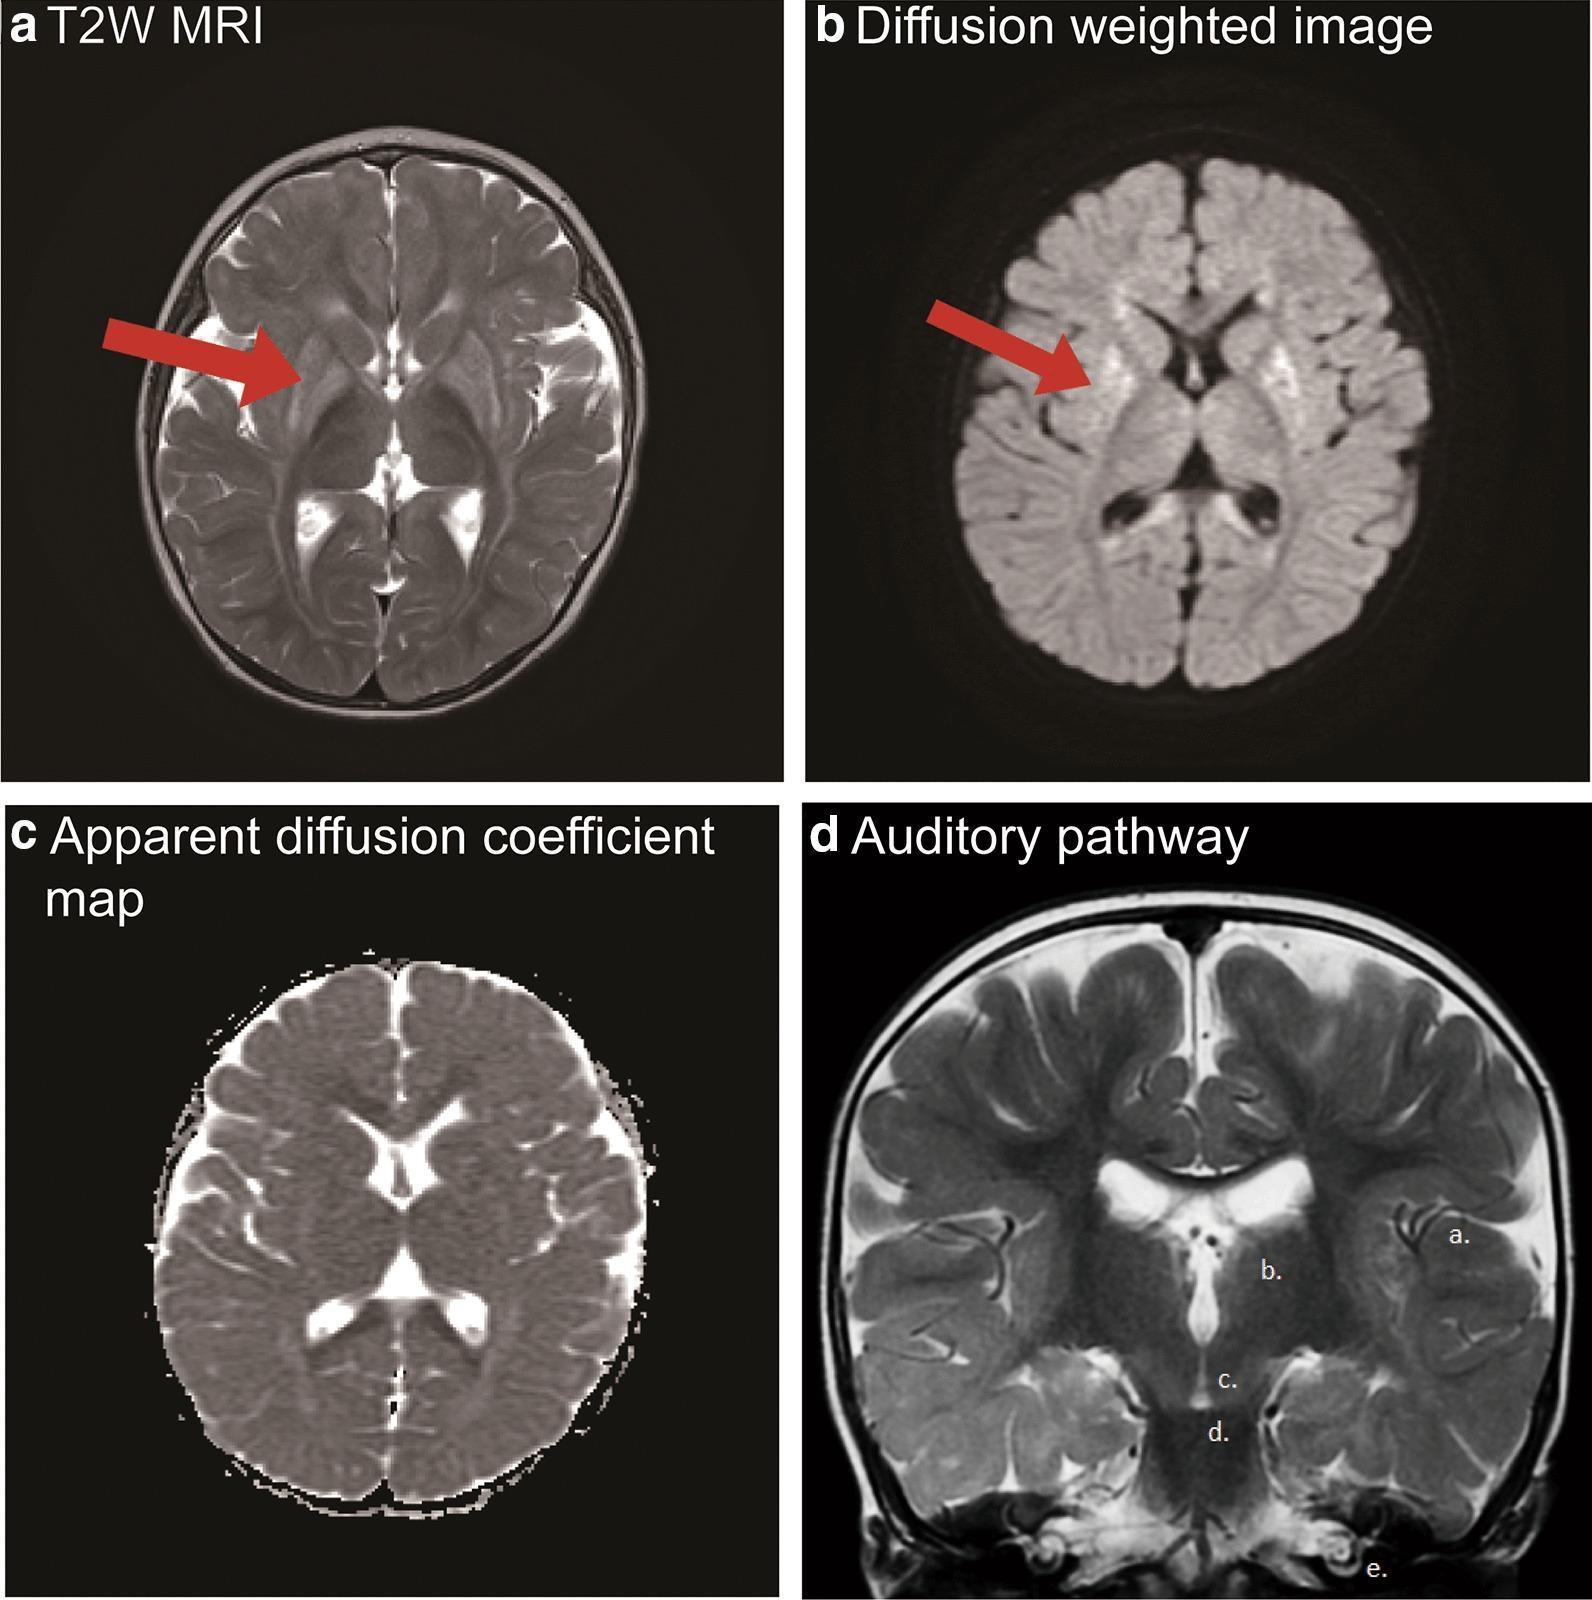
This composite figure presents brain magnetic resonance imaging (MRI) findings in Glutaric Aciduria Type 1 (GA-1). Panels A, B, and C provide axial views demonstrating characteristic basal ganglia injury. Panel A (T2-weighted MRI) shows bilateral, extensively hyperintense signal in the striatum, specifically the putamen (red arrow). Panel B (Diffusion-weighted imaging, DWI) reveals hyperintense signal indicating elevated diffusion in the dorsolateral putamen. Panel C (Apparent Diffusion Coefficient, ADC map) shows minimal restricted diffusion in the bilateral putamen, corresponding to the findings in A and B. Panel D is an oblique coronal T2-weighted section labeled to illustrate the central auditory pathway anatomy: (a) auditory cortex, (b) medial geniculate body of the thalamus, (c) inferior colliculus in the midbrain, (d) superior olivary nucleus in the pons, and (e) cochlea. This panel demonstrates the absence of space-occupying lesions along the auditory tracts and the characteristic hypointense appearance of white matter tracts in a pediatric patient. The imaging collectively highlights metabolic-induced neurotoxicity in the basal ganglia and provides a structural evaluation of the hearing apparatus.
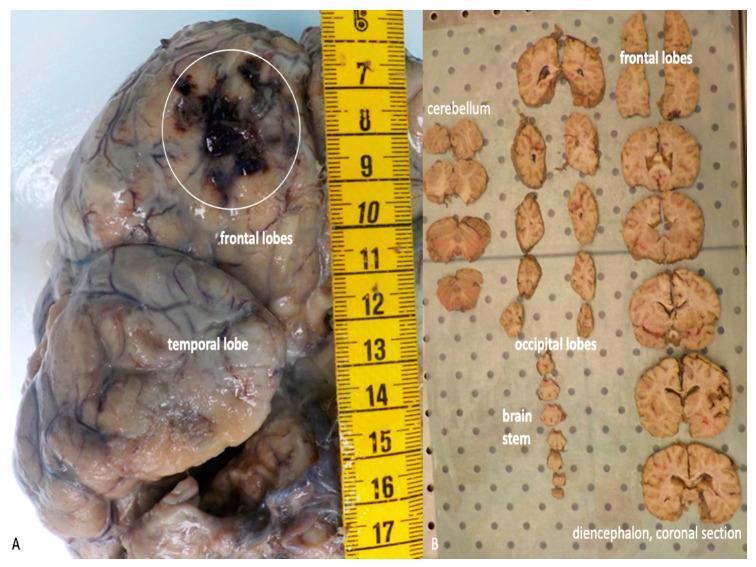
This composite clinical photograph displays a macroscopic examination of a human brain specimen following formalin fixation, illustrating traumatic brain injury (TBI) pathology. Figure A shows the superior and lateral view of the intact brain in toto. A prominent focal traumatic contusion is visible in the right frontal lobe, highlighted by a white circle; the lesion presents as a dark, irregular area of intraparenchymal hemorrhage and necrotic tissue damage. A yellow metric scale is positioned next to the specimen for size reference. Figure B demonstrates the pathological processing of the specimen through serial coronal sections laid out for systematic inspection. Labeled structures include the frontal lobes, cerebellum, occipital lobes, brainstem, and a specific coronal section of the diencephalon. The sections allow for the evaluation of deep cortical structures and internal anatomy, such as the ventricular system and basal ganglia, which is essential in forensic pathology and clinical neurology for correlating localized brain lesions with clinical symptoms or cause of death.
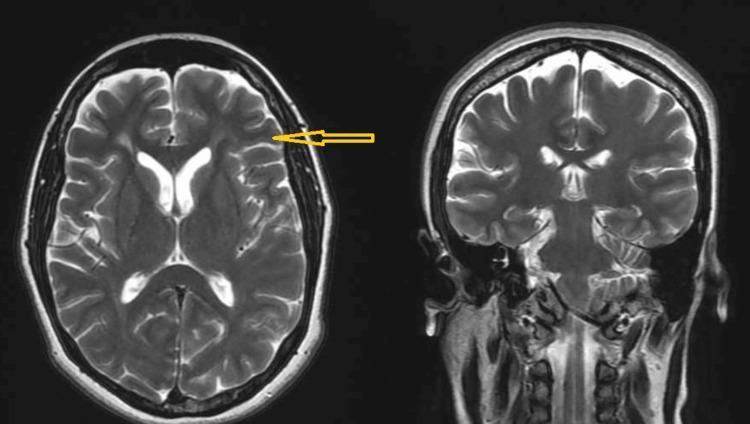
This diagnostic imaging set consists of two T2-weighted magnetic resonance imaging (MRI) scans of the human brain: an axial view on the left and a coronal view on the right. Both images demonstrate normal neuroanatomical findings and bilateral symmetry between the cerebral hemispheres. In the axial section, the lateral ventricles are clearly visible as hyperintense (bright) fluid-filled spaces, surrounded by well-defined deep gray matter structures including the thalamus and basal ganglia. The cerebral cortex shows preserved sulcation and gyration with distinct gray-white matter differentiation. An orange arrow in the axial view points toward the cortical surface of the left frontal lobe. The coronal section displays the vertical orientation of the brainstem, cerebellum, and the relationship between the cerebral hemispheres and the ventricular system. There is no evidence of midline shift, focal lesions, edema, or space-occupying masses in either plane. These images serve as a baseline for normal intracranial anatomy in a clinical or educational context.
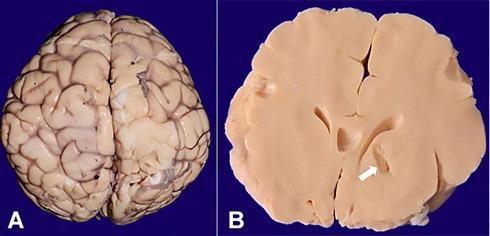
This composite clinical photograph displays two gross anatomical views of a human brain from an autopsy specimen. Figure A presents a superior (top-down) aspect of the cerebral hemispheres, showcasing the external surface morphology. The gyral pattern appears normal, with distinct gyri (ridges) and sulci (grooves) and no evidence of significant cortical atrophy or malformation. Figure B shows a coronal cross-section of the brain. A prominent white arrow indicates a localized cystic lesion located in the region of the right basal ganglia. The lesion is characterized by a loss of parenchymal tissue, consistent with an old cystic infarct. The surrounding anatomical landmarks, including the lateral ventricles and white matter tracts, are visible. The educational focus is on the gross pathological identification of focal brain lesions, such as infarcts, versus normal surface anatomy. This material is relevant to neuropathology and clinical neurology for studying the morphological manifestations of cerebrovascular accidents.
Location of the Basal Ganglia
- Position: They occupy a large portion of the interior (deep) region of both cerebral hemispheres, sitting lateral to the thalamus.
- Components and their location:
- Caudate nucleus - curves around the thalamus, with its head bulging into the lateral ventricle, body running along the thalamus, and tail curving into the temporal lobe toward the amygdala.
- Putamen - lies lateral to the globus pallidus, just deep to the insular cortex.
- Globus pallidus - medial to the putamen (together the putamen + globus pallidus form the lenticular nucleus; the caudate + putamen together form the striatum).
- Subthalamic nucleus and substantia nigra - functionally related structures located just below the thalamus, in the diencephalon/midbrain.
- Internal capsule: Nearly all motor and sensory fibers connecting the cerebral cortex with the spinal cord pass through the space between the major basal ganglia masses (specifically between the caudate/thalamus medially and the putamen/globus pallidus laterally). This fiber pathway is called the internal capsule - a clinically important structure since even small lesions here (e.g., lacunar infarcts, hypertensive hemorrhage) can cause dense contralateral motor/sensory deficits because so many fibers are packed into a small space (- Robbins & Kumar Basic Pathology; - Bradley and Daroff's Neurology in Clinical Practice).