
Tell me about ecg abnormalities
Reading File
ECG abnormalities cover a wide range of findings - from rhythm disturbances (arrhythmias) to conduction blocks, ischemic changes, axis deviations, and interval abnormalities. Let me pull detailed textbook content on this.
Searching sources...
Finding Sources
Finding Sources
Finding Sources
Reading File
Reading File
Reading File
Finding Sources
Reading File
Finding Sources
Reading File
Finding Sources
Reading File
Reading File
Now let me fetch a couple of the key ECG images to include in the response.
Loading Image
Loading Image
Loading Image
I now have comprehensive material from Harrison's Principles of Internal Medicine (22nd Ed., 2025) and Frameworks for Internal Medicine. Here is a thorough overview of ECG abnormalities:
ECG Abnormalities - A Comprehensive Overview
1. Axis Deviations
The normal QRS axis ranges from -30° to +100° in the frontal plane.
- Left axis deviation (axis < -30°): seen with left ventricular hypertrophy, left anterior fascicular block (hemiblock), or inferior MI.
- Right axis deviation (axis > +90° to +100°): seen in right ventricular overload, lateral infarction, dextrocardia, left pneumothorax, left posterior fascicular block, or as a normal variant in young patients.
2. Atrial Abnormalities
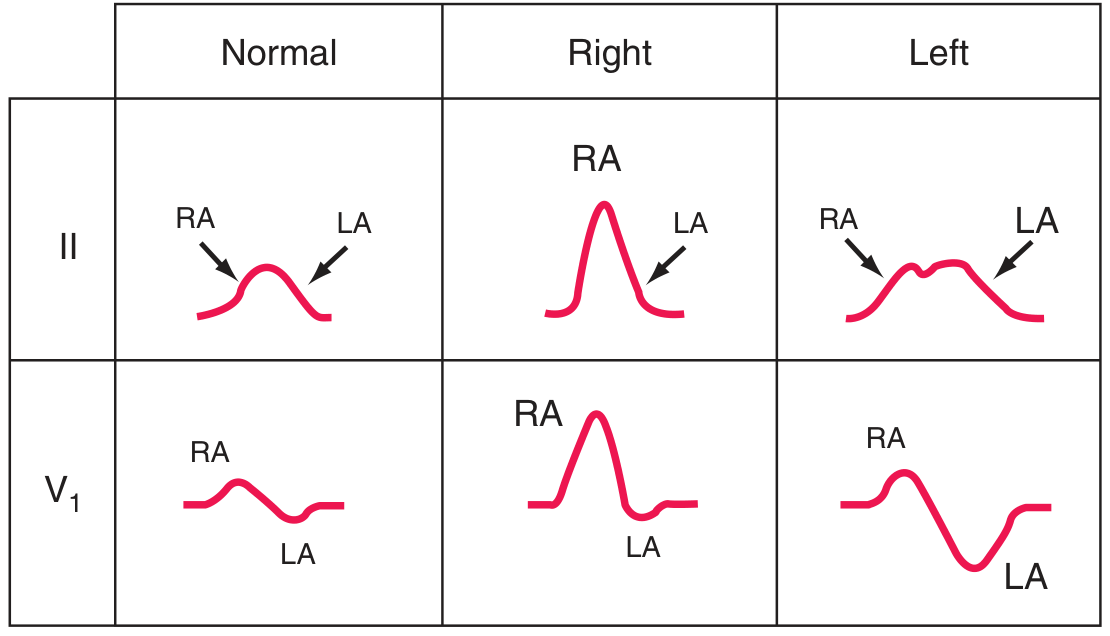
| Abnormality | ECG Finding |
|---|---|
| Right atrial overload ("P-pulmonale") | Tall, peaked P waves ≥2.5 mm in lead II or V1 |
| Left atrial abnormality ("P-mitrale") | Broad (≥120 ms), notched P wave in limb leads; biphasic P in V1 with prominent negative component |
- Harrison's Principles of Internal Medicine 22E, p. 1914
3. Ventricular Hypertrophy
Right Ventricular Hypertrophy (RVH):
- Relatively tall R wave in V1 (R ≥ S), with right axis deviation
- qR pattern in V1 or V3R
- ST depression and T-wave inversion in right to mid-precordial leads (right ventricular "strain")
- Prominent S waves in left lateral precordial leads
- Associated with: pulmonic stenosis, pulmonary arterial hypertension, ASD (often with RBBB)
Left Ventricular Hypertrophy (LVH):
-
Tall left precordial R waves and deep right precordial S waves (e.g., SV1 + RV5 or RV6 >35 mm; RaVL >20 mm in women, >28 mm in men)
-
ST depression with T-wave inversions in leads with prominent R waves ("strain" pattern)
-
May progress to incomplete or complete LBBB
-
LVH on ECG is a marker of increased cardiovascular morbidity and sudden cardiac death risk
-
Harrison's Principles of Internal Medicine 22E, p. 1914-1915
4. Bundle Branch Blocks and Intraventricular Conduction Defects
Complete bundle branch blocks have QRS duration ≥120 ms; incomplete blocks show QRS of 110-120 ms.
| Block | ECG Pattern |
|---|---|
| Right bundle branch block (RBBB) | rSR' in V1 (terminal R'), qRS (wide S) in V6; terminal QRS vector rightward and anterior |
| Left bundle branch block (LBBB) | Broad notched R in V5-V6, I, aVL; QS or rS in V1; the entire early and late depolarization is altered |
| Left anterior fascicular block | Left axis deviation, small Q in I/aVL, small R in II/III/aVF |
| Left posterior fascicular block | Right axis deviation, small R in I/aVL, small Q in II/III/aVF |
| Bifascicular block | RBBB + left anterior or posterior fascicular block |
- Harrison's Principles of Internal Medicine 22E, p. 1915
5. Myocardial Ischemia and Infarction
Subendocardial ischemia: ST vector directed inward → ST depression in overlying leads.
Transmural/epicardial ischemia: ST vector directed outward → ST elevation in overlying leads.
Regional localization of ischemia:
| Territory | ECG Leads Affected |
|---|---|
| Anterior/apical/lateral | V1-V6, I, aVL |
| Inferior | II, III, aVF |
| Posterior (indirect) | Reciprocal ST depression V1-V3 |
| Right ventricle | Right-sided leads (V3R, V4R) |
Temporal evolution of MI:
- ST elevation (earliest sign, hours)
- T-wave inversions (hours to days)
- Q-wave development (hours to days)
Wellens T-wave sign: Deep T-wave inversions in V1-V4 (± I, aVL) indicate high-grade left anterior descending artery stenosis.
Abnormal Q waves: ≥40 ms wide or >25% depth of R wave - indicate zones of necrosis (though Q waves are NOT exclusively transmural - subendocardial MI can produce Q waves too).
- Harrison's Principles of Internal Medicine 22E, p. 1916
6. AV Conduction Blocks (Heart Block)
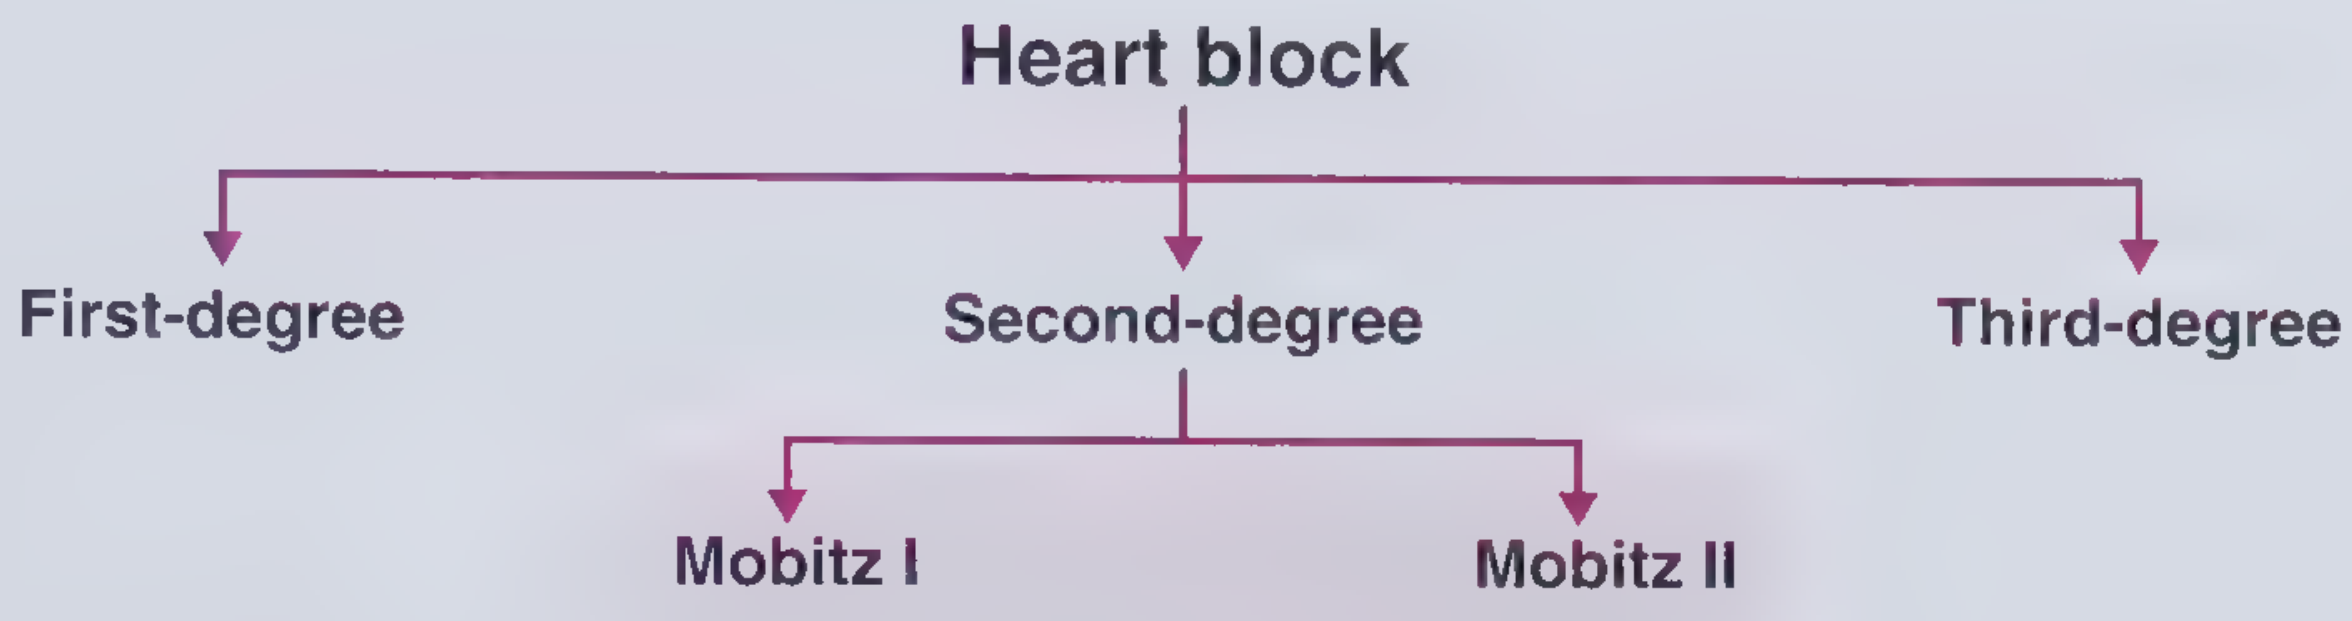
| Type | ECG Finding | Clinical Note |
|---|---|---|
| 1st-degree AV block | PR interval >200 ms; all P waves conduct | Generally benign |
| 2nd-degree Mobitz I (Wenckebach) | Progressive PR prolongation until a P wave is dropped; next PR resets to shortest | Block typically at AV node; associated with RCA territory MI |
| 2nd-degree Mobitz II | Constant PR interval with sudden, unpredictable dropped QRS | Block in His-Purkinje system; more dangerous, may require pacing |
| 3rd-degree (complete heart block) | AV dissociation - P waves and QRS complexes beat independently | Emergent; junctional or ventricular escape rhythm |
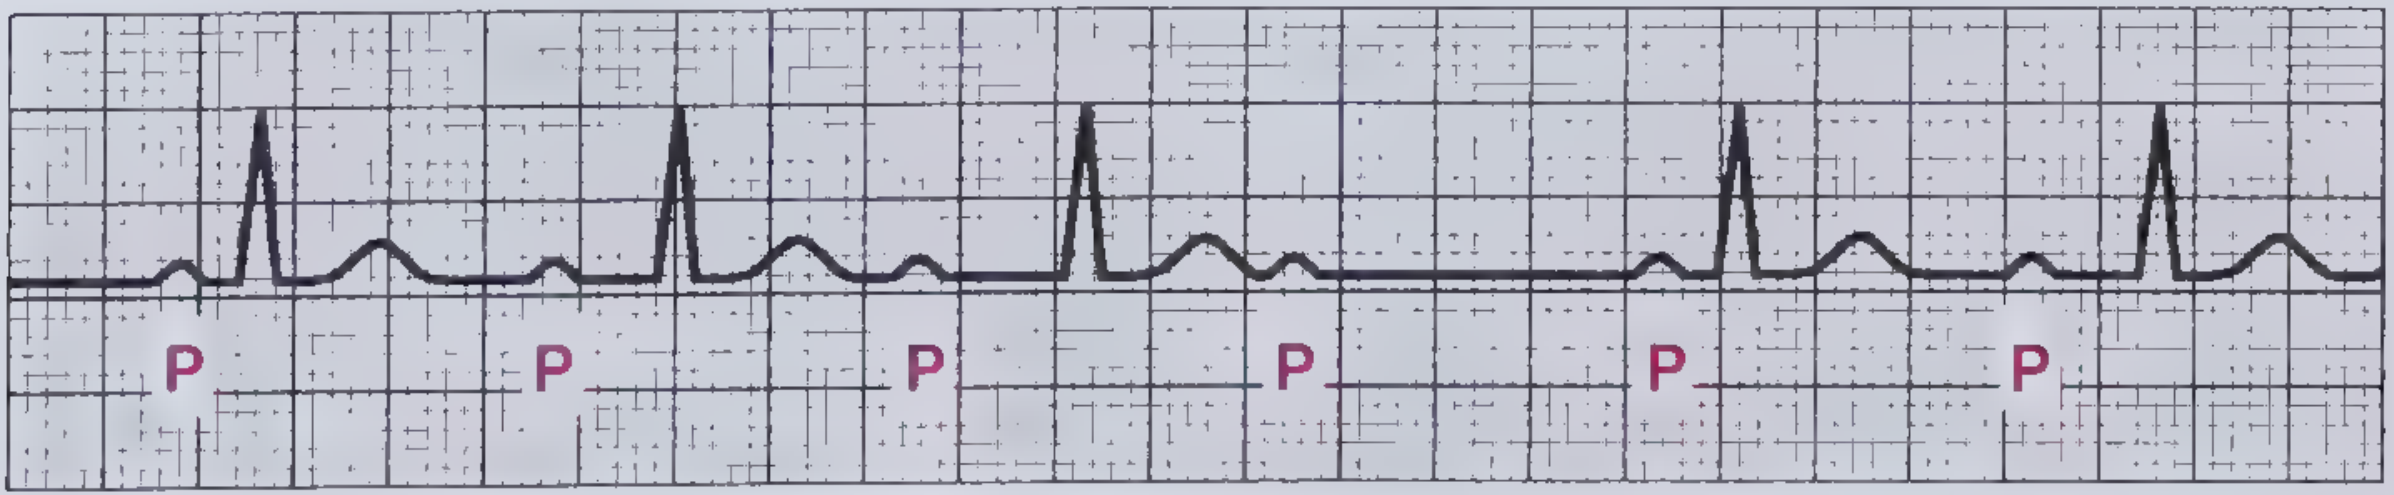
- Frameworks for Internal Medicine, p. 1460-1498
7. Metabolic and Drug-Induced Changes
| Cause | ECG Effect |
|---|---|
| Hyperkalemia | Tall peaked (tented) T waves → PR prolongation → P-wave loss → wide QRS → sine-wave pattern → asystole |
| Hypokalemia | Prominent U waves, QT prolongation, ST depression |
| Hypocalcemia | Prolonged QT interval (ST segment elongated) |
| Hypercalcemia | Shortened QT interval |
| Digitalis | Shortened QT, "scooped" ST-T complex (digitalis effect); toxicity causes AV blocks and arrhythmias |
| Class IA/III antiarrhythmics (quinidine, amiodarone, sotalol) | QT prolongation, prominent U waves |
| Hypothermia | Bradycardia, Osborn wave (J-point elevation), prolonged repolarization |
| Intracranial bleeds (SAH) | Deep wide T-wave inversions, prolonged QT ("CVA T-wave" pattern) |
- Harrison's Principles of Internal Medicine 22E, p. 1917
8. Other Notable ECG Abnormalities
| Condition | ECG Pattern |
|---|---|
| Acute pulmonary embolism | Sinus tachycardia (most common); S1Q3T3 pattern; right axis shift; RBBB; ST changes V1-V4 simulating anterior MI |
| Chronic cor pulmonale (COPD) | Low voltage; slow R-wave progression; rightward axis |
| Wolff-Parkinson-White (WPW) | Short PR, delta wave, wide QRS |
| Long QT syndrome | QTc >440-460 ms; risk of torsades de pointes |
| Brugada pattern | Coved or saddle-back ST elevation in V1-V2; right bundle branch morphology |
| Pericarditis | Diffuse saddle-shaped ST elevation with PR depression (all leads except aVR/V1) |
| Dextrocardia | Negative P/QRS/T in lead I; R-wave regression V1-V6 |
9. Interval Reference Summary
| Interval | Normal | Abnormal |
|---|---|---|
| PR | 120-200 ms | >200 ms = 1st-degree block |
| QRS | <120 ms | ≥120 ms = complete BBB |
| QTc | 370-440 ms | >450 ms (men), >460 ms (women) = prolonged |
| P-wave duration | <120 ms | ≥120 ms = left atrial abnormality |
| P-wave amplitude | <2.5 mm | ≥2.5 mm = right atrial overload |
ECG abnormalities rarely occur in isolation - clinical context (symptoms, history, biomarkers) is always needed for proper interpretation. Findings like LBBB or LVH predict increased cardiovascular morbidity; complete heart block and Mobitz II may require urgent pacing.
Sources: Harrison's Principles of Internal Medicine 22E (2025), Frameworks for Internal Medicine, The Harriet Lane Handbook 23rd Ed.
This is a shared conversation. Sign in to Orris to start your own chat.