
1. Define erythropoiesis. Explain the stages of erythropoiesis. Detail about regulation of erythropoiesis. Add a note on Iron deficiency anemia.1. Define erythropoiesis. Explain the stages of erythropoiesis. Detail about regulation of erythropoiesis. Add a note on Iron deficiency anemia.1. Define erythropoiesis. Explain the stages of erythropoiesis. Detail about regulation of erythropoiesis. Add a note on Iron deficiency anemia.
Reading File
Now let me search the medical library for all four topics in parallel.
Finding Sources
Finding Sources
Good results. Now let me read the key sections in parallel - erythropoiesis from Histology textbook, Biochemistry for stages, and Iron Deficiency Anemia from Robbins Pathologic Basis of Disease.
Reading File
Reading File
Reading File
Excellent content! Let me now read more of the Robbins iron deficiency section and also the detailed erythropoiesis stages from the histology textbook.
Reading File
Finding Sources
Finding Sources
Reading File
Finding Sources
Reading File
Let me search for the detailed stages of erythropoiesis in the histology textbook which likely has the most complete information.
Finding Sources
Reading File
Reading File
Reading File
Reading File
Reading File
I now have comprehensive information from authoritative textbooks. Let me fetch the key diagram images and compile the complete answer.
Loading Image
Loading Image
Loading Image
I now have all the information and images needed. Let me also fetch the iron metabolism diagram.
Loading Image
Loading Image
I now have everything I need to write a comprehensive, well-illustrated answer. Let me compose the full response.
Erythropoiesis: Definition, Stages, Regulation, and Iron Deficiency Anemia
1. Definition of Erythropoiesis
Erythropoiesis is the process by which mature red blood cells (erythrocytes) are produced from pluripotent hematopoietic stem cells in the red bone marrow. It is a continuous, highly regulated process that generates approximately 2-3 million new erythrocytes per second in a healthy adult, maintaining the circulating red cell mass needed for adequate oxygen delivery to tissues.
In the fetus, erythropoiesis occurs sequentially in the yolk sac (primitive erythropoiesis), then the liver and spleen, and finally the bone marrow, which becomes the sole site of erythropoiesis after birth.
- Histology: A Text and Atlas with Correlated Cell and Molecular Biology
- Basic Medical Biochemistry: A Clinical Approach, 6e
2. Stages of Erythropoiesis
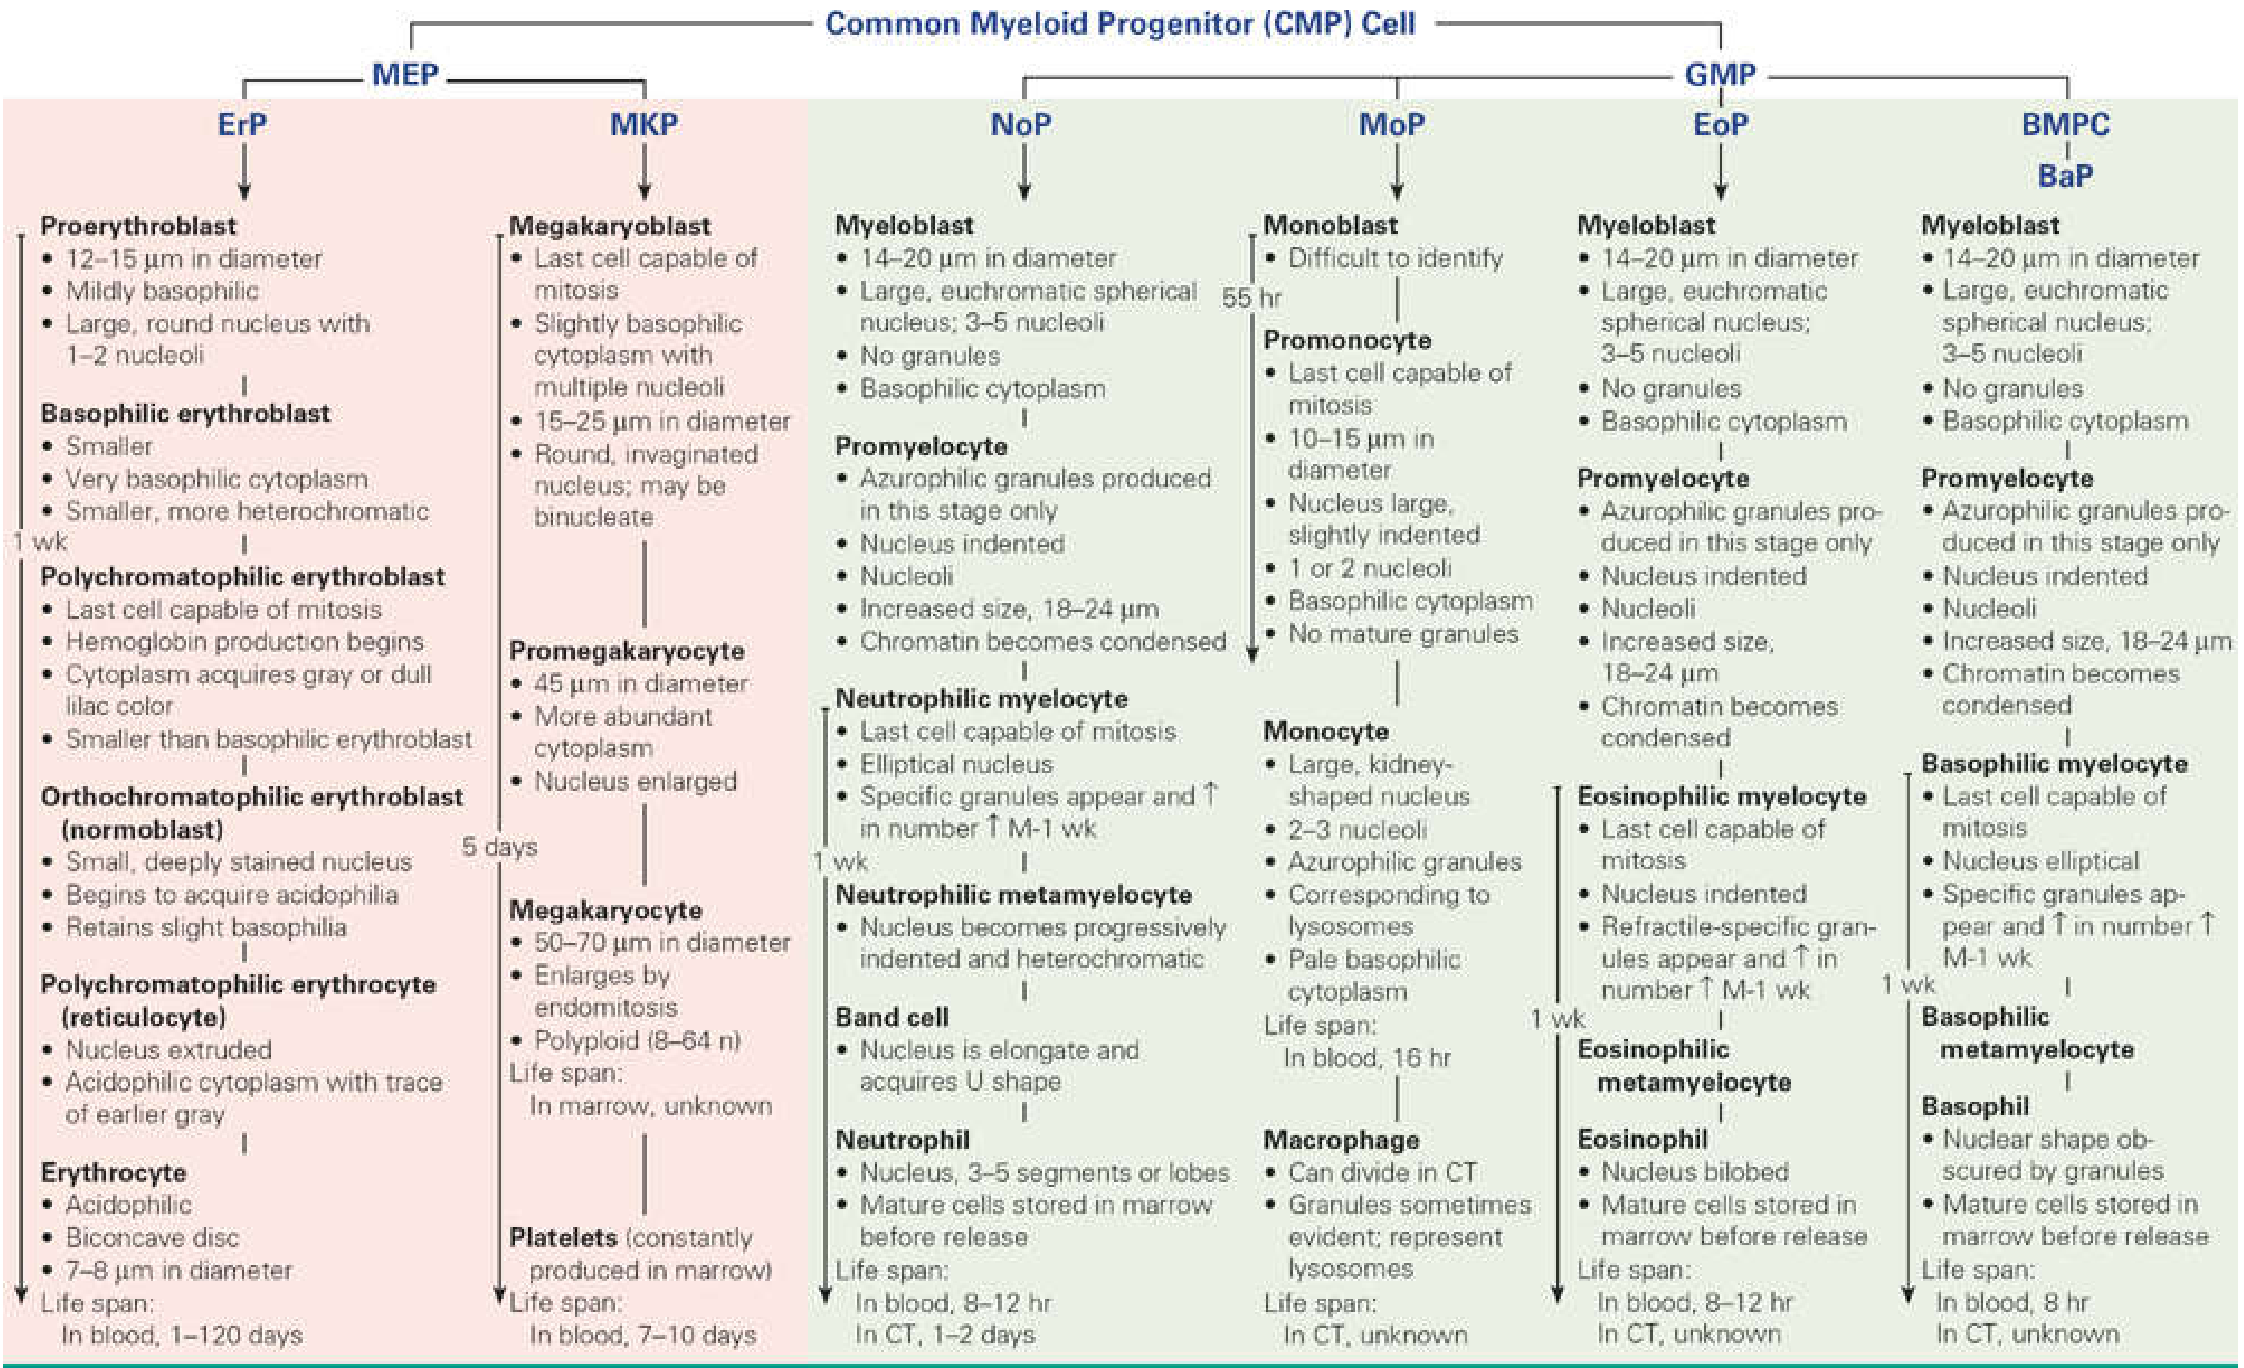
Erythropoiesis proceeds through two broad phases: a commitment phase (progenitor cells not visible by light microscopy) and a maturation phase (morphologically recognizable precursors).
A. Commitment Phase (Progenitor Cells)
This phase occurs in the bone marrow and is not visible on routine smears:
| Progenitor | Key Features |
|---|---|
| Pluripotent HSC | Self-renewing hematopoietic stem cell |
| CMP (Common Myeloid Progenitor) | Under influence of erythropoietin, IL-3, IL-4 |
| MEP (Megakaryocyte/Erythrocyte Progenitor) | Bipotential; gives rise to erythroid or platelet lineage |
| BFU-E (Burst-Forming Unit - Erythroid) | Large erythroid burst colony; EPO-responsive |
| CFU-E (Colony-Forming Unit - Erythroid) | Smaller colony; highly EPO-sensitive; gives rise to proerythroblast |
The transcription factor GATA-1 is required for terminal differentiation of MEP cells into the definitive erythroid lineage.
B. Maturation Phase (Morphologically Recognizable Precursors)
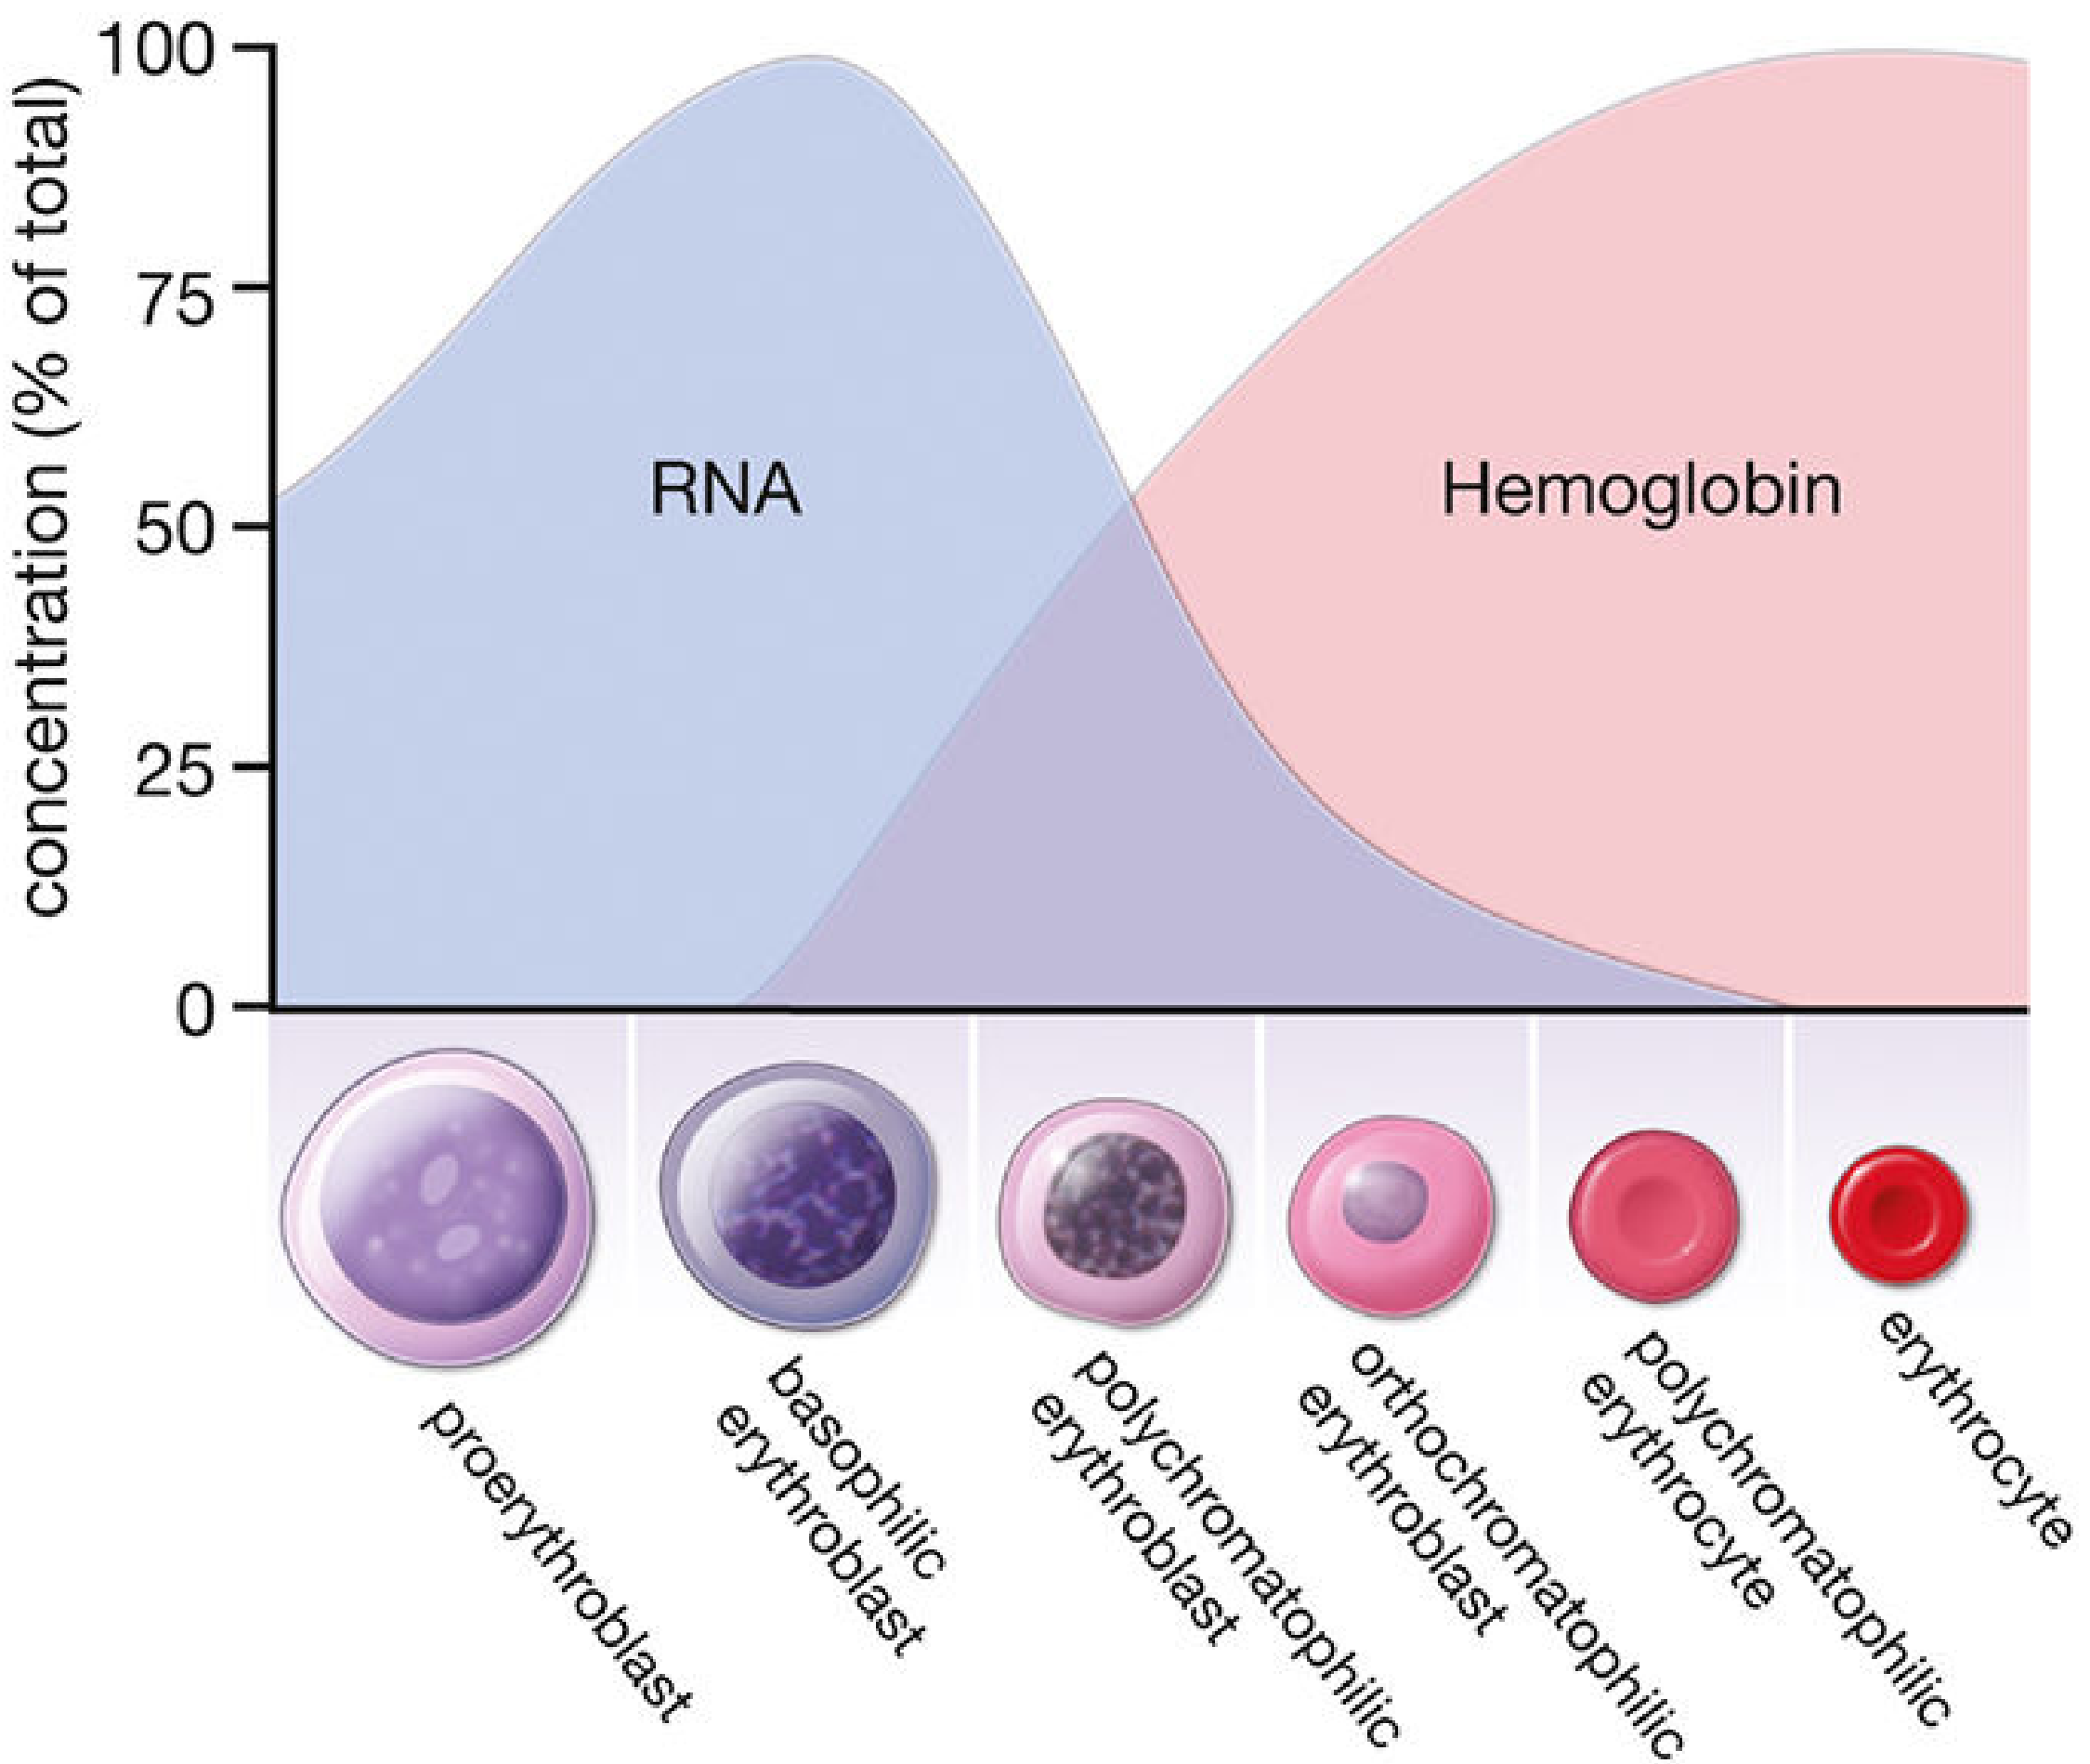
The following stages are identified in bone marrow smears, showing progressive changes in cell size, nuclear chromatin, and cytoplasmic staining:
Stage 1: Proerythroblast (Pronormoblast)
- Size: 12-20 µm in diameter (large cell)
- Nucleus: Large, round, with 1-2 visible nucleoli; fine euchromatin
- Cytoplasm: Mildly basophilic (free ribosomes beginning to accumulate)
- Activity: Components for hemoglobin (Hgb) production begin to accumulate
- Duration: ~24 hours
- Mitosis: Capable of division
- Key point: First microscopically recognizable erythroid precursor
Stage 2: Basophilic Erythroblast (Early Normoblast)
- Size: Smaller (10-16 µm); arises by mitotic division from proerythroblast
- Nucleus: Smaller, progressively more heterochromatic; no visible nucleoli
- Cytoplasm: Strong basophilia due to abundant polyribosomes actively synthesizing Hgb
- Duration: ~24 hours
- Mitosis: Capable of division
- Key point: Peak RNA content; maximum basophilia of cytoplasm
Stage 3: Polychromatophilic Erythroblast (Intermediate Normoblast)
- Size: Smaller than basophilic erythroblast
- Nucleus: Smaller; coarse heterochromatin forms a "checkerboard" pattern
- Cytoplasm: Mixed staining - gray/lilac color (both basophilia from RNA and eosinophilia from accumulating Hgb)
- Duration: ~30 hours
- Mitosis: This is the LAST stage capable of mitosis
- Key point: Hemoglobin production begins in earnest; cytoplasm reflects RNA-Hgb transition
Stage 4: Orthochromatophilic Erythroblast (Late Normoblast / Normoblast)
- Size: Only slightly larger than a mature erythrocyte
- Nucleus: Small, compact, densely stained (pyknotic); no chromatin pattern visible
- Cytoplasm: Eosinophilic (large amount of Hgb); slight residual basophilia
- Duration: ~48 hours
- Mitosis: No longer capable of division
- Key event: Nucleus is ejected (extruded) from the cell; nuclear fragments left behind are called Howell-Jolly bodies
Stage 5: Polychromatophilic Erythrocyte (Reticulocyte)
- Origin: Orthochromatophilic erythroblast after nuclear extrusion
- Characteristics: Acidophilic cytoplasm with trace of earlier gray; retains polyribosomes and mRNA capable of synthesizing Hgb
- Staining: With supravital stains (e.g., brilliant cresyl blue), polyribosomes clump and form a reticular network - hence "reticulocyte"
- Normal count: 1-2% of total erythrocyte count in peripheral blood
- Transit: 24 hours in bone marrow, then 24 hours in peripheral circulation, then matured in the spleen where ribosomes/mRNA are lost
- Clinical significance: Reticulocytosis indicates accelerated erythropoiesis (e.g., after hemorrhage)
Stage 6: Mature Erythrocyte (Red Blood Cell)
- Size: 7-8 µm in diameter; biconcave disc
- Appearance: Acidophilic; no nucleus, no organelles
- Life span: ~120 days in circulation
- Fate: Senescent erythrocytes are phagocytosed by macrophages in spleen, liver, and bone marrow
General maturation trend: Each successive division produces a smaller cell; the nucleus shrinks and becomes pyknotic; nucleoli disappear; the cytoplasm shifts from deep blue (basophilic) → gray/lilac → pink (eosinophilic); RNA falls while Hgb rises.
3. Regulation of Erythropoiesis
Erythropoiesis is regulated by a tightly controlled feedback system centered on oxygen sensing and several hormonal/cytokine signals.
A. Erythropoietin (EPO) - Primary Regulator
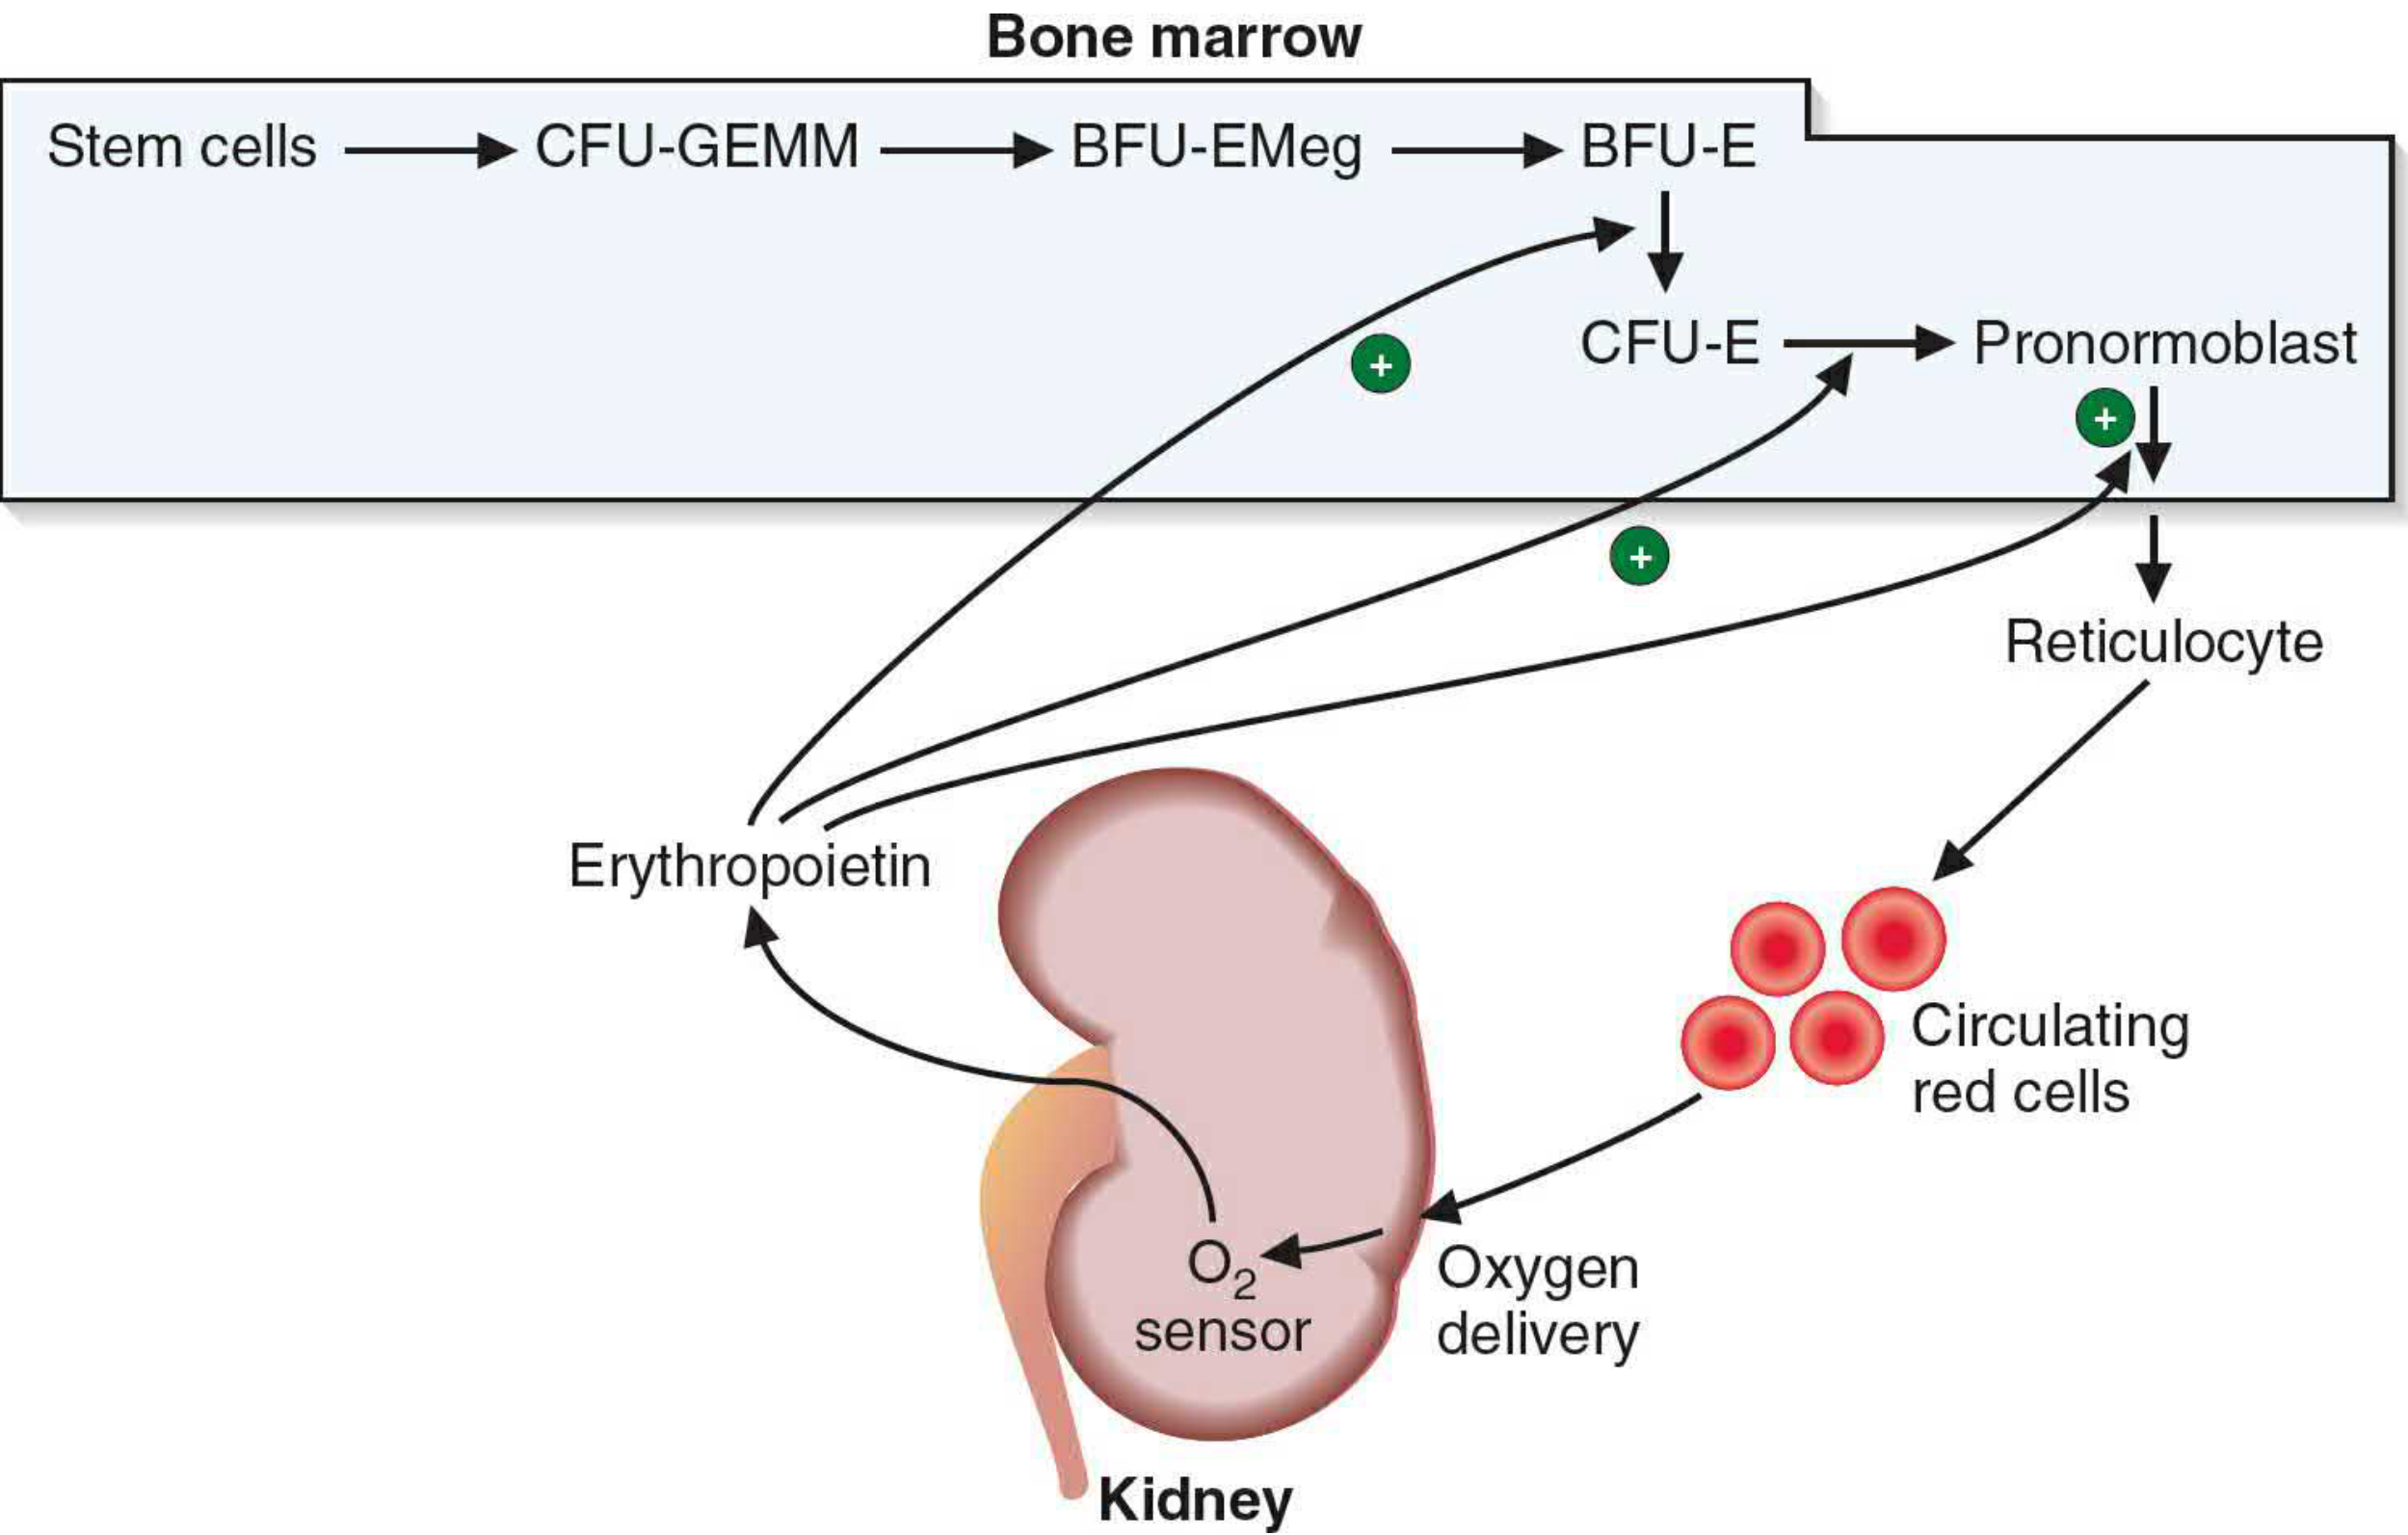
- Source: Produced and secreted primarily by peritubular interstitial cells of the kidney (90%); small amount from liver (10%)
- Stimulus: Tissue hypoxia (decreased oxygen delivery to the kidney)
- Mechanism: Hypoxia stabilizes HIF-1α (Hypoxia-Inducible Factor), which stimulates EPO gene transcription
- Molecular weight: 34 kDa glycoprotein hormone
- Site of action: EPO acts on specific receptors (ErP and CFU-E) via the JAK2/STAT5 signaling pathway
- Effect: Stimulates proliferation, differentiation, and survival of erythroid progenitors; accelerates maturation from BFU-E through reticulocyte release
- Negative feedback: As RBC mass increases and oxygen delivery improves, EPO secretion falls
Mutations in the EPO receptor that prevent binding of the phosphatase SHP-1 result in sustained JAK2/STAT5 activation and polycythemia, as the receptor cannot be inactivated.
B. Growth Factors and Cytokines
| Factor | Role |
|---|---|
| IL-3 | Stimulates early progenitors (BFU-E); acts synergistically with EPO |
| IL-4 | Promotes MEP differentiation toward erythroid lineage |
| Stem Cell Factor (SCF) | Acts on early progenitors to support survival |
| GM-CSF | Supports early myeloid progenitor expansion |
| GATA-1 transcription factor | Master transcription factor for erythroid commitment; required for MEP differentiation |
C. Iron and Hepcidin
- Iron is essential for hemoglobin synthesis; its availability limits erythropoiesis
- Hepcidin (produced by liver) is the master regulator of iron homeostasis:
- Inhibits ferroportin on enterocytes and macrophages, reducing iron release into plasma
- Increased by: IL-6 (inflammation), iron loading
- Decreased by: EPO, iron deficiency, erythroferrone (released by erythroid precursors)
- When erythropoiesis is stimulated, erythroid precursors secrete erythroferrone, which suppresses hepcidin, allowing more iron absorption
D. Other Regulators
- Androgens: Stimulate EPO production (explains higher RBC count in males)
- Thyroid hormone: Increases EPO sensitivity; hypothyroidism causes mild anemia
- Corticosteroids: Generally stimulate erythropoiesis
- Vitamin B12 and Folate: Required for DNA synthesis during rapid cell division; deficiency causes megaloblastic anemia
E. Feedback Summary
Tissue Hypoxia
↓
Kidney senses low O₂
↓
EPO secretion ↑
↓
BFU-E/CFU-E stimulated → Erythroid maturation → More RBCs
↓
O₂ delivery improves
↓
EPO secretion ↓ (negative feedback)
4. Note on Iron Deficiency Anemia (IDA)
Definition
Iron deficiency anemia is the most common nutritional disorder in the world, resulting from inadequate iron for hemoglobin synthesis, leading to hypochromic microcytic anemia.
Iron Metabolism (Normal)
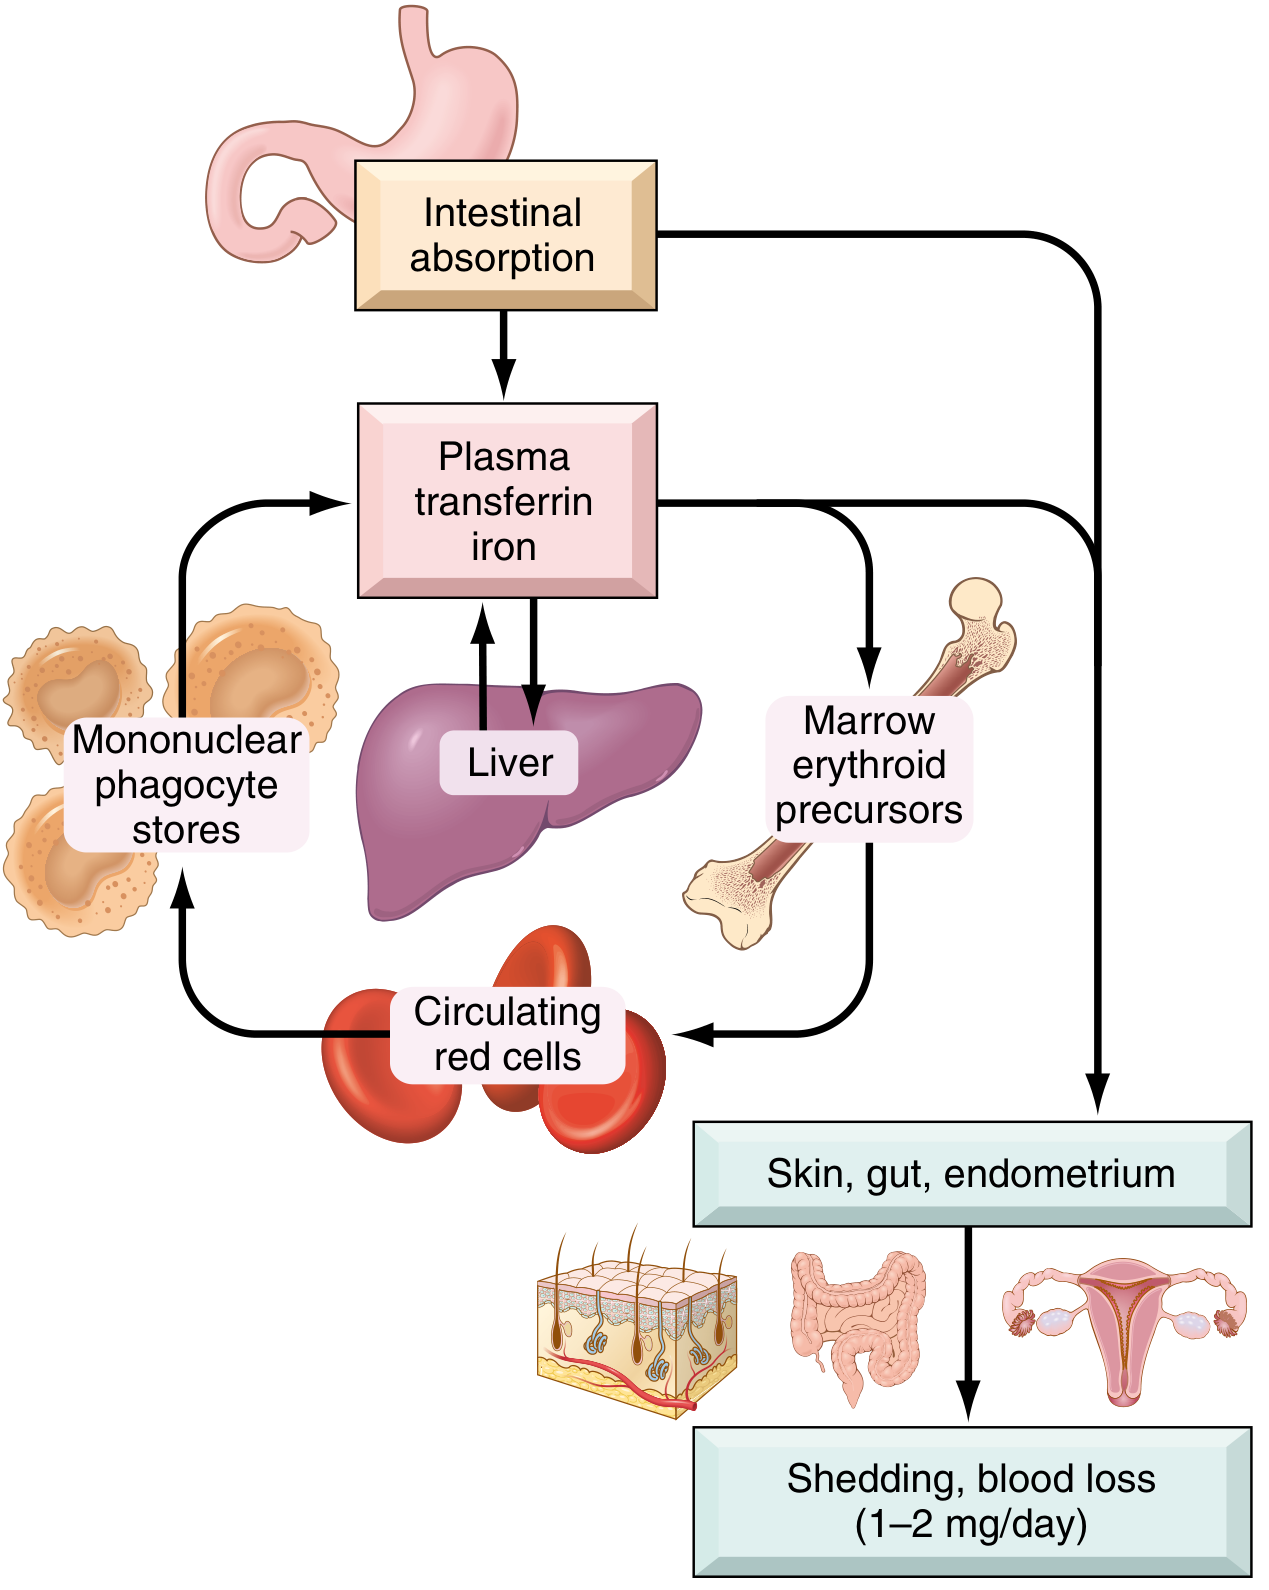
- Total body iron: ~3,450 mg in males; ~2,450 mg in females
- Functional pool: Hemoglobin (2,100 mg), myoglobin (300 mg), enzymes (catalase, cytochromes)
- Storage pool: Ferritin (in hepatocytes/macrophages) and hemosiderin
- Transport: Transferrin carries iron from gut → bone marrow → erythroid precursors (via transferrin receptor-mediated endocytosis)
- Daily intake needed: ~1-2 mg absorbed; dietary intake is 10-20 mg/day; only 1-2% of non-heme iron and ~20% of heme iron is absorbed
Etiology (Causes)
Iron deficiency can result from:
- Dietary lack: Rare in high-resource countries; common in infants (breast milk provides only 0.3 mg/L iron), vegans, elderly with restricted diets
- Impaired absorption: Malabsorption (celiac/sprue, steatorrhea), gastrectomy (reduced acidity in duodenum), H. pylori infection, dietary inhibitors (tannins, oxalates, phosphates, carbonates)
- Increased requirement: Pregnancy, infants/children/adolescents (rapid growth), premenopausal women
- Chronic blood loss: Most common cause in developed countries - GI bleeding (peptic ulcer, carcinoma, hookworm), menorrhagia, urinary tract bleeding
In adult males and postmenopausal females, iron deficiency almost always indicates GI blood loss, which must be investigated to exclude colorectal carcinoma.
Pathogenesis
Progressive depletion occurs in three stages:
| Stage | Storage Iron | Serum Iron / Ferritin | Transferrin Saturation | Anemia |
|---|---|---|---|---|
| Pre-latent | Decreased | Normal | Normal | None |
| Latent | Absent | Decreased | <20% | None |
| Manifest IDA | Absent | Very low | <15% | Present (microcytic, hypochromic) |
Mechanism: Iron deficiency → inadequate heme synthesis → small amounts of Hgb per cell → cells continue to divide → smaller (microcytic) and paler (hypochromic) RBCs.
Morphology
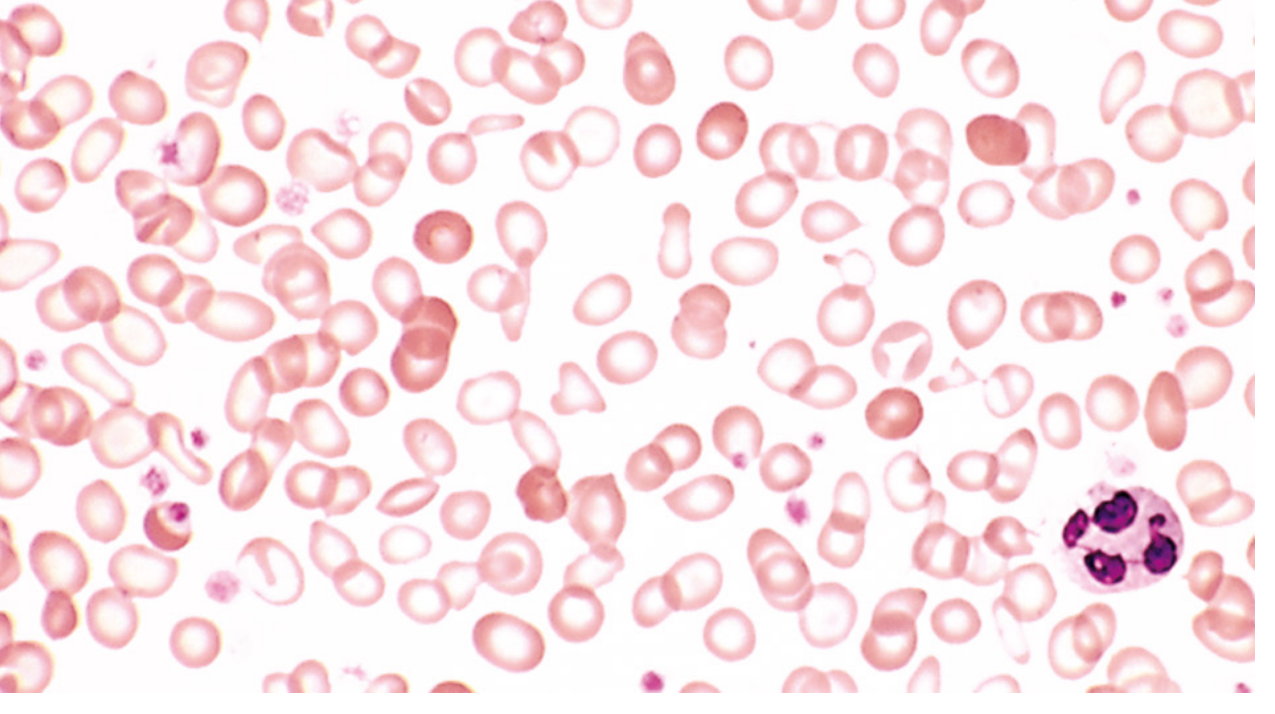
- Peripheral blood: Microcytic, hypochromic RBCs; zone of central pallor enlarged (normally 1/3 cell diameter; in IDA, Hgb seen only at narrow rim)
- Poikilocytosis: "Pencil cells" (elongated red cells) are characteristic
- Bone marrow: Mild-moderate increase in erythroid progenitors; absent stainable iron in macrophages on Prussian blue stain (diagnostically significant)
Clinical Features
Anemia-related:
- Fatigue, pallor, exertional dyspnea, palpitations, headache
Iron depletion-related (non-hematologic):
- Koilonychia (spoon-shaped nails)
- Alopecia (hair loss)
- Atrophic glossitis (smooth, sore tongue)
- Angular stomatitis (cracking at mouth corners)
- Pica (craving for non-food items: clay, ice [pagophagia], flour)
- Gastric mucosal atrophy and intestinal malabsorption
- Plummer-Vinson syndrome (rare triad): microcytic hypochromic anemia + atrophic glossitis + esophageal webs
Laboratory Diagnosis
| Test | Finding in IDA |
|---|---|
| Hemoglobin/Hematocrit | Decreased |
| MCV | Low (<80 fL) - microcytic |
| MCH | Low (<27 pg) - hypochromic |
| Serum iron | Low |
| Serum ferritin | Low (<12 µg/L) |
| TIBC (Total Iron Binding Capacity) | High (reflects elevated transferrin) |
| Transferrin saturation | <15% |
| Serum hepcidin | Low (reduced iron stores suppress hepcidin) |
| Reticulocyte count | Low (initially) |
| Peripheral smear | Microcytic, hypochromic, pencil cells |
Treatment
- Oral iron supplementation: Ferrous sulfate 325 mg TDS (elemental iron ~65 mg/dose); taken on an empty stomach with vitamin C to enhance absorption
- Response: Reticulocytosis appears within 5-7 days; followed by steady rise in Hgb and normalization of red cell indices
- Duration: Continue for 3-6 months after Hgb normalization to replenish iron stores
- Parenteral iron: For those with malabsorption, intolerance to oral iron, or ongoing blood loss
- Treat underlying cause: Identify and treat the source of blood loss or deficiency
Sources
- Histology: A Text and Atlas with Correlated Cell and Molecular Biology, pp. 736-746
- Basic Medical Biochemistry: A Clinical Approach, 6e, p. 1536
- Robbins, Cotran & Kumar Pathologic Basis of Disease, pp. 612-615
This is a shared conversation. Sign in to Orris to start your own chat.