
A 32-year-old male with history of multiple sex partners is admitted with complaints of unexplained fever, progressive loss of weight, persistent diarrhoea and generalized lymphadenopathy for the past 6 months. a) What is the most probable diagnosis? b) Discuss the pathogenesis, clinical manifestation and laboratory diagnosis of the above condition
HIV AIDS pathogenesis CD4 T cell depletion diagram
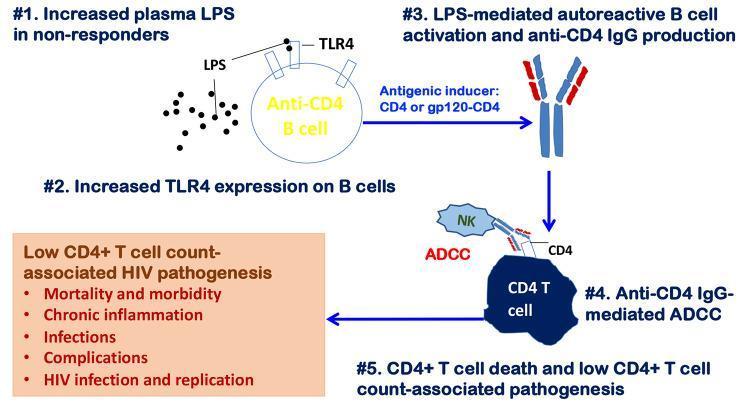
This pathophysiology diagram illustrates the mechanism of autoimmune-mediated CD4+ T cell depletion in people with HIV (PWH). The process is depicted in five numbered stages: (1) Increased plasma lipopolysaccharide (LPS) in non-responders, representing microbial translocation. (2) Upregulation of TLR4 expression on anti-CD4 B cells. (3) LPS-mediated B cell activation leading to the production of anti-CD4 IgG autoantibodies, stimulated by CD4 or gp120-CD4 complexes. (4) These autoantibodies bind to CD4 T cells, recruiting Natural Killer (NK) cells to perform antibody-dependent cell-mediated cytotoxicity (ADCC). (5) Resultant CD4+ T cell death and subsequent low CD4+ T cell counts. A summary box highlights the clinical consequences of this pathway, including chronic inflammation, increased infections, and HIV-associated morbidity and mortality. This diagram serves as an educational model for immune reconstitution failure despite antiretroviral therapy (ART).
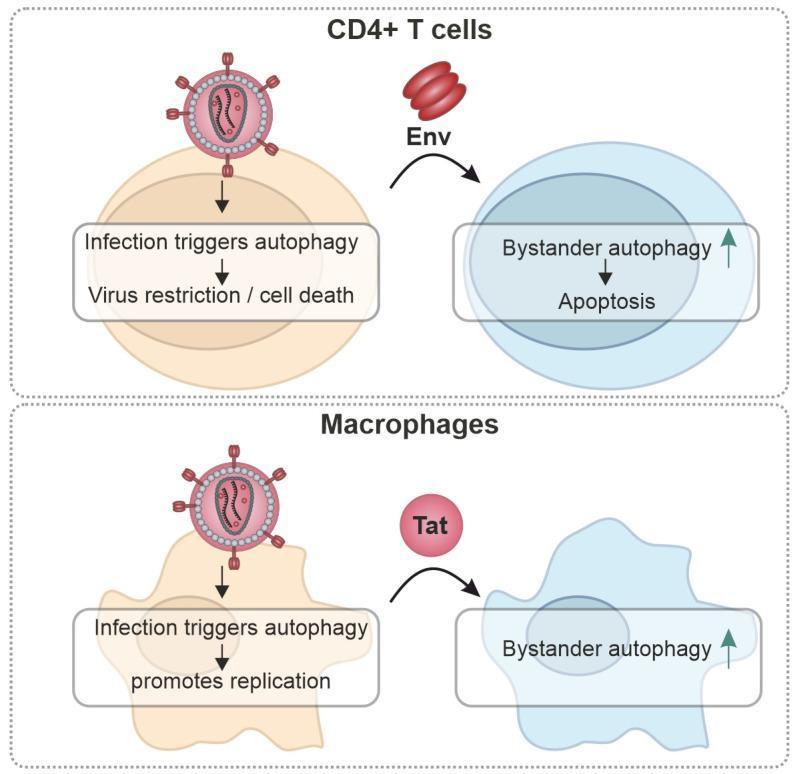
This pathophysiology diagram illustrates the cell-type-specific roles of autophagy during HIV-1 infection in CD4+ T cells and Macrophages. The diagram is divided into two horizontal sections. The top section (CD4+ T cells) shows that direct infection triggers an antiviral autophagy response, leading to virus restriction and cell death. Simultaneously, released viral Envelope (Env) proteins interact with uninfected 'bystander' CD4+ T cells, inducing bystander autophagy and subsequent apoptosis. The bottom section (Macrophages) depicts a contrasting mechanism: in these cells, infection-triggered autophagy is hijacked to promote viral replication rather than restriction. Additionally, secreted Tat proteins are shown modulating autophagy in bystander macrophages. The HIV-1 virion is represented as a spherical particle with surface envelope trimers and a central cone-shaped capsid. The figure highlights the dual nature of autophagy as both a host defense mechanism in lymphoid cells and a proviral pathway in myeloid cells, emphasizing clinical concepts of immune depletion and viral persistence.
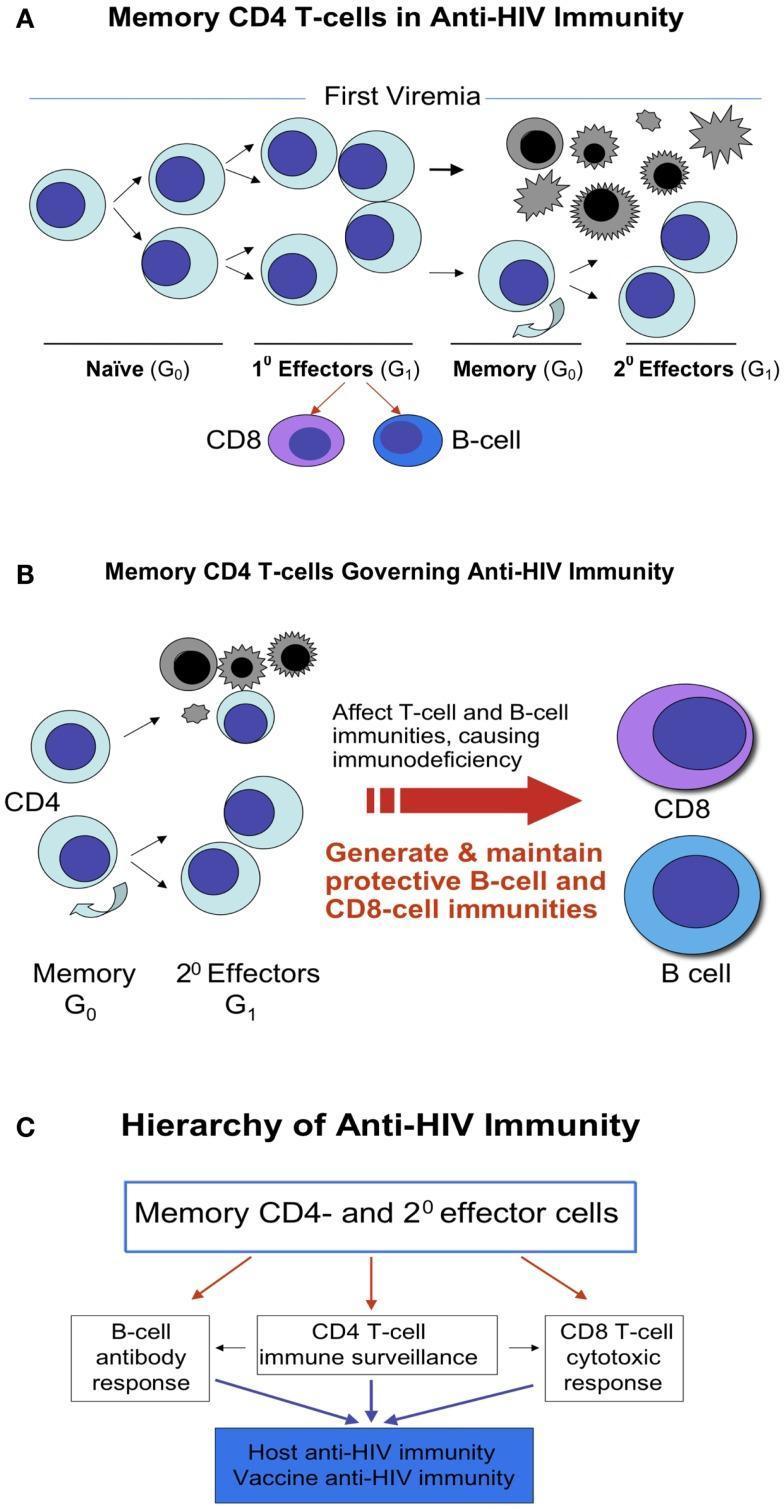
This medical illustration depicts the role and differentiation of memory CD4 T-cells in anti-HIV immunity across three panels. Panel A (Memory CD4 T-cells in Anti-HIV Immunity) shows the lineage from Naïve (G0) CD4 cells following first viremia, differentiating into 1st Effectors (G1). These further progress into Memory (G0) cells or 2nd Effectors (G1), with some cells undergoing apoptosis due to viral infection. It indicates CD4-dependent help for CD8 T-cells and B-cells. Panel B (Memory CD4 T-cells Governing Anti-HIV Immunity) illustrates the recall response where memory CD4 cells differentiate upon re-encountering HIV, highlighting their role in generating and maintaining protective B-cell and CD8-cell immunities, while noting that CD4 depletion causes immunodeficiency. Panel C (Hierarchy of Anti-HIV Immunity) presents a flow diagram positioning Memory CD4 and 2nd effector cells at the apex of a hierarchy. They regulate a B-cell antibody response, CD4 T-cell immune surveillance, and CD8 T-cell cytotoxic response, which collectively constitute host and vaccine anti-HIV immunity. The diagram emphasizes the 'commander-in-chief' role of CD4 memory cells in orchestrating both cellular and humoral immune responses.
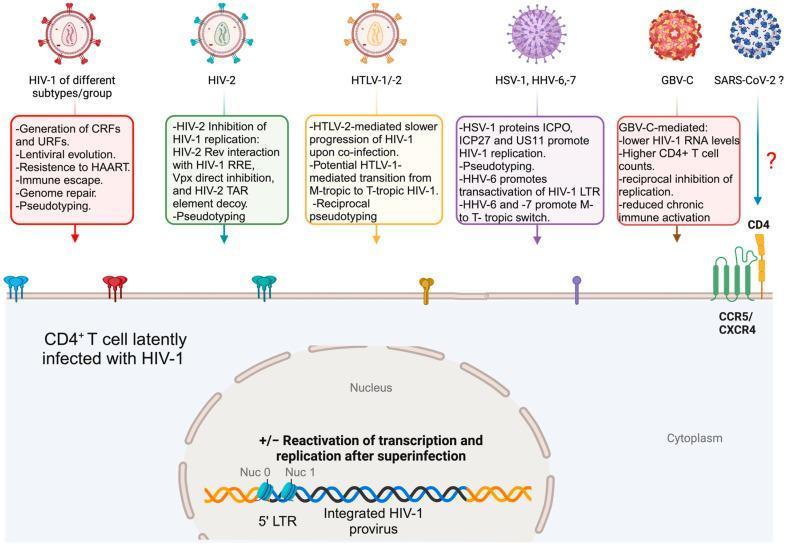
This pathophysiology diagram illustrates the viral superinfection and co-infection dynamics within a CD4+ T cell latently infected with HIV-1. The top section presents various superinfecting viruses: HIV-1 subtypes, HIV-2, HTLV-1/2, HSV-1, HHV-6/7, GBV-C, and SARS-CoV-2. Each virus is depicted with its specific morphology, accompanied by text boxes detailing clinical outcomes such as pseudotyping, generation of recombinant forms (CRFs/URFs), and modulation of HIV-1 replication (e.g., HIV-2 and GBV-C mediated inhibition versus HSV-1 mediated promotion). The central portion shows the T cell membrane featuring CD4 receptors and CCR5/CXCR4 co-receptors. The lower section focuses on the nucleus, showing host genomic DNA (yellow double helix) with integrated HIV-1 provirus DNA (blue/black double helix). The molecular architecture of the HIV-1 5' Long Terminal Repeat (LTR) is highlighted between nucleosomes Nuc 0 and Nuc 1, representing the site for potential transcriptional reactivation following superinfection. The diagram effectively summarizes how secondary viral infections can influence HIV-1 pathogenesis and the latent reservoir.
A 3 year old boy was admitted to the hospital with complaints of high-grade fever, headache, vomiting, altered mental status, seizure and neck rigidity. CSF sample was collected by lumbar puncture in a sterile container and sent to the laboratory for biochemical analysis, direct microscopic test, culture and sensitivity testing a) What is the probable clinical diagnosis? b) What are the etiological agents, pathogenesis and clinical manifestations of this disease? c) Describe the laboratory diagnosis in detail. d) What are the treatment modalities according to the etiological agents?
bacterial meningitis CSF lumbar puncture diagnosis
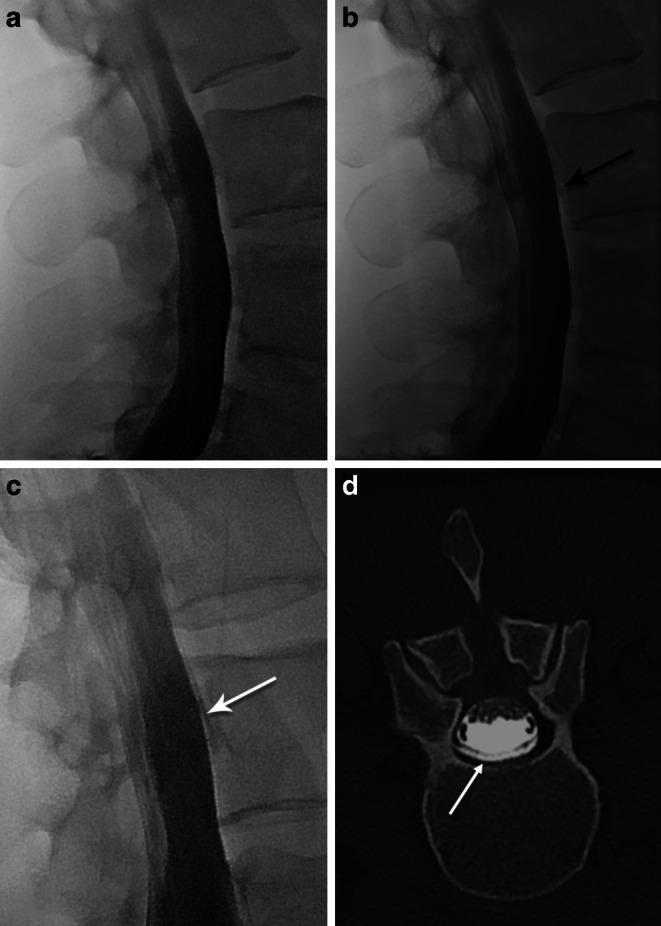
This composite figure illustrates the diagnosis of a cerebrospinal fluid (CSF) leak using dynamic myelography and computed tomography (CT) in a patient with post-dural puncture headache. Panels (a-c) show a temporal sequence of lateral fluoroscopic myelography images in the lumbar spine. Panel (a) demonstrates an initial radiopaque column of contrast medium confined within the thecal sac. Panel (b) reveals the emergence of contrast leakage into the epidural space at the level of the L3 vertebral body (indicated by a black arrow). Panel (c) shows the cranial progression of the extrathecal contrast within the epidural space over time (white arrow). Panel (d) provides a transverse postmyelography CT scan at the lumbar level, confirming the presence of hyperdense contrast medium residing within the epidural space, positioned posterior to the vertebral body and surrounding the thecal sac. This imaging series demonstrates the clinical utility of dynamic myelography in identifying and localizing iatrogenic dural breaches and subsequent epidural CSF collections.
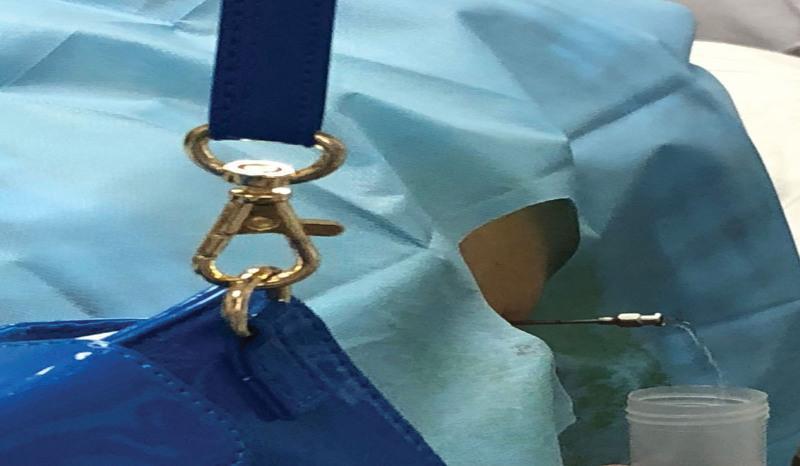
This clinical procedural photograph illustrates a subarachnoid puncture, commonly referred to as a lumbar puncture, being performed for cerebrospinal fluid (CSF) collection or drainage. The image shows a spinal needle inserted into the lumbar region of a patient, specifically at the L2-L3 interspace. The procedural site is prepared with sterile blue surgical drapes. A key clinical finding is the visualization of clear, colorless fluid (CSF) dripping from the hub of the spinal needle into a sterile collection container, confirming successful entry into the subarachnoid space. This visual evidence of 'free-flow' is critical for diagnostic sampling and therapeutic pressure management. The photograph demonstrates proper aseptic technique and the lateral approach for accessing the lumbar cistern. It serves as an educational tool for medical students and clinicians to recognize the appearance of CSF during neurosurgical or neurological procedures, highlighting the correct anatomical positioning and procedural outcomes in a clinical setting.
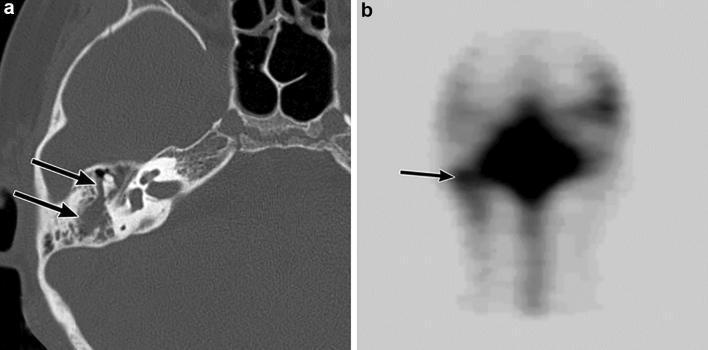
This composite educational image demonstrates a cerebrospinal fluid (CSF) leak into the right temporal bone in a pediatric patient with recurrent bacterial meningitis. Panel A is an axial computed tomography (CT) scan of the temporal bone in a bone window. It shows opacification of the right middle ear and mastoid air cells due to soft tissue density fluid collection (black arrows), contrasting with the normally air-filled spaces. While no acute fracture is visible, the findings suggest a traumatic or congenital pathway for CSF. Panel B displays a radionuclide cisternography scan following lumbar administration of a tracer. A focal area of increased radionuclide accumulation is clearly visible in the region of the right middle ear and mastoid cells (black arrow), providing definitive functional evidence of a CSF leak. The image highlights the diagnostic synergy between anatomical imaging (CT) and functional imaging (nuclear medicine cisternography) in identifying predisposing conditions for meningitis, such as post-traumatic skull base defects.
meningitis neck rigidity Kernig Brudzinski sign clinical examination
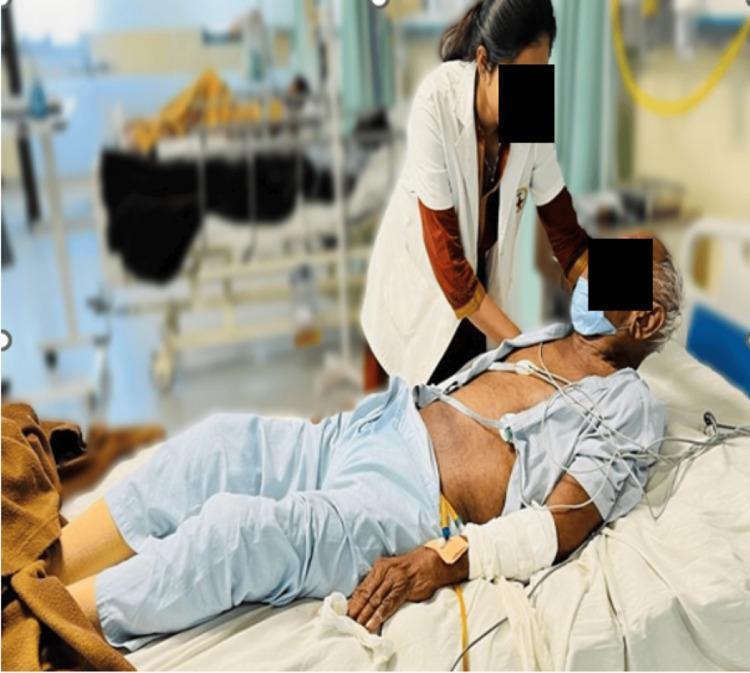
Clinical photograph demonstrating the elicitation of Brudzinski's sign in a supine patient, indicative of meningeal irritation or neck rigidity. A healthcare professional is shown performing passive flexion of the patient's neck. The positive sign is evidenced by the involuntary flexion of the patient's hips and knees in response to the neck movement. The patient is situated in a hospital bed with visible monitoring equipment, including ECG leads on the chest and an intravenous (IV) line in the left arm. This clinical maneuver is essential in the neurological physical examination for suspected meningitis or tuberculous meningitis (TBM). The photograph captures the classic postural response associated with meningismus, serving as an educational resource for medical students and practitioners on neurological assessment techniques.

This educational infographic serves as a public health outreach poster for a meningitis vaccination campaign. The visual content features a clinical photograph of an African American individual shown from the back, holding their neck in a gesture indicative of nuchal rigidity (neck stiffness) and physical distress. The poster uses a high-contrast color scheme of dark gradients, yellow, and red to highlight clinical symptoms and preventative measures. Key educational text identifies 'high fever, stiffness, and body aches' as hallmark symptoms of meningitis, a serious bacterial or viral inflammation of the protective membranes covering the brain and spinal cord. The poster promotes the meningitis vaccine as a primary prevention strategy. It is categorized as a public health communication tool for infectious disease control, specifically targeting serogroup C meningococcal disease awareness. The educational focus is on symptom recognition and the importance of immunization in high-risk populations.
This clinical photograph displays a forensic internal examination of the neck structures, focusing on the carotid artery. The primary image and a smaller inset both use a white arrow to highlight Amussat's sign: a minimal, horizontal, transversal intimal tear located on the inner layer of the left common carotid artery. The artery appears as a pale, tubular structure, while the surrounding strap muscles and soft tissues exhibit deep red discoloration and hemorrhagic staining. This finding is a classic forensic indicator of mechanical neck trauma, often associated with hanging or strangulation, resulting from the sudden stretching of the vessel walls. The visual context includes the dissected neck area, revealing the relationship between the vascular pathology and the surrounding muscular and cartilaginous structures of the throat.
Acute Bacterial Meningitis - Complete Analysis
a) Most Probable Clinical Diagnosis
b) Etiological Agents, Pathogenesis, and Clinical Manifestations
Etiological Agents (Age-Based)
| Age Group | Common Etiological Agents |
|---|---|
| < 1 month (neonates) | Group B Streptococcus, Escherichia coli, Listeria monocytogenes |
| 1-23 months | S. pneumoniae, N. meningitidis, GBS (S. agalactiae), H. influenzae |
| 2+ years (this child) | S. pneumoniae (most common), N. meningitidis, H. influenzae type b |
| Adults >55 / immunocompromised | S. pneumoniae, L. monocytogenes, gram-negative bacilli |
- The Harriet Lane Handbook (23rd ed.), Table 17.2
Pathogenesis
-
Increased BBB permeability → cerebral edema (vasogenic and cytotoxic)
-
Cerebral vasculitis and thrombosis
-
Raised intracranial pressure (ICP)
-
Decreased cerebral blood flow → cerebral hypoxia and ischemia
-
Rosen's Emergency Medicine, p. 2268; Goldman-Cecil Medicine, p. 4001
Clinical Manifestations
- Neck rigidity (nuchal rigidity) - resistance to passive neck flexion
- Kernig's sign - inability to straighten the leg when hip is flexed to 90 degrees (tests meningeal stretch)
- Brudzinski's sign - involuntary flexion of hips and knees when the neck is passively flexed
- High-grade fever (usually rapid onset)
- Severe headache (due to raised ICP and meningeal inflammation)
- Projectile vomiting (raised ICP)
- Photophobia and phonophobia
- Altered mental status - confusion, obtundation, progressing to coma
- Seizures (generalized or focal - from cortical irritation, vasculitis, or electrolyte disturbances)
- Papilledema (raised ICP - seen in some cases)
- N. meningitidis: classic petechial or purpuric rash (non-blanching) due to septicemia and DIC - a medical emergency
- S. pneumoniae: often preceded by otitis media, sinusitis, or pneumonia
- H. influenzae: often preceded by upper respiratory tract infection
c) Laboratory Diagnosis
1. Lumbar Puncture and CSF Analysis (Gold Standard)
CSF Biochemical Analysis
| Parameter | Normal | Bacterial | Viral | Tuberculous | Fungal |
|---|---|---|---|---|---|
| Opening pressure | 10-20 cm H₂O | >20 cm H₂O | <20 | >20 | <20 |
| WBC count | <5 cells/μL | >1000/μL (PMN predominance) | 5-500 (lymphocytes) | 100-500 (lymphocytes) | 5-500 |
| Protein | 20-40 mg/dL | >100 mg/dL | 50-150 | >100 | >100 |
| Glucose | 40-60 mg/dL | <10 mg/dL (severely low) | Normal | 10-45 mg/dL | 10-45 |
| CSF:serum glucose ratio | >0.6 | <0.4 | Normal | <0.4 | <0.4 |
- Goldman-Cecil Medicine, Table (p. 4003)
- Turbid (cloudy) or purulent appearance
- Markedly elevated opening pressure
- Polymorphonuclear (neutrophilic) pleocytosis - thousands of cells
- High protein (>100 mg/dL) from BBB disruption
- Very low glucose (<10 mg/dL) due to bacterial consumption and impaired transport
- Elevated lactic acid (>3.5 mmol/L supports bacterial etiology)
2. Direct Microscopic Examination
- S. pneumoniae: gram-positive diplococci (lancet-shaped)
- N. meningitidis: gram-negative diplococci (kidney bean-shaped, intracellular)
- H. influenzae: gram-negative coccobacilli (pleomorphic)
- L. monocytogenes: gram-positive short rods (can mimic diphtheroids)
- E. coli: gram-negative rods
3. Culture and Sensitivity Testing
- Reveals etiologic agent in 80-90% of patients if obtained before or within 1-2 hours of antibiotics
- Organisms are plated on Blood agar, Chocolate agar (for H. influenzae, N. meningitidis), MacConkey agar (for gram-negatives)
- Sensitivity testing guides targeted antibiotic therapy
- Sensitivity drops sharply after antibiotic administration
4. Rapid Antigen Detection Tests
- Latex agglutination / Immunochromatographic tests - detect capsular polysaccharide antigens of S. pneumoniae, N. meningitidis, H. influenzae type b, Group B Streptococcus, and E. coli K1 directly in CSF (and urine/serum)
- Results in minutes
- Useful when Gram stain is negative or after antibiotic pre-treatment
- Sensitivity ~60-90% depending on the organism
5. Molecular Diagnostics (PCR)
-
Turnaround time: ~1.5 hours
-
Sensitivity: 87-100%; Specificity: 98-100%
-
Detects N. meningitidis, S. pneumoniae, E. coli, L. monocytogenes, H. influenzae, S. agalactiae
-
Also detects viral pathogens (enterovirus, HSV) simultaneously, allowing antibiotic cessation if viral cause confirmed
-
Extremely useful post-antibiotic therapy when cultures may be negative
-
Metagenomic DNA sequencing identifies rare organisms
-
Goldman-Cecil Medicine, p. 4002
6. Other Tests
d) Treatment Modalities by Etiological Agent
Initial Management (Do Not Delay!)
Empirical Antibiotic Therapy by Age
| Age/Setting | Empirical Regimen |
|---|---|
| < 1 month | Ampicillin + Cefotaxime |
| 1-3 months | Ampicillin + Cefotaxime or Ceftriaxone |
| >3 months (this child) and adults <55 | Vancomycin + Ceftriaxone (or Cefotaxime or Cefepime) |
| Adults >55 / debilitating illness | Ampicillin + Ceftriaxone + Vancomycin |
| Post-surgical / nosocomial | Ampicillin + Ceftazidime (or Meropenem) + Vancomycin |
- Harrison's Principles of Internal Medicine 22E, antibiotic table
Targeted Therapy Once Organism Identified
| Organism | First-Line Treatment | Alternative |
|---|---|---|
| S. pneumoniae (PCN-susceptible) | Penicillin G (20-24 million U/d IV, q4h) or Amoxicillin | Cefotaxime, Ceftriaxone |
| S. pneumoniae (PCN-resistant) | Ceftriaxone/Cefotaxime + Vancomycin | Meropenem + Vancomycin |
| N. meningitidis | Penicillin G or Ampicillin | Ceftriaxone, Cefotaxime, Chloramphenicol |
| H. influenzae type b (β-lactamase negative) | Ampicillin | Ceftriaxone, Cefotaxime |
| H. influenzae type b (β-lactamase positive) | Ceftriaxone or Cefotaxime | Chloramphenicol |
| L. monocytogenes | Ampicillin + Gentamicin | Trimethoprim-sulfamethoxazole |
| Group B Streptococcus | Penicillin G + Gentamicin | Ampicillin + Gentamicin |
| E. coli / gram-negative | Ceftriaxone or Cefotaxime | Meropenem |
| M. tuberculosis | RHEZ (Rifampicin + Isoniazid + Ethambutol + Pyrazinamide) x 2 months, then RH x 10 months + Dexamethasone | - |
| Cryptococcus neoformans | Amphotericin B + Flucytosine (induction), then Fluconazole (maintenance) | - |
- Goldman-Cecil Medicine; Harrison's 22E; Harriet Lane 23rd ed.
Supportive Care
- IV fluid management (avoid over-hydration - risk of cerebral edema; treat SIADH)
- Anticonvulsants (Phenobarbitone / Levetiracetam) for seizure control
- Antipyretics (Paracetamol)
- Monitor ICP; mannitol for raised ICP if needed
- ICU monitoring for critically ill children
Chemoprophylaxis for Contacts
- N. meningitidis: Rifampicin (10 mg/kg q12h x 2 days) or single-dose Ciprofloxacin (adults) or Ceftriaxone (IM) for close contacts
- H. influenzae type b: Rifampicin for household contacts with unvaccinated children <4 years
| Feature | Bacterial | Viral | Tuberculous | Fungal |
|---|---|---|---|---|
| Appearance | Turbid/purulent | Clear | Clear/xanthochromic | Clear |
| Cells | >1000 PMNs | 5-500 lymphocytes | 100-500 lymphocytes | 5-500 lymphocytes |
| Protein | Very high (>100) | Mildly raised | High (>100) | High |
| Glucose | Very low (<10) | Normal | Low (10-45) | Low |
| Gram stain | Positive (60-90%) | Negative | Negative | Negative |
| India Ink | Negative | Negative | Negative | Positive (Crypto) |
| ZN stain | Negative | Negative | Positive | Negative |
| Culture | +ve in 80-90% | Negative | Slow (weeks) | Positive |
Sources: Goldman-Cecil Medicine (International Edition), Rosen's Emergency Medicine, Harrison's Principles of Internal Medicine 22E, The Harriet Lane Handbook (23rd ed.), Henry's Clinical Diagnosis and Management by Laboratory Methods, Jawetz Medical Microbiology 28E.