
POWER POINT PRESENTATION FOR POST GRADUATE INTERNAL MEDICINE STUDENTS ON Hormone classes, receptors, intracellular signaling • Feedback mechanisms, circadian rhythms, endocrine tesEng principles • Clinical correlaEon: interpreEng abnormal hormone assays
hormone receptor signaling pathway G protein cAMP diagram
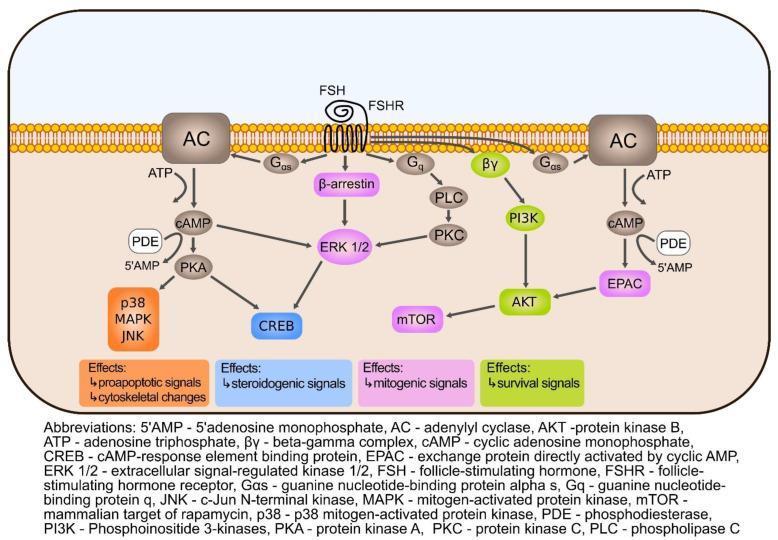
This pathophysiology diagram illustrates the intracellular signaling pathways triggered by Follicle-Stimulating Hormone (FSH) binding to its G-protein coupled receptor (FSHR) on a cell membrane. The diagram demonstrates several divergent signaling cascades: 1) The canonical Gαs/adenylate cyclase (AC) pathway where ATP is converted to cAMP, subsequently activating Protein Kinase A (PKA) and CREB, as well as EPAC. 2) The Gq/Phospholipase C (PLC) and Protein Kinase C (PKC) pathway. 3) The β-arrestin mediated activation of ERK 1/2. 4) The βγ/PI3K/AKT/mTOR survival pathway. These cascades are categorized by their educational significance into four color-coded outcomes: orange (proapoptotic signals and cytoskeletal changes involving p38, MAPK, and JNK), blue (steroidogenic signals via CREB), purple (mitogenic signals via mTOR), and green (survival signals via AKT). The diagram also notes the regulatory role of phosphodiesterase (PDE) in hydrolyzing cAMP to 5'AMP to terminate the signal.
![A pathophysiology diagram illustrating the intracellular signaling pathways activated by the Calcitonin Gene-Related Peptide (CGRP) receptor. The receptor is depicted as a heterodimeric complex within the plasma membrane, consisting of the Calcitonin Receptor-Like Receptor (CLR) and the Receptor Activity Modifying Protein 1 (RAMP1), assisted by the Receptor Component Protein (RCP). The diagram shows G-protein coupling leading to three primary cascades: 1) The Gαq pathway activating Phospholipase C (PLC), which generates DAG and IP3, leading to Ca2+ release and activation of PKC and CaMKII. 2) The Gαs pathway stimulating Adenylyl Cyclase (AC) to produce cAMP, which activates ERK and PKA. 3) The Gαi pathway providing inhibitory regulation of AC and interaction with K+ channels. Downstream effects include the activation of transcription factors like CREB and Elk-1, and increased Nitric Oxide [NO] via NOS. The diagram also illustrates β-arrestin-mediated receptor internalization into endosomes. These pathways collectively result in metabolic adaptations and modulation of gene expression.](https://cdn.orris.care/cdss_images/pmc_clinical_VQA_1ea2b01c870596986c688f1acb5b922b94b6ad3fe6916d7833e785133262dd66.jpg)
A pathophysiology diagram illustrating the intracellular signaling pathways activated by the Calcitonin Gene-Related Peptide (CGRP) receptor. The receptor is depicted as a heterodimeric complex within the plasma membrane, consisting of the Calcitonin Receptor-Like Receptor (CLR) and the Receptor Activity Modifying Protein 1 (RAMP1), assisted by the Receptor Component Protein (RCP). The diagram shows G-protein coupling leading to three primary cascades: 1) The Gαq pathway activating Phospholipase C (PLC), which generates DAG and IP3, leading to Ca2+ release and activation of PKC and CaMKII. 2) The Gαs pathway stimulating Adenylyl Cyclase (AC) to produce cAMP, which activates ERK and PKA. 3) The Gαi pathway providing inhibitory regulation of AC and interaction with K+ channels. Downstream effects include the activation of transcription factors like CREB and Elk-1, and increased Nitric Oxide [NO] via NOS. The diagram also illustrates β-arrestin-mediated receptor internalization into endosomes. These pathways collectively result in metabolic adaptations and modulation of gene expression.
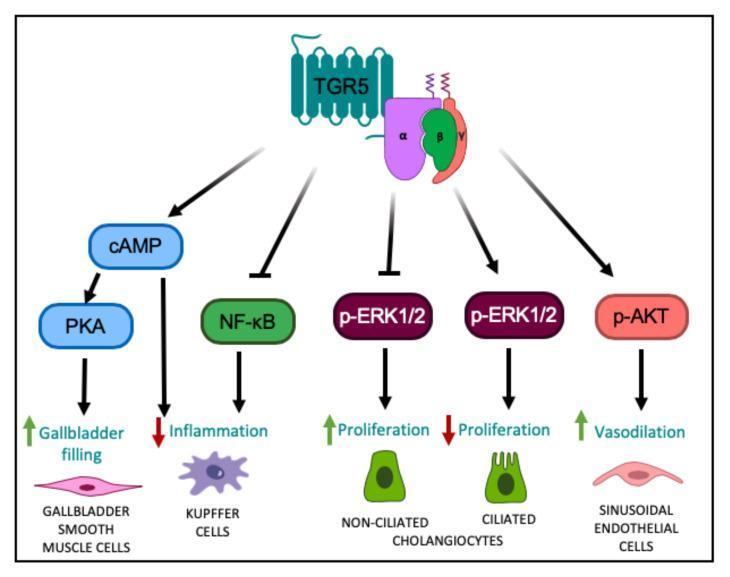
This pathophysiology diagram illustrates the TGR5-mediated cell signaling pathways across various hepatic and biliary cell types. At the top, the G protein-coupled receptor TGR5 is shown coupled with alpha, beta, and gamma subunits. Downstream signaling pathways are categorized by cell type: 1) In gallbladder smooth muscle cells, TGR5 activation increases cAMP and PKA levels, leading to increased gallbladder filling. 2) In Kupffer cells, the pathway increases cAMP but inhibits NF-kB, resulting in decreased hepatic inflammation. 3) In non-ciliated cholangiocytes, TGR5 inhibits p-ERK1/2 to stimulate cell proliferation, whereas in ciliated cholangiocytes, TGR5 activation promotes p-ERK1/2 to inhibit proliferation. 4) In liver sinusoidal endothelial cells, TGR5 activation increases p-AKT, resulting in enhanced vasodilation. The diagram utilizes standard symbols such as green upward arrows for activation/increase and red downward arrows for inhibition/decrease, providing a comprehensive overview of the pleiotropic effects of TGR5 signaling in liver physiology and pathophysiology.
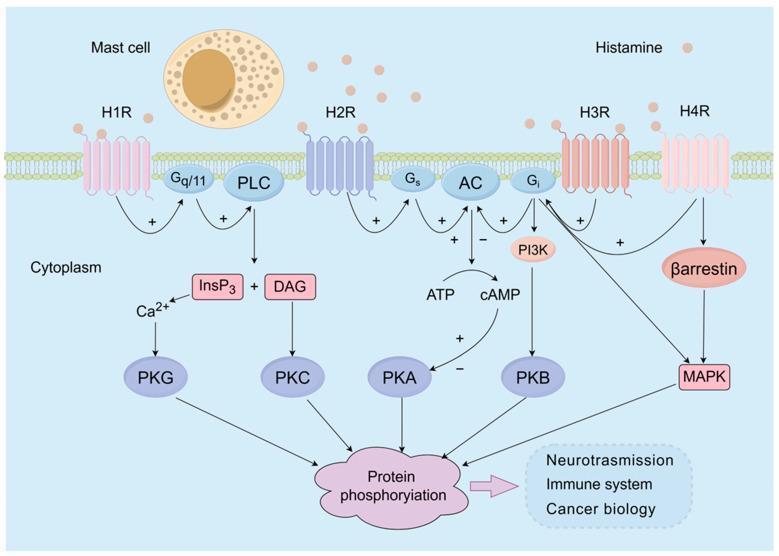
A pathophysiology diagram illustrating the intracellular signaling pathways mediated by the four histamine receptor subtypes (H1R, H2R, H3R, and H4R). The visual shows histamine molecules released from a mast cell binding to G protein-coupled receptors (GPCRs) embedded in a lipid bilayer. The H1R pathway is shown coupling with Gq/11 to activate Phospholipase C (PLC), generating Inositol trisphosphate (InsP3) and Diacylglycerol (DAG), which lead to calcium release and Protein Kinase C (PKC) activation. H2R couples with Gs proteins to stimulate Adenylate Cyclase (AC), increasing cAMP and activating Protein Kinase A (PKA). H3R and H4R couple with Gi proteins to inhibit AC or activate PI3K/PKB and MAPK pathways. Additional recruitment of β-arrestin by H4R is also depicted. The diagram concludes with the convergence of these kinases onto 'Protein phosphorylation,' highlighting downstream clinical effects in neurotransmission, the immune system, and cancer biology. This infographic serves as a medical educational resource for pharmacology and cellular biology.
negative feedback loop HPA axis hypothalamus pituitary adrenal cortisol
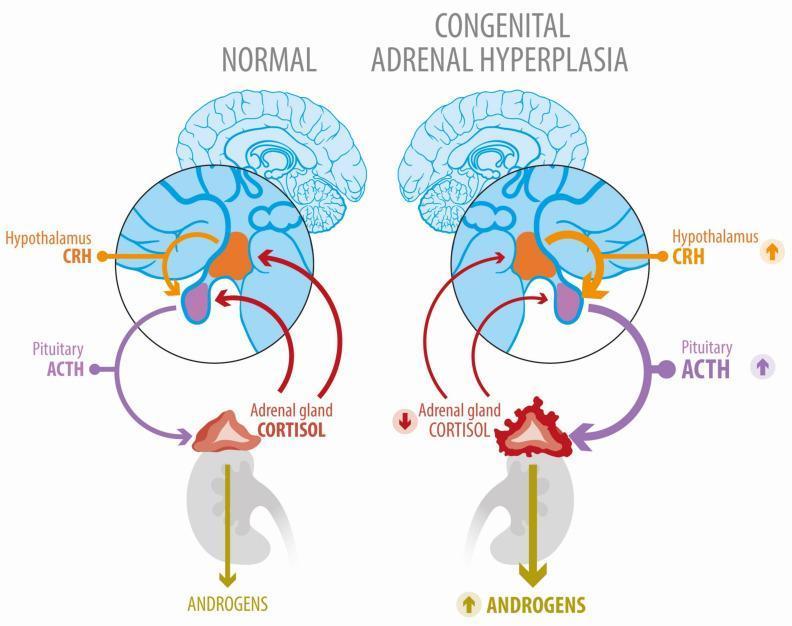
A comparative medical illustration of the Hypothalamic-Pituitary-Adrenal (HPA) axis under normal conditions and in Congenital Adrenal Hyperplasia (CAH). The 'Normal' panel displays a balanced feedback loop: the hypothalamus releases CRH to stimulate pituitary ACTH production, which in turn stimulates the adrenal gland to produce cortisol. Cortisol provides negative feedback to both the hypothalamus and pituitary. In the 'Congenital Adrenal Hyperplasia' panel, a block in the cortisol synthesis pathway (indicated by a downward red arrow) leads to reduced negative feedback. Consequently, the diagram shows compensatory increases in hypothalamic CRH and pituitary ACTH (upward purple and orange arrows). Visually, the adrenal gland in CAH is depicted as enlarged, irregular, and hyperplastic compared to the normal gland. This overstimulation by ACTH causes a metabolic shunt, resulting in significantly increased androgen production, represented by a thick, downward-pointing yellow arrow with an upward indicator. The diagram effectively illustrates the pathophysiology of 21-hydroxylase deficiency and the resulting secondary hyperandrogenism.
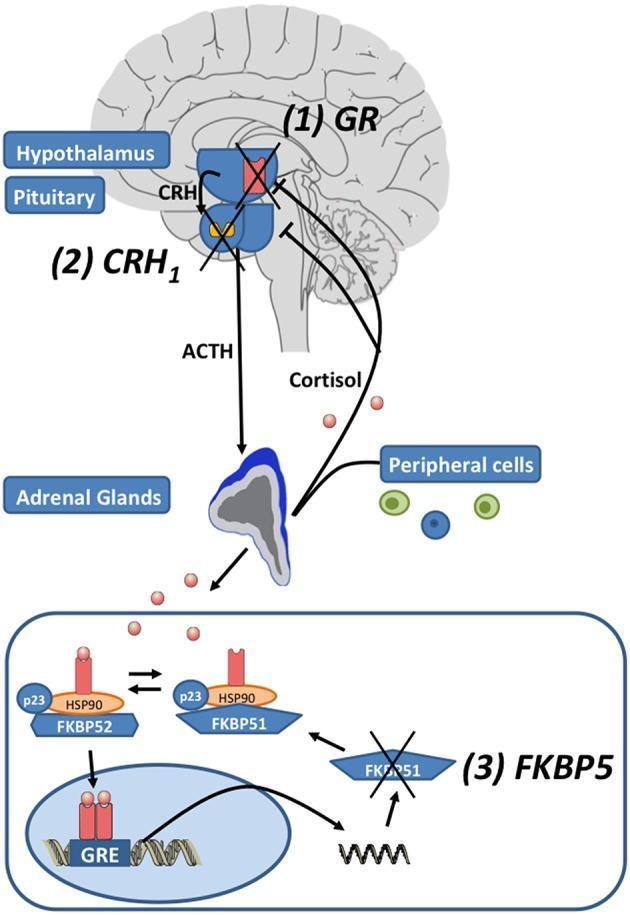
A multi-level pathophysiology diagram illustrating the hypothalamic-pituitary-adrenal (HPA) axis and the intracellular glucocorticoid receptor (GR) signaling pathway. The upper section shows the systemic feedback loop: the hypothalamus releases corticotropin-releasing hormone (CRH), acting on the pituitary gland’s CRH1 receptors to trigger adrenocorticotropic hormone (ACTH) secretion. ACTH stimulates the adrenal glands to release cortisol, which provides negative feedback to the brain. Pharmacological targets (1) GR, (2) CRH1, and (3) FKBP5 are marked with red 'X' symbols, indicating points of therapeutic inhibition. The lower section provides a detailed molecular view of GR regulation. It depicts the chaperone complex involving HSP90, p23, and the co-chaperones FKBP51 and FKBP52. The diagram illustrates that binding of cortisol facilitates an exchange of FKBP51 for FKBP52, allowing the ligand-bound GR to translocate into the nucleus. Within the nucleus, the GR binds to glucocorticoid response elements (GRE) on DNA to induce transcription, including the mRNA expression of FKBP5, which acts as an ultra-short negative feedback regulator of GR sensitivity.
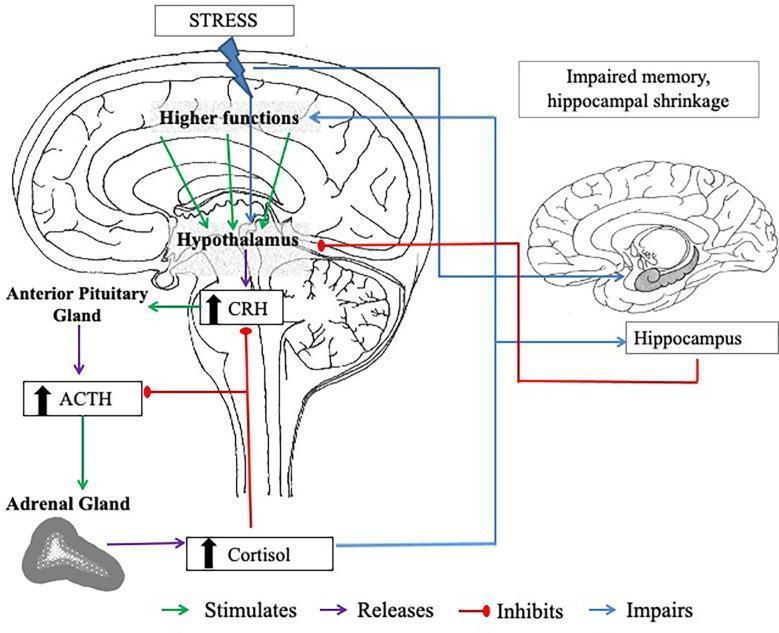
This pathophysiology diagram illustrates the hypothalamic-pituitary-adrenal (HPA) axis and its relationship with the hippocampus under chronic stress conditions. The left side depicts a sagittal section of the brain showing the 'Higher Functions' and the 'Hypothalamus' stimulating the 'Anterior Pituitary Gland' to release corticotropin-releasing hormone (CRH) and adrenocorticotropic hormone (ACTH). These hormones stimulate the 'Adrenal Gland' to secrete cortisol. A negative feedback loop is shown where cortisol inhibits further CRH and ACTH release. The right side of the diagram highlights the clinical impact of chronic cortisol elevation on the 'Hippocampus,' specifically illustrating hippocampal shrinkage and impaired memory. Color-coded arrows define functional relationships: green for stimulation, purple for release, red for inhibition, and blue for impairment. The illustration serves as an educational resource for understanding neuroendocrinology, the physiological stress response, and the long-term neurobiological effects of glucocorticoids on brain morphology and cognitive function.
steroid hormone nuclear receptor intracellular mechanism of action
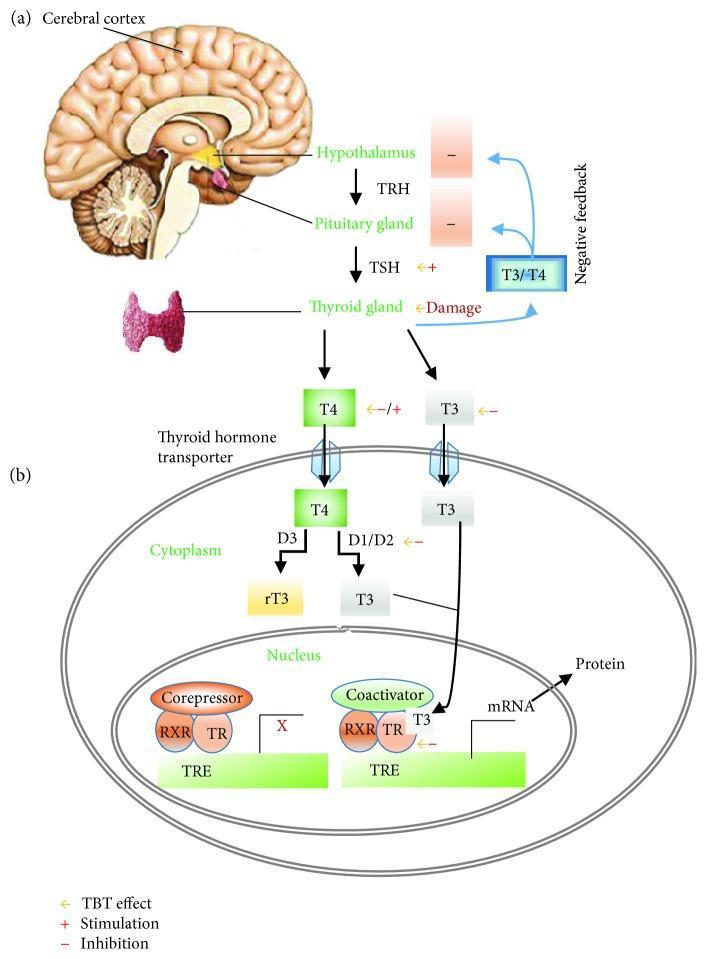
A two-part medical illustration depicting the pathophysiology of the Hypothalamic-Pituitary-Thyroid (HPT) axis and cellular thyroid hormone action. Section (a) shows the systemic HPT axis, beginning with the cerebral cortex and hypothalamus. The hypothalamus releases thyrotropin-releasing hormone (TRH), which stimulates the pituitary gland to secrete thyroid-stimulating hormone (TSH). TSH subsequently acts on the thyroid gland to stimulate the production of T4 and T3 hormones, which exert negative feedback on the hypothalamus and pituitary. Section (b) details the intracellular mechanism of action within a target cell. T4 and T3 enter the cell via thyroid hormone transporters. In the cytoplasm, deiodinases (D1/D2) convert T4 to T3, while D3 converts T4 to inactive reverse T3 (rT3). T3 enters the nucleus, binding to the thyroid hormone receptor (TR) which heterodimerizes with the retinoid X receptor (RXR). This complex binds to the thyroid hormone response element (TRE) on DNA, displacing corepressors and recruiting coactivators to initiate gene transcription (mRNA) and subsequent protein synthesis. The diagram also highlights potential sites of endocrine disruption (e.g., by Tributyltin/TBT), including receptor inhibition and deiodinase interference.
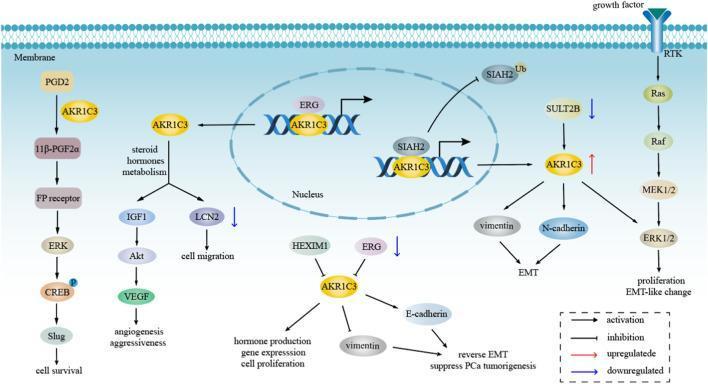
A pathophysiology diagram illustrating the intracellular signaling pathways of AKR1C3 in the context of cancer progression, specifically hormone-dependent tumors like prostate cancer. The diagram maps several concurrent pathways: 1) A growth factor-induced Receptor Tyrosine Kinase (RTK) pathway activating the Ras/Raf/MEK/ERK cascade leading to proliferation and EMT-like changes. 2) Prostaglandin metabolism where AKR1C3 converts PGD2 to 11β-PGF2α, signaling through the FP receptor/ERK/CREB/Slug axis to promote cell survival. 3) Steroid hormone metabolism where AKR1C3 influences IGF1/Akt/VEGF for angiogenesis and LCN2 for cell migration. 4) Nuclear interactions where AKR1C3 complexes with ERG and SIAH2 to modulate gene expression. 5) Cytoplasmic regulation where AKR1C3 upregulates vimentin and N-cadherin (promoting EMT) or downregulates E-cadherin to affect PCa tumorigenesis. The visual uses arrows to denote activation, T-bars for inhibition, and color-coded arrows for up/down-regulation, highlighting AKR1C3 as a central mediator of oncogenic signaling, epithelial-mesenchymal transition, and therapeutic resistance.
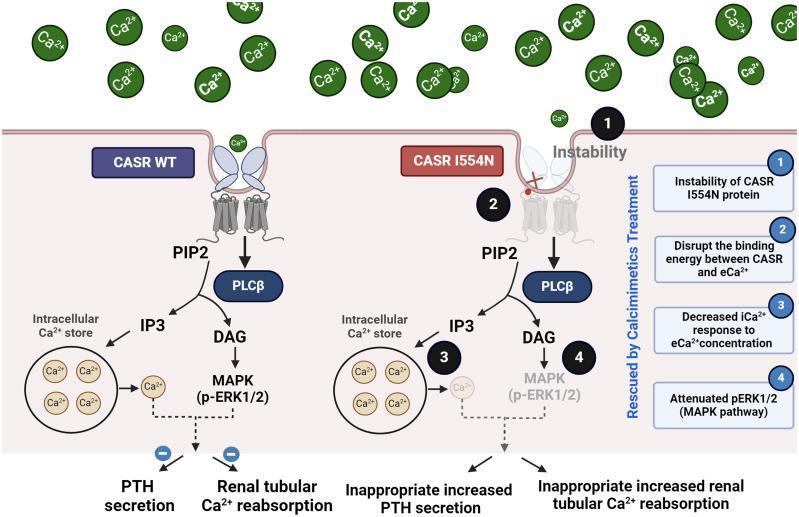
This pathophysiology diagram illustrates the molecular mechanism of the Calcium-Sensing Receptor (CASR) wild-type (WT) compared to the pathogenic I554N mutation. The left side (CASR WT) depicts normal signaling: extracellular calcium (eCa2+) binds to the intact receptor, activating the PLC̠ pathway (PIP2 to IP3 and DAG), which triggers intracellular calcium release and the MAPK (p-ERK1/2) pathway to inhibit Parathyroid Hormone (PTH) secretion and renal tubular calcium reabsorption. The right side (CASR I554N) highlights four pathological consequences: (1) protein instability, (2) disrupted binding energy between CASR and eCa2+, (3) decreased intracellular calcium (iCa2+) response, and (4) attenuated MAPK signaling. These defects lead to clinical manifestations of Familial Hypocalciuric Hypercalcemia type 1 (FHH1), specifically inappropriate increased PTH secretion and increased renal tubular calcium reabsorption. A vertical label indicates that this dysfunctional state can be 'Rescued by Calcimimetics Treatment.' The diagram serves as an educational tool for understanding G-protein coupled receptor (GPCR) dysfunction and calcium homeostasis disorders.
mkdir -p /tmp/workspace/endocrinology-pptx && ls /tmp/workspace/endocrinology-pptx/
~/endocrinology-pptx/build_pptx.py
from pptx import Presentation
from pptx.util import Inches, Pt, Emu
from pptx.dml.color import RGBColor
from pptx.enum.text import PP_ALIGN, MSO_ANCHOR
from pptx.util import Inches, Pt
import subprocess, json, base64
from io import BytesIO

# ── Colour palette ──────────────────────────────────────────────────────────
NAVY       = RGBColor(0x0A, 0x29, 0x55)   # dark navy – headers / accent
TEAL       = RGBColor(0x00, 0x7A, 0x8A)   # teal – subheadings
GOLD       = RGBColor(0xE5, 0xA8, 0x23)   # gold – key numbers / highlight
WHITE      = RGBColor(0xFF, 0xFF, 0xFF)
LIGHT_GREY = RGBColor(0xF0, 0xF4, 0xF8)
MID_GREY   = RGBColor(0xB0, 0xBE, 0xCE)
DARK_GREY  = RGBColor(0x33, 0x33, 0x33)
RED        = RGBColor(0xC0, 0x39, 0x2B)
GREEN      = RGBColor(0x1A, 0x7A, 0x4A)

prs = Presentation()
prs.slide_width  = Inches(13.333)
prs.slide_height = Inches(7.5)
blank = prs.slide_layouts[6]   # fully blank

# ── Helper utilities ────────────────────────────────────────────────────────

def add_rect(slide, x, y, w, h, fill=None, line_color=None, line_width=None):
    shape = slide.shapes.add_shape(1, Inches(x), Inches(y), Inches(w), Inches(h))
    shape.line.fill.background()
    if fill:
        shape.fill.solid()
        shape.fill.fore_color.rgb = fill
    else:
        shape.fill.background()
    if line_color:
        shape.line.color.rgb = line_color
        if line_width:
            shape.line.width = Pt(line_width)
        else:
            shape.line.width = Pt(1)
    else:
        shape.line.fill.background()
    return shape

def add_text(slide, text, x, y, w, h, size=18, bold=False, color=DARK_GREY,
             align=PP_ALIGN.LEFT, italic=False, wrap=True, v_anchor=MSO_ANCHOR.TOP):
    tb  = slide.shapes.add_textbox(Inches(x), Inches(y), Inches(w), Inches(h))
    tf  = tb.text_frame
    tf.word_wrap = wrap
    tf.vertical_anchor = v_anchor
    tf.margin_left = tf.margin_right = tf.margin_top = tf.margin_bottom = Pt(4)
    p   = tf.paragraphs[0]
    p.alignment = align
    run = p.add_run()
    run.text = text
    run.font.size   = Pt(size)
    run.font.bold   = bold
    run.font.italic = italic
    run.font.color.rgb = color
    return tb

def add_multiline(slide, lines, x, y, w, h, size=16, bold_first=False, color=DARK_GREY,
                  line_spacing=None, bullet=False):
    """lines: list of strings. bold_first bolds line[0]."""
    tb = slide.shapes.add_textbox(Inches(x), Inches(y), Inches(w), Inches(h))
    tf = tb.text_frame
    tf.word_wrap = True
    tf.margin_left = tf.margin_right = Pt(6)
    tf.margin_top = tf.margin_bottom = Pt(4)
    for i, line in enumerate(lines):
        if i == 0:
            p = tf.paragraphs[0]
        else:
            p = tf.add_paragraph()
        if bullet and i > 0:
            p.level = 1
        run = p.add_run()
        run.text = ("• " if bullet and i > 0 else "") + line
        run.font.size = Pt(size)
        run.font.bold = bold_first and (i == 0)
        run.font.color.rgb = color
        if line_spacing:
            p.line_spacing = Pt(line_spacing)
    return tb

def slide_header(slide, title, subtitle=None, title_size=30):
    # top navy bar
    add_rect(slide, 0, 0, 13.333, 1.1, fill=NAVY)
    add_text(slide, title, 0.3, 0.12, 12.7, 0.75,
             size=title_size, bold=True, color=WHITE, align=PP_ALIGN.LEFT,
             v_anchor=MSO_ANCHOR.MIDDLE)
    if subtitle:
        add_text(slide, subtitle, 0.3, 0.82, 12.7, 0.32,
                 size=14, color=GOLD, align=PP_ALIGN.LEFT)
    # light background
    add_rect(slide, 0, 1.1, 13.333, 6.4, fill=LIGHT_GREY)

def footer(slide, text="Department of Internal Medicine  |  Postgraduate Teaching Series"):
    add_rect(slide, 0, 7.15, 13.333, 0.35, fill=NAVY)
    add_text(slide, text, 0.3, 7.17, 13.0, 0.28,
             size=9, color=MID_GREY, align=PP_ALIGN.LEFT)

def section_box(slide, heading, bullets, x, y, w, h, heading_color=TEAL, bg=WHITE):
    add_rect(slide, x, y, w, h, fill=bg, line_color=MID_GREY, line_width=0.75)
    add_text(slide, heading, x+0.1, y+0.05, w-0.2, 0.38,
             size=14, bold=True, color=heading_color)
    content = "\n".join(f"  • {b}" for b in bullets)
    add_multiline(slide, [""] + bullets, x+0.15, y+0.45, w-0.25, h-0.55,
                  size=12, color=DARK_GREY, bullet=True)

# ═══════════════════════════════════════════════════════════════════════════
# SLIDE 1 – TITLE SLIDE
# ═══════════════════════════════════════════════════════════════════════════
slide = prs.slides.add_slide(blank)
add_rect(slide, 0, 0, 13.333, 7.5, fill=NAVY)
# decorative teal stripe
add_rect(slide, 0, 5.8, 13.333, 0.18, fill=TEAL)
add_rect(slide, 0, 5.98, 13.333, 0.06, fill=GOLD)

add_text(slide, "ENDOCRINE PHYSIOLOGY", 0.8, 1.2, 11.7, 0.8,
         size=20, bold=False, color=TEAL, align=PP_ALIGN.CENTER)
add_text(slide, "Hormone Classes, Receptors\n& Intracellular Signaling", 0.8, 2.0, 11.7, 1.5,
         size=40, bold=True, color=WHITE, align=PP_ALIGN.CENTER, v_anchor=MSO_ANCHOR.MIDDLE)
add_text(slide, "Feedback Mechanisms  •  Circadian Rhythms  •  Endocrine Testing  •  Clinical Correlation",
         0.8, 3.65, 11.7, 0.5,
         size=16, color=GOLD, align=PP_ALIGN.CENTER)
add_text(slide, "Postgraduate Internal Medicine Teaching Series\nDepartment of Medicine",
         0.8, 4.5, 11.7, 0.8,
         size=14, color=MID_GREY, align=PP_ALIGN.CENTER)
add_text(slide, "Source: Guyton & Hall Medical Physiology  |  Harrison's Principles of Internal Medicine 22e",
         0.8, 6.15, 11.7, 0.4,
         size=10, color=MID_GREY, align=PP_ALIGN.CENTER)

# ═══════════════════════════════════════════════════════════════════════════
# SLIDE 2 – LEARNING OBJECTIVES
# ═══════════════════════════════════════════════════════════════════════════
slide = prs.slides.add_slide(blank)
slide_header(slide, "Learning Objectives", "By the end of this session, participants will be able to:")
footer(slide)

objectives = [
    "Classify hormones by chemical structure and correlate structure with mechanism of action",
    "Describe receptor subtypes: ion-channel-linked, G protein-coupled, enzyme-linked, and intracellular nuclear receptors",
    "Explain second messenger cascades: cAMP/PKA, IP3/DAG/Ca²⁺, JAK-STAT, and nuclear receptor pathways",
    "Understand negative and positive feedback regulation, receptor up-regulation and down-regulation",
    "Interpret circadian and pulsatile hormone secretion patterns and their clinical significance",
    "Apply endocrine testing principles: basal vs. dynamic tests, stimulation vs. suppression protocols",
    "Interpret abnormal hormone assay results using paired hormone logic and dynamic test results",
]

for i, obj in enumerate(objectives):
    ypos = 1.25 + i * 0.77
    add_rect(slide, 0.35, ypos, 0.45, 0.55, fill=TEAL)
    add_text(slide, str(i + 1), 0.35, ypos, 0.45, 0.55,
             size=18, bold=True, color=WHITE, align=PP_ALIGN.CENTER, v_anchor=MSO_ANCHOR.MIDDLE)
    add_rect(slide, 0.85, ypos, 12.1, 0.6, fill=WHITE, line_color=MID_GREY, line_width=0.5)
    add_text(slide, obj, 0.95, ypos+0.04, 11.9, 0.52,
             size=13, color=DARK_GREY, v_anchor=MSO_ANCHOR.MIDDLE)

# ═══════════════════════════════════════════════════════════════════════════
# SLIDE 3 – HORMONE CLASSIFICATION OVERVIEW
# ═══════════════════════════════════════════════════════════════════════════
slide = prs.slides.add_slide(blank)
slide_header(slide, "Hormone Classes: Chemical Structure & Properties",
             "Three major chemical categories — structure governs solubility, transport and mechanism of action")
footer(slide)

# 3 columns
boxes = [
    ("PEPTIDE / PROTEIN HORMONES", NAVY,
     ["Synthesised on rough ER as pre-prohormones",
      "Cleaved to active form & stored in secretory vesicles",
      "Released by Ca²⁺-triggered exocytosis",
      "WATER-SOLUBLE — act on cell-surface receptors",
      "Short half-life (minutes)",
      "Examples: Insulin, GH, TSH, PTH, ADH, Oxytocin,",
      "  glucagon, ACTH, LH, FSH, GnRH, TRH"]),
    ("STEROID HORMONES", TEAL,
     ["Derived from cholesterol (3 cyclohexyl + 1 cyclopentyl ring)",
      "NOT stored — synthesised on demand",
      "Freely diffuse across cell membrane after synthesis",
      "LIPID-SOLUBLE — bind intracellular / nuclear receptors",
      "Long half-life (hours); travel bound to plasma proteins",
      "Examples: Cortisol, Aldosterone, Testosterone,",
      "  Estradiol, Progesterone, DHEA, Calcitriol (Vit D)"]),
    ("AMINE HORMONES", RGBColor(0x7B, 0x2D, 0x8B),
     ["Derived from tyrosine",
      "Thyroid hormones: lipophilic, nuclear receptors,",
      "  stored as thyroglobulin",
      "Catecholamines (Epi, NE, DA): hydrophilic,",
      "  stored in chromaffin granules, act at membrane Rs",
      "Thyroid hormones behave like steroids",
      "Catecholamines behave like peptides"]),
]

for col, (title, color, items) in enumerate(boxes):
    x = 0.35 + col * 4.32
    add_rect(slide, x, 1.2, 4.1, 0.45, fill=color)
    add_text(slide, title, x+0.1, 1.22, 3.9, 0.4,
             size=12, bold=True, color=WHITE, align=PP_ALIGN.CENTER, v_anchor=MSO_ANCHOR.MIDDLE)
    add_rect(slide, x, 1.65, 4.1, 5.3, fill=WHITE, line_color=color, line_width=1.5)
    for j, item in enumerate(items):
        add_text(slide, "• " + item, x+0.15, 1.75 + j*0.62, 3.85, 0.58,
                 size=11.5, color=DARK_GREY)

# ═══════════════════════════════════════════════════════════════════════════
# SLIDE 4 – HORMONE SYNTHESIS & TRANSPORT
# ═══════════════════════════════════════════════════════════════════════════
slide = prs.slides.add_slide(blank)
slide_header(slide, "Hormone Synthesis, Storage & Transport",
             "Key differences that explain half-life, drug design and assay interpretation")
footer(slide)

# Left panel - synthesis table
add_rect(slide, 0.3, 1.2, 7.8, 0.4, fill=NAVY)
for col_x, col_w, col_text in [(0.3, 2.6, "Property"), (2.9, 2.4, "Peptide"),
                                 (5.3, 1.4, "Steroid"), (6.7, 1.4, "Amine (TH)")]:
    add_text(slide, col_text, col_x+0.05, 1.22, col_w-0.1, 0.36,
             size=12, bold=True, color=WHITE, align=PP_ALIGN.CENTER)

rows = [
    ("Precursor",         "Pre-prohormone",     "Cholesterol",    "Tyrosine"),
    ("Storage",           "Secretory granules", "None (on demand)","Thyroglobulin"),
    ("Release trigger",   "Ca²⁺ exocytosis",    "Diffusion",      "Proteolysis/exo"),
    ("Plasma transport",  "Free (dissolved)",   "Binding proteins","TBG, albumin"),
    ("% free (active)",   "~100%",              "<10%",           "T4 <0.03%, T3 0.3%"),
    ("Half-life",         "Minutes",            "Hours",          "T3: 1d; T4: 7d"),
    ("Receptor location", "Cell membrane",      "Intracellular",  "Nuclear (TH)"),
]

row_colors = [WHITE, LIGHT_GREY]
for r, row in enumerate(rows):
    bg = row_colors[r % 2]
    y = 1.6 + r * 0.63
    add_rect(slide, 0.3, y, 7.8, 0.62, fill=bg)
    for c, (cx, cw, txt) in enumerate(zip([0.3, 2.9, 5.3, 6.7],
                                           [2.6, 2.4, 1.4, 1.4], row)):
        fw = True if c == 0 else False
        add_text(slide, txt, cx+0.08, y+0.06, cw-0.1, 0.5,
                 size=11, bold=fw, color=DARK_GREY)

# Right panel - clinical note
add_rect(slide, 8.4, 1.2, 4.6, 5.8, fill=RGBColor(0xEA, 0xF6, 0xFF), line_color=TEAL, line_width=1.5)
add_text(slide, "⚠  CLINICAL RELEVANCE", 8.55, 1.28, 4.35, 0.35,
         size=12, bold=True, color=TEAL)
notes = [
    ("Assay measures TOTAL vs FREE:",
     "Total T4 ↑ in pregnancy (↑TBG)\nbut free T4 normal → euthyroid"),
    ("Binding protein changes:",
     "↑Estrogen → ↑CBG → ↑total cortisol\nbut free cortisol normal"),
    ("Free fraction = bioactive:",
     "Measure FREE hormone\nwhen binding protein abnormal"),
    ("Protein-bound as reservoir:",
     "Steroid half-lives extend\nbecause bound pool buffers clearance"),
    ("Exocytosis impaired →",
     "Congenital hypothyroidism:\ndefective thyroglobulin cleavage"),
]
for i, (heading, body) in enumerate(notes):
    y = 1.72 + i * 1.0
    add_text(slide, heading, 8.6, y, 4.25, 0.3,
             size=11, bold=True, color=NAVY)
    add_text(slide, body, 8.6, y+0.3, 4.25, 0.62,
             size=11, color=DARK_GREY)

# ═══════════════════════════════════════════════════════════════════════════
# SLIDE 5 – RECEPTOR CLASSES
# ═══════════════════════════════════════════════════════════════════════════
slide = prs.slides.add_slide(blank)
slide_header(slide, "Hormone Receptor Classes",
             "Receptor type determines speed, duration & amplification of hormonal response")
footer(slide)

receptor_data = [
    ("ION CHANNEL-LINKED", TEAL,
     "Fast (ms)", "Neurotransmitters (ACh, GABA, glycine)",
     ["7-pass transmembrane or ligand-gated",
      "Binding opens/closes ion channel directly",
      "Fast signal — synaptic transmission",
      "Some hormones act indirectly via GPCRs"],
     "Myasthenia gravis: anti-nAChR Ab → neuromuscular block"),
    ("G PROTEIN-COUPLED (GPCR)", NAVY,
     "Seconds–minutes", "Glucagon, ACTH, TSH, LH, FSH, Epi (β), PTH",
     ["7 transmembrane segments (serpentine)",
      "Coupled to Gs/Gi/Gq trimeric proteins",
      "Gα subunit exchanges GDP for GTP on activation",
      "Amplification: 1 receptor → many G proteins → many cAMP"],
     "McCune-Albright: Gsα mutation → constitutive GPCR activation"),
    ("ENZYME-LINKED (RTK/JAK)", RGBColor(0x1A, 0x6A, 0x3A),
     "Minutes–hours", "Insulin, IGF-1, GH, EGF, Leptin",
     ["Single transmembrane domain",
      "Intrinsic tyrosine kinase (RTK) OR JAK-STAT system",
      "Autophosphorylation → docking of adaptor proteins",
      "Ras/MAPK and PI3K/Akt downstream"],
     "Type 2 DM: post-receptor insulin resistance (IRS-1 defect)"),
    ("INTRACELLULAR / NUCLEAR", RGBColor(0x8B, 0x44, 0x00),
     "Hours–days", "Steroids, T3/T4, Calcitriol, Retinoic acid",
     ["Lipophilic hormone crosses membrane freely",
      "Binds cytoplasmic or nuclear receptor",
      "Hormone-receptor complex → hormone response element (HRE)",
      "Activates/represses gene transcription → new protein synthesis"],
     "Androgen insensitivity: AR mutation → phenotypic female with XY karyotype"),
]

col_w = 3.18
for col, (rtype, color, speed, examples, mech, clinical) in enumerate(receptor_data):
    x = 0.22 + col * (col_w + 0.05)
    # header
    add_rect(slide, x, 1.18, col_w, 0.45, fill=color)
    add_text(slide, rtype, x+0.06, 1.2, col_w-0.12, 0.4,
             size=11, bold=True, color=WHITE, align=PP_ALIGN.CENTER, v_anchor=MSO_ANCHOR.MIDDLE)
    # speed badge
    add_rect(slide, x, 1.63, col_w, 0.32, fill=GOLD)
    add_text(slide, "⏱ " + speed, x+0.06, 1.65, col_w-0.12, 0.28,
             size=10, bold=True, color=NAVY, align=PP_ALIGN.CENTER)
    # examples
    add_rect(slide, x, 1.95, col_w, 0.45, fill=LIGHT_GREY)
    add_text(slide, examples, x+0.08, 1.97, col_w-0.12, 0.42,
             size=9.5, color=DARK_GREY, wrap=True)
    # mechanism points
    add_rect(slide, x, 2.4, col_w, 3.3, fill=WHITE, line_color=color, line_width=1)
    for j, pt in enumerate(mech):
        add_text(slide, "• " + pt, x+0.1, 2.48 + j*0.63, col_w-0.15, 0.6,
                 size=10.5, color=DARK_GREY)
    # clinical pearl
    add_rect(slide, x, 5.7, col_w, 1.1, fill=RGBColor(0xFF, 0xF5, 0xCC), line_color=GOLD, line_width=1)
    add_text(slide, "🔑 " + clinical, x+0.08, 5.75, col_w-0.15, 1.0,
             size=9.5, color=RGBColor(0x5A, 0x3A, 0x00), wrap=True)

# ═══════════════════════════════════════════════════════════════════════════
# SLIDE 6 – G PROTEIN SIGNALING (cAMP) with image
# ═══════════════════════════════════════════════════════════════════════════
slide = prs.slides.add_slide(blank)
slide_header(slide, "GPCR Signaling: cAMP Second Messenger Pathway",
             "The most common hormone signaling cascade — amplification through kinase cascades")
footer(slide)

# Download image
img_url = "https://cdn.orris.care/cdss_images/pmc_clinical_VQA_b5bba02846b06b60f3fe05f0b502b65030bb20fe41003ca3ec462dac25cda1f1.jpg"
try:
    result = json.loads(subprocess.check_output(
        ["python", "/tmp/skills/shared/scripts/fetch_images.py", img_url]
    ))
    if result[0]["base64"]:
        raw = base64.b64decode(result[0]["base64"].split(",", 1)[1])
        img_stream = BytesIO(raw)
        slide.shapes.add_picture(img_stream, Inches(7.4), Inches(1.2), Inches(5.7), Inches(5.8))
except Exception as e:
    print(f"Image fetch failed: {e}")

steps = [
    ("1. Hormone Binds GPCR",
     "Ligand binds extracellular domain → conformational change in 7-TM receptor"),
    ("2. G Protein Activation",
     "Receptor-G protein complex: Gα subunit exchanges GDP → GTP; Gα dissociates from Gβγ"),
    ("3. Adenylyl Cyclase Activation",
     "Gαs activates adenylyl cyclase → converts ATP → cAMP (amplification ×1000)"),
    ("4. Protein Kinase A",
     "cAMP binds regulatory subunits of PKA → releases active catalytic subunits"),
    ("5. Downstream Effects",
     "PKA phosphorylates target proteins → enzyme activation, channel gating, gene transcription (CREB)"),
    ("6. Signal Termination",
     "Phosphodiesterase (PDE) degrades cAMP → 5'-AMP; Gα hydrolyses GTP → GDP (intrinsic GTPase)"),
]

for i, (step, desc) in enumerate(steps):
    y = 1.22 + i * 1.02
    add_rect(slide, 0.25, y, 1.1, 0.85, fill=NAVY if i % 2 == 0 else TEAL)
    add_text(slide, step, 0.27, y+0.05, 1.05, 0.75,
             size=9, bold=True, color=WHITE, align=PP_ALIGN.CENTER, wrap=True, v_anchor=MSO_ANCHOR.MIDDLE)
    add_rect(slide, 1.38, y, 5.85, 0.88, fill=WHITE, line_color=MID_GREY, line_width=0.5)
    add_text(slide, desc, 1.48, y+0.08, 5.72, 0.72,
             size=11.5, color=DARK_GREY)

# Clinical box
add_rect(slide, 0.25, 7.02, 7.0, 0.45, fill=GOLD)
add_text(slide, "Clinical: Cholera toxin locks Gsα in active state → ↑↑ cAMP in enterocytes → ↑Cl⁻ secretion → secretory diarrhoea",
         0.35, 7.03, 6.8, 0.42, size=10, bold=False, color=NAVY)

# ═══════════════════════════════════════════════════════════════════════════
# SLIDE 7 – OTHER SECOND MESSENGERS (IP3/DAG + JAK-STAT)
# ═══════════════════════════════════════════════════════════════════════════
slide = prs.slides.add_slide(blank)
slide_header(slide, "Other Second Messenger Systems",
             "IP₃/DAG/Ca²⁺ via Gq, and JAK-STAT via cytokine/GH receptors")
footer(slide)

# Left: IP3/DAG system
add_rect(slide, 0.25, 1.2, 6.3, 0.45, fill=TEAL)
add_text(slide, "PHOSPHOLIPASE C — IP₃/DAG PATHWAY (Gq-coupled)", 0.35, 1.22, 6.1, 0.4,
         size=13, bold=True, color=WHITE, align=PP_ALIGN.CENTER)

ip3_steps = [
    ("Hormone binds Gq-coupled receptor",
     "e.g. GnRH, TRH, Angiotensin II, Vasopressin V1, α1-adrenergic"),
    ("Gαq activates Phospholipase C-β",
     "PLC-β cleaves PIP₂ → IP₃ + DAG"),
    ("IP₃ → Ca²⁺ release",
     "IP₃ binds ER membrane receptor → Ca²⁺ floods cytoplasm"),
    ("Ca²⁺ + Calmodulin → CaM-kinase",
     "CaM-kinase phosphorylates target proteins → cellular effects"),
    ("DAG activates Protein Kinase C",
     "PKC phosphorylates proteins (often synergistic with Ca²⁺)"),
]
for i, (step, desc) in enumerate(ip3_steps):
    y = 1.72 + i * 0.95
    add_rect(slide, 0.3, y, 0.95, 0.78, fill=TEAL)
    add_text(slide, str(i+1), 0.3, y+0.12, 0.95, 0.54,
             size=18, bold=True, color=WHITE, align=PP_ALIGN.CENTER)
    add_rect(slide, 1.28, y, 5.15, 0.8, fill=WHITE, line_color=TEAL, line_width=0.5)
    add_text(slide, step, 1.35, y+0.04, 5.0, 0.32, size=11, bold=True, color=TEAL)
    add_text(slide, desc, 1.35, y+0.34, 5.0, 0.4, size=10.5, color=DARK_GREY)

# Clinical box left
add_rect(slide, 0.3, 6.54, 6.25, 0.55, fill=RGBColor(0xFF, 0xF5, 0xCC), line_color=GOLD, line_width=1)
add_text(slide, "🔑 GnRH analogue pulsatile → LH/FSH release; CONTINUOUS GnRH agonist → receptor downregulation → castrate levels (prostate cancer Rx)",
         0.4, 6.56, 6.1, 0.5, size=10, color=RGBColor(0x5A, 0x3A, 0x00))

# Right: JAK-STAT
add_rect(slide, 6.85, 1.2, 6.2, 0.45, fill=NAVY)
add_text(slide, "JAK-STAT PATHWAY (Growth Hormone / Cytokine Receptors)", 6.95, 1.22, 6.0, 0.4,
         size=13, bold=True, color=WHITE, align=PP_ALIGN.CENTER)

jak_steps = [
    ("GH / cytokine binds receptor",
     "Receptor lacks intrinsic kinase — instead has associated JAK (Janus Kinase)"),
    ("JAK2 trans-phosphorylation",
     "Receptor dimerisation → JAK2 phosphorylates each other and the receptor"),
    ("STAT docking",
     "STAT proteins (Signal Transducers & Activators of Transcription) bind phosphotyrosine docking sites"),
    ("STAT dimerisation & nuclear import",
     "STATs dimerize, translocate to nucleus"),
    ("Gene transcription",
     "STATs bind GAS elements → transcription of growth-promoting, metabolic genes (IGF-1, SOCS)"),
    ("Negative regulation",
     "SOCS proteins (induced by STATs) inhibit JAK → negative feedback"),
]
for i, (step, desc) in enumerate(jak_steps):
    y = 1.72 + i * 0.88
    add_rect(slide, 6.9, y, 0.85, 0.72, fill=NAVY)
    add_text(slide, str(i+1), 6.9, y+0.1, 0.85, 0.52,
             size=18, bold=True, color=WHITE, align=PP_ALIGN.CENTER)
    add_rect(slide, 7.78, y, 5.0, 0.74, fill=WHITE, line_color=NAVY, line_width=0.5)
    add_text(slide, step, 7.85, y+0.04, 4.85, 0.28, size=11, bold=True, color=NAVY)
    add_text(slide, desc, 7.85, y+0.32, 4.85, 0.38, size=10, color=DARK_GREY)

add_rect(slide, 6.9, 6.54, 6.1, 0.55, fill=RGBColor(0xFF, 0xF5, 0xCC), line_color=GOLD, line_width=1)
add_text(slide, "🔑 Acromegaly: GH excess → ↑IGF-1; Somatostatin analogues ↓GH. Laron dwarfism: GHR mutation → ↑GH but ↓IGF-1",
         7.0, 6.56, 5.9, 0.5, size=10, color=RGBColor(0x5A, 0x3A, 0x00))

# ═══════════════════════════════════════════════════════════════════════════
# SLIDE 8 – NUCLEAR RECEPTOR PATHWAY with image
# ═══════════════════════════════════════════════════════════════════════════
slide = prs.slides.add_slide(blank)
slide_header(slide, "Nuclear Receptor Signaling — Steroid & Thyroid Hormones",
             "Slow but genomic effects — lasting hours to days; forms basis of steroid therapy & hormone replacement")
footer(slide)

img_url2 = "https://cdn.orris.care/cdss_images/pmc_clinical_VQA_6f82970f9f7319e651f853444406dd2b35b7feffc3334ebb3c549f9b030a044f.jpg"
try:
    result2 = json.loads(subprocess.check_output(
        ["python", "/tmp/skills/shared/scripts/fetch_images.py", img_url2]
    ))
    if result2[0]["base64"]:
        raw2 = base64.b64decode(result2[0]["base64"].split(",", 1)[1])
        img_stream2 = BytesIO(raw2)
        slide.shapes.add_picture(img_stream2, Inches(7.6), Inches(1.2), Inches(5.5), Inches(5.5))
except Exception as e:
    print(f"Image2 fetch failed: {e}")

nr_steps = [
    ("1", "Hormone enters cell", "Lipophilic → passive diffusion through plasma membrane", NAVY),
    ("2", "Receptor binding", "Binds cytoplasmic receptor (e.g. GR, AR, PR) or nuclear receptor (ER, TR, VDR)", TEAL),
    ("3", "Chaperone release", "Heat shock protein (HSP90) dissociates → receptor conformation change", RGBColor(0x1A, 0x6A, 0x3A)),
    ("4", "Nuclear translocation", "Hormone-receptor complex enters nucleus via importins", NAVY),
    ("5", "HRE binding", "Complex dimerises, binds Hormone Response Element (HRE) on DNA", TEAL),
    ("6", "Transcription", "Recruits co-activators (HAT) or co-repressors → ↑/↓ mRNA → protein synthesis", RGBColor(0x1A, 0x6A, 0x3A)),
]

for i, (num, title, desc, color) in enumerate(nr_steps):
    y = 1.22 + i * 1.0
    add_rect(slide, 0.25, y, 0.65, 0.85, fill=color)
    add_text(slide, num, 0.25, y+0.12, 0.65, 0.6, size=20, bold=True, color=WHITE, align=PP_ALIGN.CENTER)
    add_rect(slide, 0.95, y, 6.45, 0.88, fill=WHITE, line_color=color, line_width=1)
    add_text(slide, title, 1.05, y+0.04, 6.3, 0.33, size=12, bold=True, color=color)
    add_text(slide, desc, 1.05, y+0.38, 6.3, 0.45, size=11, color=DARK_GREY)

# Clinical pearls table bottom
add_rect(slide, 0.25, 7.02, 7.1, 0.42, fill=GOLD)
add_text(slide, "Clinical: Glucocorticoid resistance (rare GR mutation) | Androgen insensitivity (AR mutation) | Vit D-resistant rickets (VDR mutation)",
         0.35, 7.04, 6.9, 0.38, size=10, bold=False, color=NAVY)

# ═══════════════════════════════════════════════════════════════════════════
# SLIDE 9 – RECEPTOR UP/DOWN REGULATION
# ═══════════════════════════════════════════════════════════════════════════
slide = prs.slides.add_slide(blank)
slide_header(slide, "Receptor Regulation: Up-regulation & Down-regulation",
             "Dynamic receptor number and sensitivity — key to tachyphylaxis, desensitisation, and priming")
footer(slide)

# Two-column layout
add_rect(slide, 0.3, 1.2, 6.0, 0.45, fill=RED)
add_text(slide, "▼  DOWN-REGULATION", 0.4, 1.22, 5.8, 0.4,
         size=15, bold=True, color=WHITE, align=PP_ALIGN.CENTER)

down_pts = [
    "Prolonged ↑hormone → ↓receptor density",
    "Mechanisms:",
    "  1. Receptor inactivation (phosphorylation by GRK)",
    "  2. Inactivation of intracellular signaling molecules",
    "  3. Receptor sequestration (endocytosis to endosomes)",
    "  4. Receptor degradation by lysosomes",
    "  5. Decreased receptor gene transcription",
    "Net result: ↓target tissue responsiveness = desensitisation / tachyphylaxis",
]
add_rect(slide, 0.3, 1.65, 6.0, 5.4, fill=WHITE, line_color=RED, line_width=1.5)
for j, pt in enumerate(down_pts):
    add_text(slide, pt, 0.45, 1.72 + j*0.63, 5.75, 0.6,
             size=12, color=DARK_GREY, bold=(j == 0))

# Clinical examples down-regulation
add_rect(slide, 0.3, 6.88, 6.0, 0.58, fill=RGBColor(0xFF, 0xE5, 0xE5), line_color=RED, line_width=1)
add_text(slide, "🔑 Tachyphylaxis to β-agonist inhalers | Insulin resistance in obesity | Continuous GnRH agonist → hypogonadism",
         0.4, 6.9, 5.8, 0.52, size=10, color=RED)

# Right column - up-regulation
add_rect(slide, 7.0, 1.2, 6.0, 0.45, fill=GREEN)
add_text(slide, "▲  UP-REGULATION", 7.1, 1.22, 5.8, 0.4,
         size=15, bold=True, color=WHITE, align=PP_ALIGN.CENTER)

up_pts = [
    "Prolonged ↓hormone → ↑receptor density",
    "Mechanisms:",
    "  1. ↑ Receptor gene transcription",
    "  2. ↑ Receptor mRNA stability",
    "  3. ↓ Receptor degradation",
    "  4. Receptor sensitisation (hetrologous regulation)",
    "Net result: ↑target tissue responsiveness = hypersensitivity / priming",
    "Priming example: estrogen ↑ progesterone receptors in uterus",
]
add_rect(slide, 7.0, 1.65, 6.0, 5.4, fill=WHITE, line_color=GREEN, line_width=1.5)
for j, pt in enumerate(up_pts):
    add_text(slide, pt, 7.15, 1.72 + j*0.63, 5.75, 0.6,
             size=12, color=DARK_GREY, bold=(j == 0))

add_rect(slide, 7.0, 6.88, 6.0, 0.58, fill=RGBColor(0xE5, 0xFF, 0xF0), line_color=GREEN, line_width=1)
add_text(slide, "🔑 Castration ↑ GnRH receptors (used in GnRH challenge test) | Hypothyroidism → ↑TSH receptor sensitivity | Denervation supersensitivity",
         7.1, 6.9, 5.8, 0.52, size=10, color=GREEN)

# ═══════════════════════════════════════════════════════════════════════════
# SLIDE 10 – FEEDBACK MECHANISMS
# ═══════════════════════════════════════════════════════════════════════════
slide = prs.slides.add_slide(blank)
slide_header(slide, "Feedback Regulation of Hormone Secretion",
             "Negative feedback is the dominant homeostatic mechanism; positive feedback drives surges")
footer(slide)

# HPA image
img_url3 = "https://cdn.orris.care/cdss_images/pmc_clinical_VQA_e4ee6a6d54d84d4ab63ca8f27b0318b8a65b0d948bc16b12d37aae425eefefb7.jpg"
try:
    result3 = json.loads(subprocess.check_output(
        ["python", "/tmp/skills/shared/scripts/fetch_images.py", img_url3]
    ))
    if result3[0]["base64"]:
        raw3 = base64.b64decode(result3[0]["base64"].split(",", 1)[1])
        img_stream3 = BytesIO(raw3)
        slide.shapes.add_picture(img_stream3, Inches(8.2), Inches(1.2), Inches(4.9), Inches(5.8))
except Exception as e:
    print(f"Image3 fetch failed: {e}")

# Left panel - negative feedback
add_rect(slide, 0.25, 1.2, 7.7, 0.4, fill=NAVY)
add_text(slide, "NEGATIVE FEEDBACK (dominant mode)", 0.35, 1.22, 7.5, 0.36,
         size=13, bold=True, color=WHITE)

neg_pts = [
    ("Target hormone ↑ → inhibits upstream releasing hormone and trophic hormone",
     "e.g. Cortisol ↑ → inhibits CRH (hypothalamus) & ACTH (pituitary)"),
    ("Feedback occurs at multiple levels:",
     "Gene transcription, peptide synthesis, vesicle exocytosis, receptor sensitivity"),
    ("Short-loop feedback:",
     "Anterior pituitary hormone inhibits its own hypothalamic releasing hormone"),
    ("Ultra-short feedback:",
     "Hypothalamic hormone inhibits its own release (autocrine/paracrine)"),
    ("Long-loop feedback:",
     "Peripheral gland hormone inhibits hypothalamus AND pituitary"),
    ("Controlled variable may be tissue effect:",
     "Glucose level regulates insulin, not just plasma insulin concentration"),
]

for i, (title, detail) in enumerate(neg_pts):
    y = 1.65 + i * 0.88
    add_rect(slide, 0.25, y, 7.7, 0.85, fill=WHITE if i%2==0 else LIGHT_GREY, line_color=MID_GREY, line_width=0.3)
    add_text(slide, title, 0.35, y+0.04, 7.5, 0.33, size=11.5, bold=True, color=NAVY)
    add_text(slide, detail, 0.35, y+0.38, 7.5, 0.42, size=11, color=DARK_GREY)

# Positive feedback box
add_rect(slide, 0.25, 6.9, 7.7, 0.55, fill=RGBColor(0xFF, 0xF5, 0xCC), line_color=GOLD, line_width=1.5)
add_text(slide, "POSITIVE FEEDBACK: LH Surge — estrogen ↑ → LH ↑ → more estrogen → LH surge → ovulation  (self-amplifying until tipping point, then back to negative feedback)",
         0.35, 6.92, 7.5, 0.5, size=10, color=RGBColor(0x5A, 0x3A, 0x00))

# ═══════════════════════════════════════════════════════════════════════════
# SLIDE 11 – CIRCADIAN RHYTHMS
# ═══════════════════════════════════════════════════════════════════════════
slide = prs.slides.add_slide(blank)
slide_header(slide, "Circadian Rhythms & Pulsatile Hormone Secretion",
             "Master clock: suprachiasmatic nucleus (SCN) → drives 24-hour hormonal oscillations")
footer(slide)

# Description boxes
add_rect(slide, 0.25, 1.2, 12.8, 0.42, fill=NAVY)
add_text(slide, "SCN (suprachiasmatic nucleus) = master pacemaker → drives rhythmic secretion via neuroendocrine pathways and peripheral clocks in adrenal, pancreas, gonads",
         0.35, 1.22, 12.6, 0.38, size=11.5, color=WHITE)

# Hormone table
hormones_circ = [
    ("Cortisol",      "Peak: 6–8 AM (awakening); nadir midnight",
     "Sampling time critical — midnight cortisol for Cushing's\nLoss of rhythm = early sign of Cushing's syndrome"),
    ("ACTH",          "Pulsatile (15–30 min) + circadian (mirrors cortisol)",
     "Single low ACTH may be misleading — must pair with cortisol"),
    ("Growth Hormone","Peak: 30–90 min after sleep onset (NREM slow-wave)",
     "IGF-1 better reflects GH axis status than single GH level"),
    ("TSH",           "Peak: 2–4 AM; nadir: late afternoon",
     "TSH highest at night — illness/stress can suppress TSH acutely"),
    ("LH/FSH",        "Pulsatile (GnRH pulse every 60–90 min); menstrual cycle variation",
     "Mid-cycle LH surge diagnosis of ovulation; single LH unreliable"),
    ("Testosterone",  "Peak: 8–10 AM; ~20–25% diurnal variation",
     "Always measure morning fasting sample for diagnosis of hypogonadism"),
    ("Insulin",       "Post-prandial peaks; dawn phenomenon (↑GH/cortisol at dawn → ↑glucose)",
     "Dawn phenomenon vs Somogyi effect — different management"),
    ("Melatonin",     "Peak: 2–4 AM; suppressed by light",
     "Dim-light melatonin onset (DLMO) for circadian disorder assessment"),
]

col_heads = ["Hormone", "Circadian Pattern", "Clinical Implication"]
col_xs = [0.25, 2.3, 6.5]
col_ws = [2.0, 4.15, 6.5]
add_rect(slide, 0.25, 1.65, 12.85, 0.35, fill=TEAL)
for cx, cw, ch in zip(col_xs, col_ws, col_heads):
    add_text(slide, ch, cx+0.05, 1.67, cw-0.1, 0.3, size=11, bold=True, color=WHITE)

row_bg = [WHITE, LIGHT_GREY]
for r, (horm, pattern, clinical) in enumerate(hormones_circ):
    y = 2.0 + r * 0.66
    add_rect(slide, 0.25, y, 12.85, 0.64, fill=row_bg[r % 2])
    add_text(slide, horm, 0.3, y+0.06, 1.95, 0.52, size=11, bold=True, color=NAVY)
    add_text(slide, pattern, 2.35, y+0.06, 4.05, 0.52, size=10.5, color=DARK_GREY)
    add_text(slide, clinical, 6.55, y+0.06, 6.4, 0.52, size=10, color=RGBColor(0x1A, 0x5A, 0x3A))

# ═══════════════════════════════════════════════════════════════════════════
# SLIDE 12 – ENDOCRINE TESTING PRINCIPLES
# ═══════════════════════════════════════════════════════════════════════════
slide = prs.slides.add_slide(blank)
slide_header(slide, "Endocrine Testing Principles",
             "Basal measurement | Dynamic testing | Paired hormone logic — Harrison's 22e")
footer(slide)

# Three boxes across top
for box_x, box_title, box_color, box_items in [
    (0.25, "BASAL HORMONE LEVELS", NAVY,
     ["First-line in most disorders",
      "Use when hormones lie outside reference range",
      "Must consider: time of day, fasting state, medications",
      "Pulsatile hormones: single level often insufficient",
      "Binding protein changes affect total but not free levels",
      "Free hormone = biologically active fraction"]),
    (4.6, "STIMULATION TESTS", TEAL,
     ["Used to assess HYPOFUNCTION",
      "Principle: insufficient response = gland/axis failure",
      "ACTH stimulation test (Synacthen): adrenal insufficiency",
      "Insulin tolerance test: GH + cortisol reserve",
      "TRH stimulation: pituitary TSH reserve (now rarely used)",
      "GnRH test: LH/FSH pituitary reserve"]),
    (8.95, "SUPPRESSION TESTS", RGBColor(0xC0, 0x39, 0x2B),
     ["Used to assess HYPERFUNCTION",
      "Principle: failure to suppress = autonomous secretion",
      "1mg dexamethasone suppression test (DST): Cushing's",
      "Glucose suppression of GH: acromegaly",
      "Water load test: SIADH (dilution fails to suppress ADH)",
      "Salt loading: primary hyperaldosteronism"]),
]:
    add_rect(slide, box_x, 1.2, 4.1, 0.42, fill=box_color)
    add_text(slide, box_title, box_x+0.1, 1.22, 3.9, 0.38,
             size=12, bold=True, color=WHITE, align=PP_ALIGN.CENTER)
    add_rect(slide, box_x, 1.62, 4.1, 3.8, fill=WHITE, line_color=box_color, line_width=1.5)
    for j, pt in enumerate(box_items):
        add_text(slide, "• " + pt, box_x+0.15, 1.7 + j*0.6, 3.85, 0.56,
                 size=11, color=DARK_GREY)

# Bottom — key principles
add_rect(slide, 0.25, 5.5, 12.85, 0.35, fill=TEAL)
add_text(slide, "KEY INTERPRETATION PRINCIPLES (Harrison's 22e)", 0.35, 5.52, 12.6, 0.3,
         size=12, bold=True, color=WHITE)

principles = [
    ("Normal range is wide:",
     "2–10 fold variation; sex- and age-specific norms essential; use correct normative database"),
    ("Paired hormone logic:",
     "Interpret upstream:downstream ratio — e.g. low T + high LH = primary; low T + low LH = central"),
    ("Physiological variables:",
     "Sleep, meals, stress, posture, medications all alter hormone levels — standardise conditions"),
    ("Overlap zone:",
     "When basal values overlap normal, dynamic testing resolves ambiguity using feedback principles"),
]
for i, (heading, text) in enumerate(principles):
    y = 5.9 + i * 0.62
    add_rect(slide, 0.25, y, 12.85, 0.58, fill=LIGHT_GREY if i%2==0 else WHITE)
    add_text(slide, heading, 0.35, y+0.06, 2.5, 0.46, size=11, bold=True, color=NAVY)
    add_text(slide, text, 2.88, y+0.06, 10.1, 0.46, size=11, color=DARK_GREY)

# ═══════════════════════════════════════════════════════════════════════════
# SLIDE 13 – INTERPRETING ABNORMAL ASSAYS (PAIRED HORMONE LOGIC)
# ═══════════════════════════════════════════════════════════════════════════
slide = prs.slides.add_slide(blank)
slide_header(slide, "Interpreting Abnormal Hormone Assays: Paired Hormone Logic",
             "Step 1: identify the axis | Step 2: locate the lesion using upstream:downstream ratio")
footer(slide)

# Big table
headers = ["Clinical Scenario", "Key Hormone Pair", "Pattern", "Interpretation", "Next Step"]
col_xs = [0.25, 3.2, 5.8, 8.0, 11.1]
col_ws = [2.9, 2.55, 2.15, 3.05, 2.15]

add_rect(slide, 0.25, 1.2, 12.85, 0.38, fill=NAVY)
for cx, cw, ch in zip(col_xs, col_ws, headers):
    add_text(slide, ch, cx+0.05, 1.22, cw-0.1, 0.34, size=11, bold=True, color=WHITE, align=PP_ALIGN.CENTER)

rows_assay = [
    ("Suspected hypothyroidism", "TSH + Free T4", "TSH ↑, fT4 ↓", "Primary hypothyroidism", "Start levothyroxine"),
    ("Suspected hypothyroidism", "TSH + Free T4", "TSH ↓, fT4 ↓", "Central (pituitary) hypothyroidism", "MRI pituitary; panhypo screen"),
    ("Hypercalcaemia", "Ca²⁺ + PTH", "Ca²⁺ ↑, PTH ↑ (unsuppressed)", "Primary hyperparathyroidism", "Sestamibi scan; surgery"),
    ("Hypercalcaemia", "Ca²⁺ + PTH", "Ca²⁺ ↑, PTH ↓", "Malignancy / granuloma / Vit D tox", "PTHrP; 1,25 Vit D; PET/CT"),
    ("Hypogonadism (male)", "T + LH/FSH", "T ↓, LH ↑", "Primary hypogonadism (testicular)", "Karyotype; scrotal US"),
    ("Hypogonadism (male)", "T + LH/FSH", "T ↓, LH ↓/normal", "Secondary hypogonadism (HH)", "MRI pituitary; kallmann"),
    ("Hypercortisolism", "Cortisol + ACTH", "Cortisol ↑, ACTH ↑", "ACTH-dependent: Cushing's disease or ectopic", "High-dose DST; CRH stim; IPSS"),
    ("Hypercortisolism", "Cortisol + ACTH", "Cortisol ↑, ACTH ↓", "ACTH-independent: adrenal adenoma/carcinoma", "Adrenal CT/MRI"),
    ("Amenorrhoea", "LH + FSH + E2", "LH↑ FSH↑ E2↓", "Premature ovarian insufficiency", "Karyotype; anti-Müllerian Ab"),
    ("Suspected acromegaly", "GH + IGF-1", "GH not suppressed <1 µg/L post-OGTT", "Acromegaly confirmed", "MRI pituitary; somatostatin Rx"),
]

row_bg = [WHITE, LIGHT_GREY]
for r, row in enumerate(rows_assay):
    y = 1.58 + r * 0.56
    add_rect(slide, 0.25, y, 12.85, 0.54, fill=row_bg[r%2])
    for c, (cx, cw, txt) in enumerate(zip(col_xs, col_ws, row)):
        clr = RED if "↑" in txt and "↓" in txt else (RED if "↑" in txt else (GREEN if "↓" in txt else DARK_GREY))
        if c == 0:
            clr = DARK_GREY
        bold = c in [2, 3]
        add_text(slide, txt, cx+0.05, y+0.05, cw-0.1, 0.44,
                 size=10, color=clr, bold=bold)

# ═══════════════════════════════════════════════════════════════════════════
# SLIDE 14 – DYNAMIC TESTS DEEP DIVE
# ═══════════════════════════════════════════════════════════════════════════
slide = prs.slides.add_slide(blank)
slide_header(slide, "Key Dynamic Endocrine Tests — Protocol & Interpretation",
             "Clinical vignette approach: know the test, normal response, and failure pattern")
footer(slide)

tests = [
    ("Short Synacthen Test\n(SST / ACTH Stimulation)", NAVY,
     ["Indication: Suspected adrenal insufficiency",
      "Protocol: 250 µg synthetic ACTH IV/IM; cortisol at 0, 30, 60 min",
      "Normal: Peak cortisol ≥ 500 nmol/L (or ≥ 420 by some guidelines)",
      "Failure: Peak < threshold → primary or secondary AI",
      "Caveat: May miss ACUTE secondary AI (adrenals not yet atrophied)"],
     "⚠ Recent pituitary surgery → normal SST; use insulin tolerance test"),
    ("Dexamethasone Suppression\nTest (1 mg overnight DST)", RED,
     ["Indication: Suspected Cushing's syndrome",
      "Protocol: 1 mg dexamethasone 11 PM; cortisol at 8 AM next day",
      "Normal suppression: 9 AM cortisol < 50 nmol/L",
      "Failure to suppress: Cushing's (or pseudo-Cushing, obesity, depression)",
      "Sensitivity ~95%, specificity ~80% → useful screening, not confirmatory"],
     "⚠ Drugs that ↑CYP3A4 (rifampicin, phenytoin) accelerate dex metabolism → false positive"),
    ("Oral Glucose Suppression\nTest (GH/OGTT)", TEAL,
     ["Indication: Suspected acromegaly",
      "Protocol: 75 g oral glucose; GH at 0, 30, 60, 90, 120 min",
      "Normal: GH nadir < 1 µg/L (ultrasensitive assay < 0.4 µg/L)",
      "Acromegaly: GH not suppressed; paradoxical rise in some",
      "Note: IGF-1 used for screening; OGTT for confirmation"],
     "🔑 Acromegaly: measure IGF-1 first — better reflects integrated GH secretion"),
    ("Insulin Tolerance Test\n(ITT — Gold Standard)", RGBColor(0x8B, 0x44, 0x00),
     ["Indication: GH deficiency & cortisol reserve (post-pituitary surgery)",
      "Protocol: Insulin 0.1 U/kg IV → target glucose < 2.2 mmol/L; GH & cortisol at 0, 30, 60 min",
      "Normal GH response: peak > 5-6 µg/L",
      "Normal cortisol response: peak > 500 nmol/L",
      "Contraindicated: ischaemic heart disease, epilepsy, severe adrenal insufficiency"],
     "⚠ MUST have medical supervision; 10% dextrose at bedside; stop if seizure"),
]

col_w2 = 3.15
for col, (title, color, points, caveat) in enumerate(tests):
    x = 0.22 + col * (col_w2 + 0.08)
    add_rect(slide, x, 1.2, col_w2, 0.55, fill=color)
    add_text(slide, title, x+0.1, 1.22, col_w2-0.15, 0.5,
             size=11, bold=True, color=WHITE, align=PP_ALIGN.CENTER, v_anchor=MSO_ANCHOR.MIDDLE)
    add_rect(slide, x, 1.75, col_w2, 4.45, fill=WHITE, line_color=color, line_width=1)
    for j, pt in enumerate(points):
        add_text(slide, "• " + pt, x+0.12, 1.82 + j*0.82, col_w2-0.18, 0.78,
                 size=10.5, color=DARK_GREY)
    add_rect(slide, x, 6.2, col_w2, 0.88, fill=RGBColor(0xFF, 0xF5, 0xCC), line_color=GOLD, line_width=1)
    add_text(slide, caveat, x+0.1, 6.22, col_w2-0.15, 0.84,
             size=9.5, color=RGBColor(0x5A, 0x3A, 0x00), wrap=True)

# ═══════════════════════════════════════════════════════════════════════════
# SLIDE 15 – CLINICAL CASE-BASED VIGNETTES
# ═══════════════════════════════════════════════════════════════════════════
slide = prs.slides.add_slide(blank)
slide_header(slide, "Clinical Vignettes: Applying Endocrine Principles",
             "Apply receptor theory, feedback logic, and assay interpretation to clinical cases")
footer(slide)

cases = [
    ("CASE 1", "45-year-old woman: TSH 0.1 mIU/L (↓), Free T4 32 pmol/L (↑), Free T3 8.2 pmol/L (↑)",
     "TSH SUPPRESSED by excess T3/T4 (negative feedback). Primary hyperthyroidism.\nNext: RAIU scan, TRAb; treat with antithyroids",
     "If TSH ↓ but fT4 also ↓ → consider non-thyroidal illness or central hyperthyroidism (rare TSH-secreting adenoma)"),
    ("CASE 2", "35-year-old male: Hump, HTN, DM. Cortisol 1100 nmol/L after 1mg DST; ACTH 180 ng/L (↑)",
     "ACTH-DEPENDENT hypercortisolism. ACTH ↑ → adrenal cortex driven by pituitary/ectopic source.\nHigh-dose DST: suppression suggests Cushing's disease; no suppression → ectopic ACTH (lung, carcinoid)",
     "IPSS (inferior petrosal sinus sampling) gold standard to distinguish pituitary vs ectopic ACTH"),
    ("CASE 3", "62-year-old male: fatigue, Ca²⁺ 3.1 mmol/L (↑), PTH 98 pg/mL (↑ — should be suppressed)",
     "PTH SHOULD BE SUPPRESSED by hypercalcaemia. Failure to suppress = autonomous PTH secretion.\nDiagnosis: Primary hyperparathyroidism (parathyroid adenoma in 85%)",
     "FHH (familial hypocalciuric hypercalcaemia): also ↑PTH but 24h urinary Ca/Cr clearance ratio < 0.01 — CaSR mutation"),
    ("CASE 4", "28-year-old female on OCP: Total T4 180 nmol/L (↑), but TSH normal, free T4 normal",
     "OCP → ↑TBG → ↑TOTAL T4 but FREE T4 unchanged → euthyroid state\nAlways interpret TOTAL hormone with binding protein context",
     "Measure free T4 in pregnant women or those on estrogen to avoid misdiagnosis"),
]

for i, (case_label, presentation, finding, pearl) in enumerate(cases):
    y = 1.22 + i * 1.52
    add_rect(slide, 0.25, y, 1.05, 1.3, fill=NAVY)
    add_text(slide, case_label, 0.25, y+0.35, 1.05, 0.6,
             size=11, bold=True, color=WHITE, align=PP_ALIGN.CENTER, v_anchor=MSO_ANCHOR.MIDDLE)
    add_rect(slide, 1.35, y, 11.75, 0.42, fill=LIGHT_GREY, line_color=MID_GREY, line_width=0.5)
    add_text(slide, "📋 " + presentation, 1.45, y+0.04, 11.55, 0.38,
             size=11, bold=True, color=DARK_GREY)
    add_rect(slide, 1.35, y+0.42, 7.6, 0.52, fill=WHITE, line_color=TEAL, line_width=1)
    add_text(slide, "🔎 " + finding, 1.45, y+0.45, 7.4, 0.48,
             size=10.5, color=TEAL)
    add_rect(slide, 8.95, y+0.42, 4.15, 0.52, fill=RGBColor(0xFF, 0xF5, 0xCC), line_color=GOLD, line_width=1)
    add_text(slide, "💡 " + pearl, 9.0, y+0.45, 4.05, 0.48,
             size=9.5, color=RGBColor(0x5A, 0x3A, 0x00))
    add_rect(slide, 1.35, y+0.94, 11.75, 0.36, fill=LIGHT_GREY)

# ═══════════════════════════════════════════════════════════════════════════
# SLIDE 16 – SUMMARY & KEY TAKE-AWAYS
# ═══════════════════════════════════════════════════════════════════════════
slide = prs.slides.add_slide(blank)
slide_header(slide, "Summary: Key Take-Away Messages", "Consolidating principles for clinical practice")
footer(slide)

takeaways = [
    (NAVY,  "1. Hormone class = receptor location",
     "Peptides/catecholamines act at cell-surface receptors (fast, transient). Steroids/thyroid hormones act intranuclearly (slow, genomic, long-lasting)."),
    (TEAL,  "2. Second messengers amplify the signal",
     "cAMP (Gs), IP3/DAG (Gq), JAK-STAT — single hormone-receptor event → thousands of downstream effectors."),
    (GREEN, "3. Feedback controls the set-point",
     "Negative feedback is the rule; loss of feedback = pathology. Always think: 'where is the lesion — hypothalamus, pituitary, or target gland?'"),
    (RGBColor(0x8B, 0x44, 0x00), "4. Timing matters",
     "Circadian + pulsatile secretion means a single value can mislead. Always standardise sampling conditions (morning, fasting, specific cycle day)."),
    (RED,   "5. Total vs. Free hormone",
     "Binding proteins (TBG, CBG, SHBG) change total hormone without changing free (active) fraction. Measure free when binding protein is altered."),
    (RGBColor(0x5A, 0x1A, 0x8B), "6. Dynamic tests resolve overlap",
     "When basal values overlap the normal range, use stimulation (hypofunction) or suppression (hyperfunction) tests based on feedback principles."),
    (NAVY,  "7. Paired hormone logic",
     "Never interpret one hormone in isolation. High PTH + high Ca = primary HPTH. Low FSH + low T = secondary hypogonadism. Context is everything."),
]

for i, (color, title, body) in enumerate(takeaways):
    y = 1.22 + i * 0.87
    add_rect(slide, 0.25, y, 0.55, 0.77, fill=color)
    add_text(slide, str(i+1), 0.25, y+0.12, 0.55, 0.5,
             size=18, bold=True, color=WHITE, align=PP_ALIGN.CENTER)
    add_rect(slide, 0.85, y, 12.2, 0.8, fill=WHITE, line_color=color, line_width=1.2)
    add_text(slide, title, 0.95, y+0.04, 12.0, 0.3, size=12, bold=True, color=color)
    add_text(slide, body, 0.95, y+0.38, 12.0, 0.38, size=11, color=DARK_GREY)

# ═══════════════════════════════════════════════════════════════════════════
# SLIDE 17 – REFERENCES
# ═══════════════════════════════════════════════════════════════════════════
slide = prs.slides.add_slide(blank)
slide_header(slide, "References", "Core sources for this presentation")
footer(slide)

refs = [
    "1. Hall JE, Hall ME. Guyton and Hall Textbook of Medical Physiology, 14th ed. Elsevier, 2021. "
    "Chapter 75: Introduction to Endocrinology (pp 903–922). Hormone classes, receptor signaling, "
    "feedback mechanisms, circadian rhythms.",
    "2. Jameson JL, Fauci AS, Kasper DL et al. Harrison's Principles of Internal Medicine, 22nd ed. "
    "McGraw-Hill, 2025. Chapter 388: Principles of Endocrinology. Hormone measurements, dynamic "
    "testing, interpreting hormone assays.",
    "3. Boron WF, Boulpaep EL. Medical Physiology, 3rd ed. Elsevier, 2017. Chapter 47: "
    "Organisation of the Endocrine System — second messenger systems and feedback.",
    "4. Greenspan FS, Gardner DG. Basic and Clinical Endocrinology, 9th ed. McGraw-Hill, 2011.",
    "5. Nieman LK. Cushing's syndrome: update on signs, symptoms and biochemical screening. "
    "Eur J Endocrinol. 2015;173(4):M33-M38.",
    "6. Stewart PM, Tomlinson JW. Cortisol, 11β-HSD1 and the Metabolic Syndrome. "
    "Trends Endocrinol Metab. 2002;13(3):94-100.",
    "7. Molina PE. Endocrine Physiology, 5th ed. McGraw-Hill, 2018.",
]

add_rect(slide, 0.3, 1.2, 12.7, 5.8, fill=WHITE, line_color=MID_GREY, line_width=0.5)
for i, ref in enumerate(refs):
    add_text(slide, ref, 0.5, 1.35 + i * 0.8, 12.4, 0.72,
             size=11, color=DARK_GREY)

add_rect(slide, 0.3, 7.05, 12.7, 0.38, fill=LIGHT_GREY)
add_text(slide, "Prepared using content from Guyton & Hall Medical Physiology and Harrison's Principles of Internal Medicine 22e | For educational use",
         0.4, 7.07, 12.5, 0.32, size=10, color=MID_GREY, align=PP_ALIGN.CENTER)

# ── SAVE ────────────────────────────────────────────────────────────────────
output_path = "/tmp/workspace/endocrinology-pptx/Endocrine_Physiology_PG_Teaching.pptx"
buf = BytesIO()
prs.save(buf)
with open(output_path, "wb") as f:
    f.write(buf.getvalue())

print(f"Saved: {output_path}")
print(f"Slides: {len(prs.slides)}")
cd /tmp/workspace/endocrinology-pptx && python build_pptx.py 2>&1
requests/urllib:python3 -c " import urllib.request, base64, json from io import BytesIO urls = [ 'https://cdn.orris.care/cdss_images/pmc_clinical_VQA_b5bba02846b06b60f3fe05f0b502b65030bb20fe41003ca3ec462dac25cda1f1.jpg', 'https://cdn.orris.care/cdss_images/pmc_clinical_VQA_6f82970f9f7319e651f853444406dd2b35b7feffc3334ebb3c549f9b030a044f.jpg', 'https://cdn.orris.care/cdss_images/pmc_clinical_VQA_e4ee6a6d54d84d4ab63ca8f27b0318b8a65b0d948bc16b12d37aae425eefefb7.jpg', ] for i, url in enumerate(urls): try: with urllib.request.urlopen(url, timeout=10) as resp: data = resp.read() out_path = f'/tmp/workspace/endocrinology-pptx/img{i}.jpg' with open(out_path, 'wb') as f: f.write(data) print(f'OK: {out_path} ({len(data)} bytes)') except Exception as e: print(f'FAIL {url}: {e}') " 2>&1
~/endocrinology-pptx/build_pptx.py
Successfully replaced 1 instance(s) of the string in '/tmp/workspace/endocrinology-pptx/build_pptx.py'
~/endocrinology-pptx/build_pptx.py
Successfully replaced 1 instance(s) of the string in '/tmp/workspace/endocrinology-pptx/build_pptx.py'
~/endocrinology-pptx/build_pptx.py
Successfully replaced 1 instance(s) of the string in '/tmp/workspace/endocrinology-pptx/build_pptx.py'
cd /tmp/workspace/endocrinology-pptx && python build_pptx.py 2>&1
Endocrine Physiology PG Teaching
Presentation · PPTX
What's Inside — 17 Slides
| Slide | Content |
|---|---|
| 1 | Title slide — professional navy/teal/gold branding |
| 2 | Learning objectives (7 measurable outcomes) |
| 3 | Hormone classification — Peptide / Steroid / Amine (3-column layout with examples) |
| 4 | Synthesis, storage & transport — comparison table + clinical relevance panel (TBG, CBG, binding proteins) |
| 5 | Receptor classes — 4-column layout: Ion channel, GPCR, Enzyme-linked/JAK-STAT, Nuclear; each with speed badge, examples, mechanism, and clinical pearl |
| 6 | GPCR / cAMP pathway — 6-step cascade with embedded FSH/GPCR signalling diagram; cholera toxin clinical note |
| 7 | IP₃/DAG (Gq) pathway + JAK-STAT side-by-side; GnRH agonist and acromegaly pearls |
| 8 | Nuclear receptor pathway (steroid/thyroid) — 6-step workflow + HPT axis diagram (T3/T4 → TR → HRE) |
| 9 | Receptor up-regulation vs down-regulation — mechanisms, tachyphylaxis, priming examples |
| 10 | Feedback mechanisms — negative (long/short/ultra-short loops) + positive feedback (LH surge); HPA axis diagram with CAH comparison |
| 11 | Circadian rhythms table — 8 hormones (cortisol, GH, TSH, LH/FSH, testosterone, insulin, melatonin) with patterns and clinical implications |
| 12 | Endocrine testing principles — basal / stimulation / suppression boxes + 4 key interpretation principles from Harrison's 22e |
| 13 | Interpreting abnormal assays — 10-row paired hormone logic table (TSH, Ca/PTH, T/LH, ACTH/cortisol, acromegaly) |
| 14 | Dynamic tests deep dive — SST, 1 mg DST, GH-OGTT, Insulin Tolerance Test; protocols + interpretation + caveats |
| 15 | 4 Clinical vignettes — OCP + T4, Cushing's, primary hyperparathyroidism, acromegaly |
| 16 | 7 key take-away messages |
| 17 | References — Guyton & Hall, Harrison's 22e, Greenspan, and others |