attachment
attachment

Evaluate

analyse_media
Reading File
Reading File
Finding Sources
Finding Sources
Finding Sources
Searching PubMed

"inferior STEMI" AND "reciprocal ST depression"

Searching Images

inferior wall ST elevation myocardial infarction ECG reciprocal changes
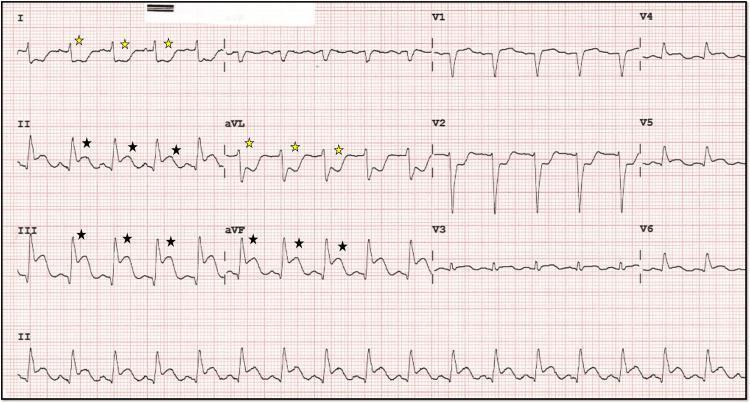
A 12-lead electrocardiogram (ECG) demonstrating diagnostic findings of an acute inferior wall myocardial infarction (ST-elevation myocardial infarction, or STEMI). The primary findings include significant ST-segment elevation in the inferior leads (II, III, and aVF), marked with black stars. Concurrently, there is evidence of reciprocal ST-segment depression in the high lateral leads (I and aVL), indicated by yellow stars. The precordial leads (V1-V3) also exhibit prominent ST-segment depression, which can suggest posterior wall involvement or reciprocal changes from the inferior injury. The inferior leads show a 'shark fin' morphology, characterized by a fusion of the QRS complex, ST segment, and T wave, typically indicating a large area of transmural ischemia. The rhythm appears to be a junctional or sinus bradycardia/tachycardia depending on the clinical phase, with evident electrical instability. This ECG is a critical educational example for identifying acute coronary syndrome and understanding the relationship between anatomical lead groups and reciprocal changes.
A 12-lead electrocardiogram (ECG) demonstrating diagnostic findings of an acute inferior wall myocardial infarction (ST-elevation myocardial infarction, or STEMI). The primary findings include significant ST-segment elevation in the inferior leads (II, III, and aVF), marked with black stars. Concurrently, there is evidence of reciprocal ST-segment depression in the high lateral leads (I and aVL), indicated by yellow stars. The precordial leads (V1-V3) also exhibit prominent ST-segment depression, which can suggest posterior wall involvement or reciprocal changes from the inferior injury. The inferior leads show a 'shark fin' morphology, characterized by a fusion of the QRS complex, ST segment, and T wave, typically indicating a large area of transmural ischemia. The rhythm appears to be a junctional or sinus bradycardia/tachycardia depending on the clinical phase, with evident electrical instability. This ECG is a critical educational example for identifying acute coronary syndrome and understanding the relationship between anatomical lead groups and reciprocal changes.

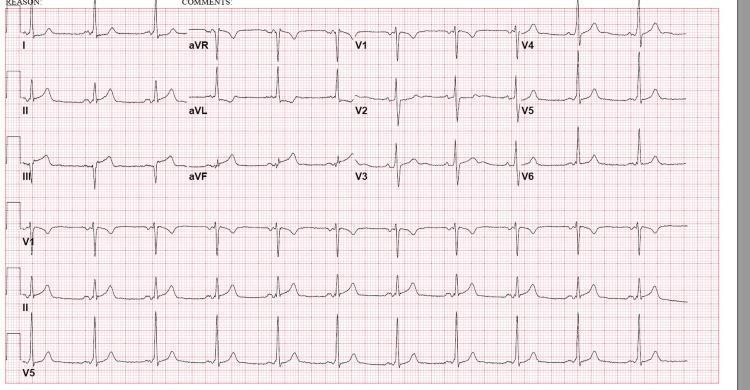
This diagnostic image is a 12-lead electrocardiogram (ECG) demonstrating signs of an acute inferior wall ST-elevation myocardial infarction (STEMI). The tracing reveals significant ST-segment elevation in the inferior leads (II, III, and aVF), with the elevation being most pronounced in lead III compared to lead II. Accompanying these changes is evidence of reciprocal ST-segment depression and T-wave inversion in the high lateral leads, specifically I and aVL. The precordial leads (V1-V6) show preserved R-wave progression without significant ST-segment deviations or QRS widening. The rhythm appears to be sinus bradycardia with a regular rate. This ECG is a classic representation of acute myocardial ischemia or infarction involving the territory of the right coronary artery (RCA). It serves as an educational tool for identifying inferior STEMI patterns, understanding reciprocal changes in lateral leads, and differentiating localized ST elevations from diffuse patterns.
This diagnostic image is a 12-lead electrocardiogram (ECG) demonstrating signs of an acute inferior wall ST-elevation myocardial infarction (STEMI). The tracing reveals significant ST-segment elevation in the inferior leads (II, III, and aVF), with the elevation being most pronounced in lead III compared to lead II. Accompanying these changes is evidence of reciprocal ST-segment depression and T-wave inversion in the high lateral leads, specifically I and aVL. The precordial leads (V1-V6) show preserved R-wave progression without significant ST-segment deviations or QRS widening. The rhythm appears to be sinus bradycardia with a regular rate. This ECG is a classic representation of acute myocardial ischemia or infarction involving the territory of the right coronary artery (RCA). It serves as an educational tool for identifying inferior STEMI patterns, understanding reciprocal changes in lateral leads, and differentiating localized ST elevations from diffuse patterns.

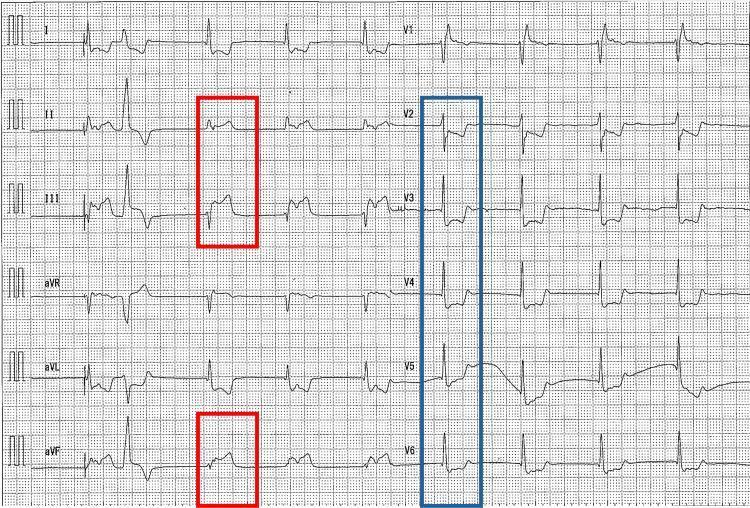
This diagnostic image is a 12-lead electrocardiogram (ECG) demonstrating an acute inferior myocardial infarction. The tracing shows marked ST-segment elevation in the inferior leads (II, III, and aVF), highlighted by red rectangular annotations. Concurrently, reciprocal ST-segment depression is visible in the precordial leads (V2 through V6), indicated by a blue rectangular annotation. The rhythm appears to be a sinus rhythm with a prolonged PR interval, suggestive of a first-degree atrioventricular block, and there is evident bradycardia. The ECG morphology is characteristic of an evolving ST-elevation myocardial infarction (STEMI) involving the inferior wall, often associated with right coronary artery occlusion. This visual material is intended for medical students and clinicians to learn the identification of ischemic patterns, specifically inferior wall injury and the importance of recognizing reciprocal changes in the anterior and lateral leads.

This diagnostic image is a 12-lead electrocardiogram (ECG) demonstrating an acute inferior myocardial infarction. The tracing shows marked ST-segment elevation in the inferior leads (II, III, and aVF), highlighted by red rectangular annotations. Concurrently, reciprocal ST-segment depression is visible in the precordial leads (V2 through V6), indicated by a blue rectangular annotation. The rhythm appears to be a sinus rhythm with a prolonged PR interval, suggestive of a first-degree atrioventricular block, and there is evident bradycardia. The ECG morphology is characteristic of an evolving ST-elevation myocardial infarction (STEMI) involving the inferior wall, often associated with right coronary artery occlusion. This visual material is intended for medical students and clinicians to learn the identification of ischemic patterns, specifically inferior wall injury and the importance of recognizing reciprocal changes in the anterior and lateral leads.

Reading Article

PMID: 36317727

Finding Sources
Finding Sources

What this is

A photographed 12-lead ECG strip (Glasgow algorithm v28.6.2, 25 mm/sec, 10 mm/mV, filter 0.5–32 Hz) from Ananta Hospital Emergency, timestamped 18‑08‑2026 00:07 (essentially "now" relative to today). No pacemaker present. The strip includes computerized QRS-voltage data (SV1+RV5 ≈ 1.04 mV, SV1+RV6 ≈ 1.12 mV) — well below the Sokolow-Lyon LVH cutoff (>3.5 mV), so no voltage criteria for LVH.

Automated (Glasgow) interpretation printed on the strip

  • Frequent multifocal PVCs
  • 1st-degree AV block
  • Inferior ST elevation → "Consider acute infarct"
  • Anteroseptal ST depression, "probably reciprocal to" the inferior injury

My reading of the tracing

This is consistent with what's printed:
1. Inferior STEMI pattern – ST elevation is visible across II, III, and aVF, with lead III appearing more affected than II. That specific pattern (STE III > II, together with ST depression in aVL > I) is the single best-performing ECG sign for localizing the culprit vessel to the right coronary artery rather than the circumflex, per a large meta-analysis of 33 studies/4,414 patients (sensitivity ~0.89, specificity ~0.68 for STE III>II; AUC 0.88) (Zhou et al., Ann Noninvasive Electrocardiol 2023, PMID: 36317727).
2. Anteroseptal/precordial ST depression (V1–V3) – In the setting of inferior injury, ST depression in V1–V3 is textbook reciprocal change, but it can also represent true posterior wall extension rather than pure reciprocal change, since no standard lead sits directly over the posterior wall - Tintinalli's Emergency Medicine; Rosen's Emergency Medicine. This distinction matters because posterior extension implies a larger area at risk (often combined RCA/dominant circumflex disease) and changes the threshold for right-sided/posterior lead placement.
3. First-degree AV block – PR interval >200 ms - Harrison's Principles of Internal Medicine; Rosen's Emergency Medicine. In inferior MI this is common and usually reflects transient AV-nodal ischemia (the AV node is supplied by the RCA in ~90% of people), and it can progress to higher-degree block during the acute phase.
4. Frequent multifocal PVCs – Multiple differing PVC morphologies imply more than one ventricular ectopic focus, a marker of electrical instability in the setting of acute ischemia; historically these were called "warning arrhythmias" for higher malignant-arrhythmia risk - Harrison's Principles of Internal Medicine.
Below is a reference example of the classic pattern being described (inferior ST elevation with reciprocal lateral/anteroseptal depression), for visual comparison:
Inferior STEMI with reciprocal changes

Bottom line

The combination the machine flagged — inferior ST elevation "consider acute infarct" + reciprocal anteroseptal depression + new 1st-degree AV block + frequent multifocal PVCs — is a classic acute inferior STEMI picture, most likely RCA territory, with the AV block and PVCs reflecting associated AV-nodal ischemia and electrical instability. This automated "consider acute infarct" flag functions as a STEMI-equivalent alert and, in a real clinical setting, should trigger:
  • Immediate clinical correlation (chest pain, hemodynamics, troponin) and cardiology/cath-lab activation without waiting for confirmatory testing, per standard STEMI protocols
  • Right-sided leads (V4R) to assess for RV infarction (RCA proximal occlusion) and posterior leads (V7–V9) given the V1–V3 depression, before assuming it is purely reciprocal
  • Continuous rhythm monitoring given the multifocal PVCs and AV block risk of progression to higher-degree block or ventricular arrhythmia; correct K+/Mg2+, avoid Class IC antiarrhythmics

Caveats on this specific image

  • This is a phone photo of thermal paper at an angle with visible artifact/baseline coarseness in several leads (particularly the precordials) and a hand partially over the strip — fine measurement of exact rate, PR/QT duration, and whether some of the "bizarre" complexes are true PVCs versus motion artifact cannot be fully verified from this image alone. A repeat, artifact-free 12-lead is warranted before final clinical decision-making.
  • Part of the header (an interval measurement near the top, possibly QT/QTc) is cropped/unclear in the photo and I could not confirm its value.
  • The printed date (18‑08‑2026) is essentially concurrent with today; not a clinical issue, just noting the device clock lines up with real time.
I did not find any recent (2023-2025) systematic review or meta-analysis that contradicts these standard teaching points on inferior STEMI reciprocal changes, first-degree AV block, or multifocal PVCs, so the interpretation above is well supported by current evidence and standard texts.
This is a shared conversation. Sign in to Orris to start your own chat.