
FIBRO scan
FibroScan transient elastography liver fibrosis assessment
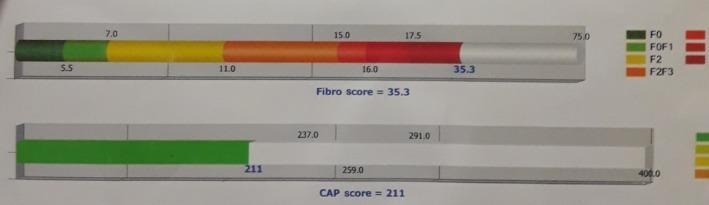
A diagnostic graphical output from a transient elastography (FibroScan) assessment used to evaluate liver stiffness and steatosis. The image features two horizontal bar graphs. The top bar represents the 'Fibro score' (liver stiffness in kilopascals, kPa), showing a color-coded gradient corresponding to Metavir fibrosis stages: dark green (F0), light green (F0F1), yellow (F2), orange (F2F3), and red (F4/cirrhosis). A specific value of 35.3 kPa is highlighted, indicating advanced cirrhosis. The lower bar represents the 'Controlled Attenuation Parameter (CAP) score' (measured in dB/m) used to quantify hepatic steatosis. This bar shows a green segment reaching a value of 211 dB/m on a scale up to 400.0, suggesting a low level of fat accumulation (S0). The graphic is a standard clinical tool in gastroenterology and hepatology for non-invasive monitoring of chronic liver disease, providing a visual comparison between fibrosis severity and steatosis levels.
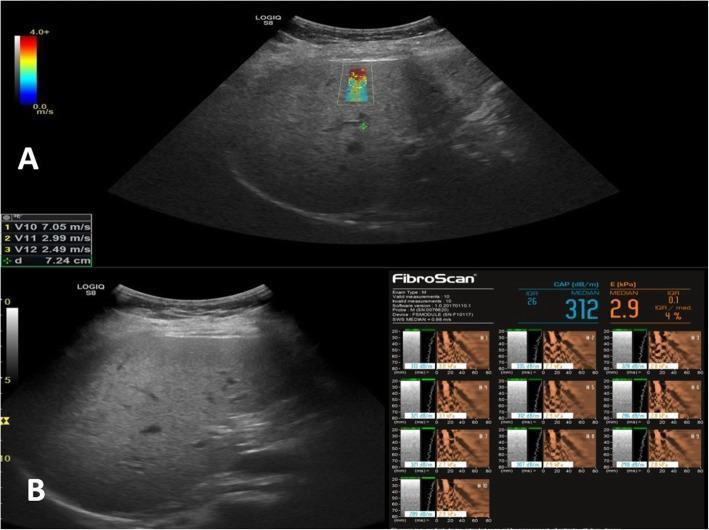
This composite diagnostic image demonstrates a comparative assessment of liver fibrosis in a 48-year-old female with chronic hepatitis B using two elastography modalities. Image A shows a 2D Shear Wave Elastography (SWE) examination. The top pane displays a B-mode ultrasound of the liver with a color-coded shear wave velocity map (ranging from 0.0 to 4.0+ m/s) overlaid on a region of interest. Numerical data indicates velocities (V10: 7.05 m/s, V11: 2.99 m/s, V12: 2.49 m/s) at a depth of 7.24 cm, which was interpreted as significant fibrosis (Metavir F2). Image B displays a Transient Elastography (FibroScan) report. The left side shows the B-mode ultrasound guide, while the right side presents quantitative data: a Controlled Attenuation Parameter (CAP) of 312 dB/m (indicating steatosis) and a liver stiffness measurement (E) of 2.9 kPa with an IQR/median of 4%. These FibroScan findings are consistent with no significant fibrosis (Metavir F0), illustrating a clinical discrepancy between SWE and TE results in the same patient. The visual serves to educate on non-invasive liver stiffness measurement techniques and the potential for overestimation in specific modalities.
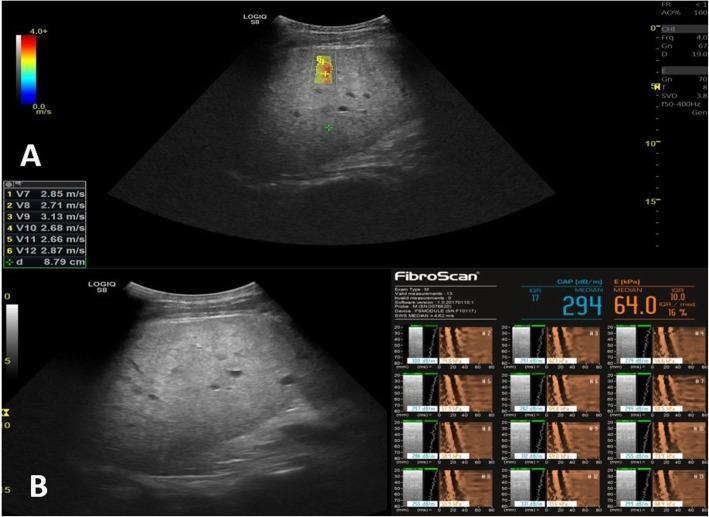
This composite diagnostic image demonstrates non-invasive liver fibrosis assessment in a 52-year-old male with chronic hepatitis C. Panel A displays a 2D Shear Wave Elastography (SWE) ultrasound of the liver. It features a B-mode grayscale image with a colored elasticity map overlay. A color-coded scale (0.0 to 4.0 m/s) indicates tissue stiffness, where red signifies higher shear wave velocity. Measurement data shows velocity values ranging from 2.66 to 3.13 m/s (median 2.62 m/s), corresponding to a Metavir F4 (cirrhosis) stage. Panel B shows a FibroScan (Transient Elastography) interface. Quantitative findings include a Controlled Attenuation Parameter (CAP) of 294 dB/m (indicating hepatic steatosis) and a liver stiffness measurement (E) of 64.0 kPa with an IQR/median ratio of 16%. The FibroScan display includes individual measurement graphs showing shear wave propagation. Both modalities consistently indicate advanced fibrosis/cirrhosis (F4). This content is representative of hepatology and radiology diagnostic protocols for monitoring chronic liver disease progression.

This diagnostic image displays a portion of a Fibroscan result, a non-invasive imaging modality used to assess liver stiffness and steatosis. The image features a horizontal band containing color-coded data, transitioning from a green hue with vertical striations on the far left to a dominant, solid blue field across the center and right. Additional faint vertical patterns appear on the far right. Centered within this blue band are two white text labels: 'None alcohol Fatty Liver Disease' (top) and 'Hepatitis B' (bottom). The visual demonstrates clinical findings in the context of liver disease assessment, specifically comparing the effects of different etiologies or concurrent conditions such as hepatic hemangioma on transient elastography measurements. The educational focus is on identifying visual patterns related to liver stiffness (measured in kilopascals) and controlled attenuation parameter (CAP) scores, which are critical for staging fibrosis and steatosis in chronic liver diseases.
FibroScan transient elastography liver fibrosis
FibroScan (Vibration-Controlled Transient Elastography - VCTE)
What Is It?
How It Works
-
The measurement window is 1 cm × 4 cm - approximately 100 times the area of a standard liver biopsy specimen, greatly reducing sampling error.
-
Results are expressed in kilopascals (kPa).
-
Modern FibroScan also measures the Controlled Attenuation Parameter (CAP) in dB/m, which quantifies hepatic steatosis (fat content).
-
Sleisenger & Fordtran's GI and Liver Disease
Two Key Outputs
| Parameter | What It Measures | Unit | Clinical Use |
|---|---|---|---|
| Liver Stiffness (E) | Degree of hepatic fibrosis | kPa | Staging fibrosis (F0-F4/METAVIR) |
| CAP Score | Hepatic fat (steatosis) | dB/m | Grading steatosis (S0-S3) |
Fibrosis Staging: METAVIR Scale
| METAVIR Stage | Meaning | Approximate kPa Threshold (Hep C) |
|---|---|---|
| F0 | No fibrosis | < 7.0 kPa |
| F1 | Portal fibrosis, no septa | < 7.0 kPa |
| F2 | Few septa | ~7.1 - 9.5 kPa |
| F3 | Numerous septa, no cirrhosis | ~9.5 - 12.5 kPa |
| F4 | Cirrhosis | > 12.5 kPa |
FibroScan Output - Sample Images
Clinical Indications
- Chronic Hepatitis B and Hepatitis C
- NAFLD/NASH (non-alcoholic fatty liver disease)
- Alcohol-associated liver disease
- Primary biliary cholangitis (PBC)
- Hemochromatosis
- Post-liver transplant recurrent hepatitis
- Monitoring hepatotoxicity in patients on methotrexate (e.g., for psoriasis, rheumatoid arthritis)
Advantages Over Liver Biopsy
| Feature | Liver Biopsy | FibroScan |
|---|---|---|
| Invasiveness | Invasive, risk of bleeding | Completely non-invasive |
| Sample volume | Small (1/50,000 of liver) | 100× larger "window" |
| Sampling error | Up to 33% 1-stage difference | Negligible |
| Cost | High | Lower |
| Repeatability | Limited | Easily repeatable |
| Steatosis assessment | Yes (histology) | Yes (CAP score) |
Limitations
- Obesity (BMI ≥ 30-40) - increased body habitus reduces reliability; an XL probe is available but still less accurate.
- Ascites - fluid impairs shear wave propagation.
- Hepatic inflammation - active necroinflammation can overestimate stiffness, independent of fibrosis stage.
- Poor at intermediate fibrosis - most accurate for F0-F1 vs. F4 extremes; less precise for F2-F3.
- Operator skill - requires adequate training; 10 valid measurements with an IQR/median ratio < 30% needed for reliability.
- Does not assess degree of hepatic inflammation (unlike biopsy).
Compared to Other Elastography Methods
| Method | How It Works | Advantage | Limitation |
|---|---|---|---|
| FibroScan (VCTE) | 50 Hz shear wave, 1D | Fast, cheap, validated | BMI, ascites limitations |
| 2D-SWE | Shear wave with 2D imaging | Real-time, better in obese | More expensive |
| MR Elastography (MRE) | 65 Hz waves, MRI-based | Works in obese/ascites, most accurate | Very expensive, less accessible |