I now have substantial content from Guyton. Let me now use the subagent to do a comprehensive search and compile all answers in one pass, given my limited budget.Here are comprehensive, detailed answers to all 56 questions from your Medical Cardiophysiology LOQ:
MEDICAL CARDIOPHYSIOLOGY - COMPLETE ANSWERS
Q1. What is the STROKE VOLUME?
STROKE VOLUME (SV) is the volume of blood ejected by ONE VENTRICLE per single contraction (one heartbeat).
- Normal value: ~70 mL at rest (range 60-80 mL)
- Formula:
SV = EDV - ESV
(End-Diastolic Volume minus End-Systolic Volume)
Factors affecting SV (3 determinants):
- PRELOAD - ventricular filling pressure/EDV (Frank-Starling mechanism)
- AFTERLOAD - resistance against which heart must pump (aortic pressure)
- CONTRACTILITY - intrinsic force of myocardial contraction (inotropy)
Q2. Which structure of the heart has the SLOWEST rate of conduction of the cardiac action potential?
The AV NODE (Atrioventricular Node) has the slowest conduction velocity.
| Structure | Conduction Velocity |
|---|
| Purkinje fibers | 1.5 - 4.0 m/s (fastest) |
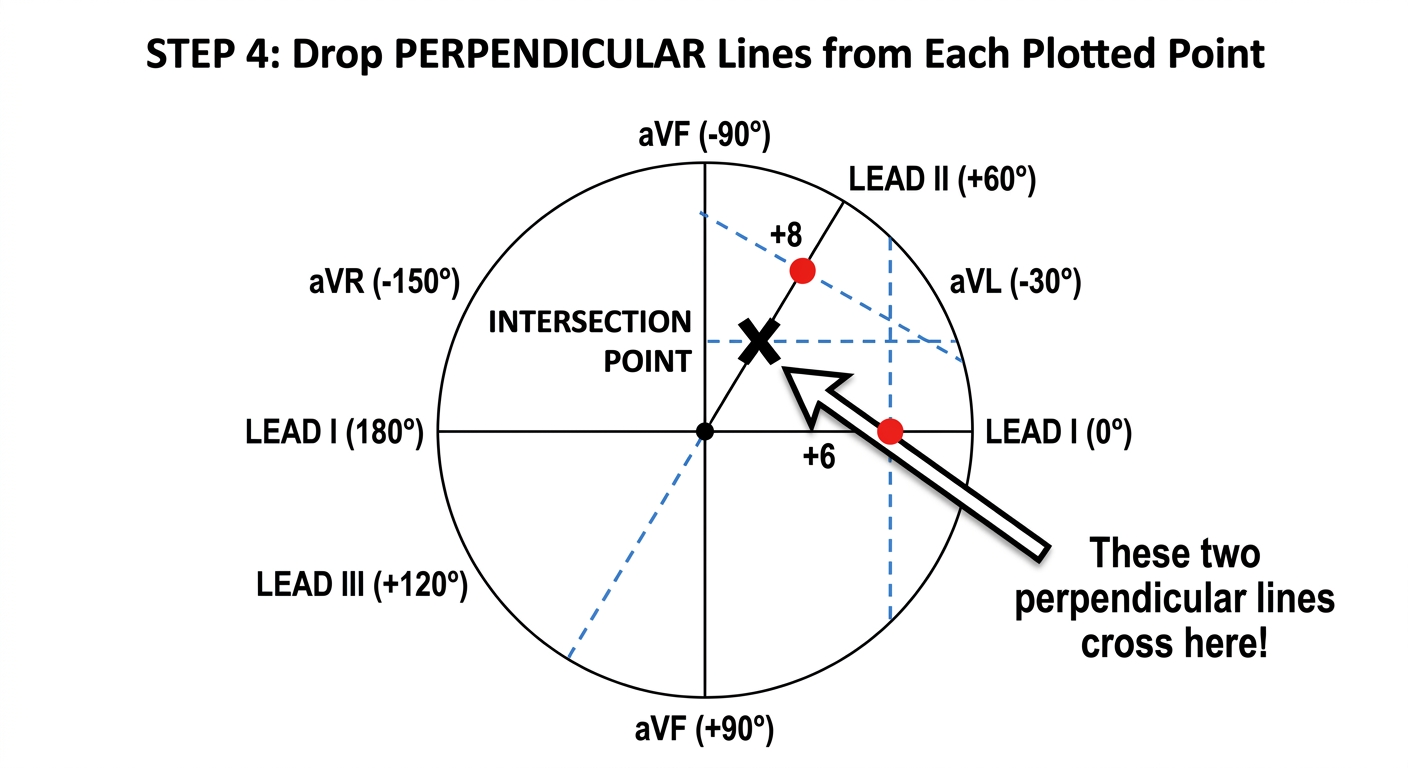
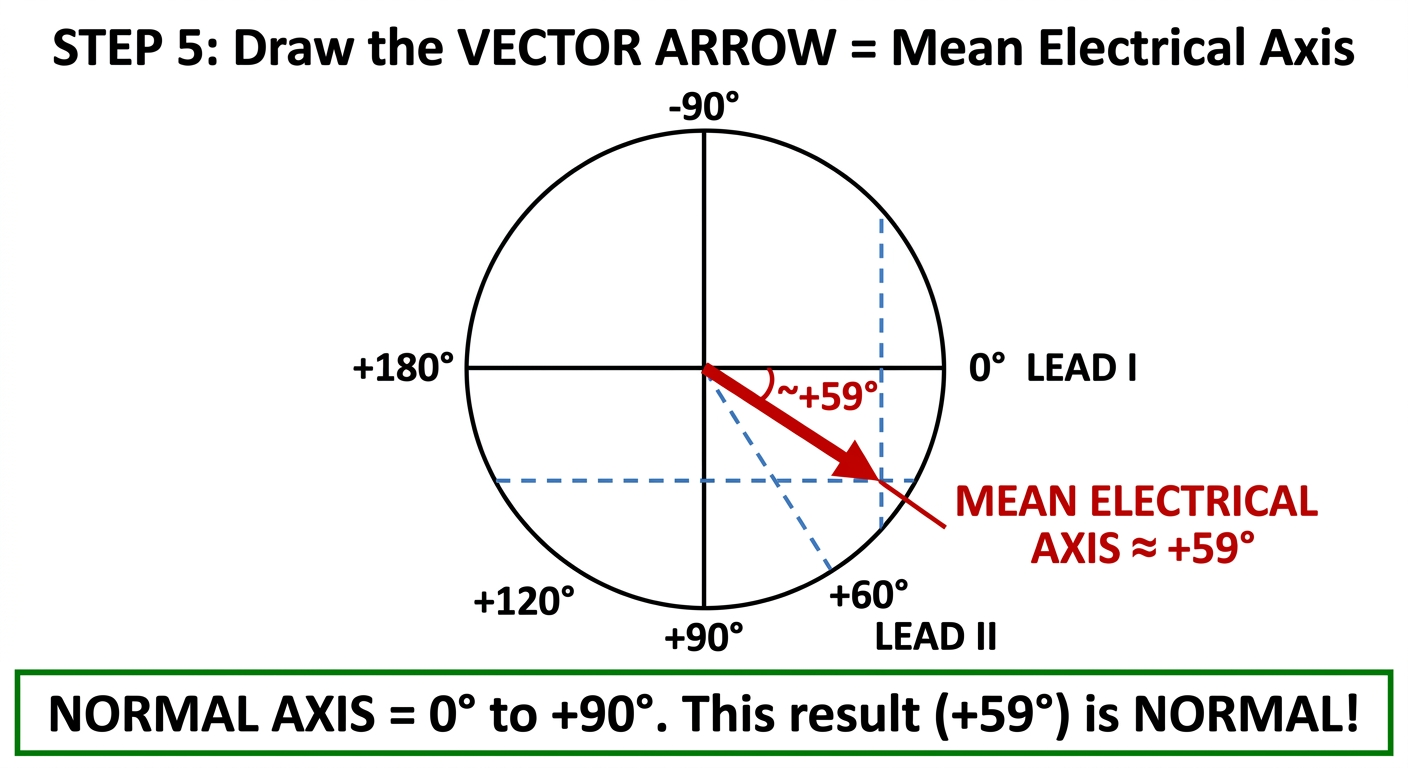
| Ventricular muscle | 0.3 - 0.5 m/s |
| Atrial muscle | 0.3 - 0.5 m/s |
| AV Node | 0.02 - 0.05 m/s (SLOWEST) |
Why slow conduction at AV node?
- The AV node creates a DELAY OF >0.1 SECOND between atrial and ventricular depolarization
- This delay allows the ATRIA TO CONTRACT FIRST and fill the ventricles (atrial kick) before ventricular contraction begins
- It also protects the ventricles from excessively rapid atrial rates (acts as a "gatekeeper")
Q3. POISEUILLE'S LAW. Effect of blood hematocrit and viscosity on vascular resistance and flow.
POISEUILLE'S LAW
The law describes laminar flow of a viscous fluid through a tube:
Q = (ΔP × π × r⁴) / (8 × η × L)
Where:
- Q = Flow rate
- ΔP = Pressure gradient (P₁ - P₂)
- r = Radius of vessel
- η = Viscosity of fluid
- L = Length of vessel
VASCULAR RESISTANCE Formula
R = (8 × η × L) / (π × r⁴)
Therefore: Q = ΔP / R (Ohm's law analog)
The most powerful determinant is RADIUS - doubling the radius increases flow 16-fold (r⁴ relationship).
Effect of HEMATOCRIT on Resistance and Flow
- HEMATOCRIT = percentage of red blood cells in blood (normal ~40-42%)
- As hematocrit increases, VISCOSITY INCREASES
- Normal blood viscosity = ~3x that of water; high hematocrit blood can reach 10x
| Hematocrit | Viscosity | Resistance | Flow |
|---|
| Low (anemia ~20%) | Decreased | Decreased | Increased |
| Normal (~40%) | Normal | Normal | Normal |
| High (polycythemia ~60%) | Markedly increased | Markedly increased | Decreased |
Effect of VISCOSITY on Resistance and Flow
- Viscosity and resistance are DIRECTLY proportional (R ∝ η)
- Viscosity and flow are INVERSELY proportional (Q ∝ 1/η)
- Increasing viscosity → increases resistance → decreases flow (at constant pressure gradient)
Key point: In polycythemia vera, markedly elevated hematocrit dramatically reduces blood flow, predisposing to thrombosis and organ ischemia.
Q4 / Q36 / Q40 / Q48. How can CARDIAC OUTPUT be calculated?
CARDIAC OUTPUT (CO) can be calculated by multiple methods:
Method 1: Direct Formula
CO = Heart Rate (HR) × Stroke Volume (SV)
- Normal: 72 beats/min × 70 mL/beat = ~5,040 mL/min ≈ 5 L/min
Method 2: FICK PRINCIPLE
CO = O₂ Consumption / (Arterial O₂ content - Venous O₂ content)
- O₂ consumed (VO₂) ÷ A-V O₂ difference
Method 3: THERMODILUTION (clinical - Swan-Ganz catheter)
- Cold saline injected into right atrium; temperature change measured downstream
- CO calculated from temperature-time curve (Stewart-Hamilton equation)
Method 4: INDICATOR DILUTION (Dye dilution)
CO = Amount of dye injected / (Mean concentration × Duration of curve)
Method 5: From R-R interval (ECG method)
HR = 60 / R-R interval (in seconds); then CO = HR × SV
Normal values:
- CO at rest: 4-8 L/min (avg ~5 L/min)
- Cardiac Index (CI): CO/BSA = ~2.4-3.8 L/min/m²
Q5. What is CARDIAC OUTPUT?
CARDIAC OUTPUT (CO) is the total volume of blood pumped by ONE VENTRICLE into the aorta (or pulmonary artery) per MINUTE.
- Normal resting value: ~5 L/min (4-8 L/min)
- Represents the sum of all tissue/organ blood flows
- Right CO = Left CO (outputs are equal in steady state)
Regulation:
- INTRINSIC (Frank-Starling): increased venous return → increased stretch → increased force → increased CO
- EXTRINSIC (Neural): Sympathetic stimulation increases HR and contractility → increases CO
- HUMORAL: Epinephrine, norepinephrine increase CO
CO is primarily controlled by VENOUS RETURN under normal conditions - the heart pumps whatever blood returns to it.
Q6 / Q42. What happens at the END of VENTRICULAR ISOVOLUMIC RELAXATION?
ISOVOLUMIC RELAXATION is the phase where:
- Ventricles relax but ALL VALVES ARE CLOSED
- Volume remains CONSTANT (isovolumic)
- Ventricular pressure FALLS RAPIDLY
At the END of isovolumic relaxation:
- Ventricular pressure falls BELOW ATRIAL PRESSURE
- The MITRAL VALVE (left) and TRICUSPID VALVE (right) OPEN
- VENTRICULAR FILLING BEGINS (rapid filling phase)
- This marks the transition from DIASTOLE BEGINS in the ventricle
Sequence:
Isovolumic relaxation ends → AV valves open → Rapid ventricular filling starts → The start of filling phase of diastole
Q7. LAMINAR and TURBULENT FLOW in blood vessels. REYNOLDS' NUMBER.
LAMINAR FLOW (Normal)
- Blood flows in CONCENTRIC LAYERS/STREAMLINES
- Fastest velocity at CENTER of vessel, slowest near walls (parabolic profile)
- SILENT - no sounds produced
- Governed by Poiseuille's law
- Characteristic of most normal blood vessels
TURBULENT FLOW (Abnormal)
- Blood flows in CHAOTIC, DISORDERLY SWIRLS - no organized streamlines
- Creates SOUNDS/BRUITS (can be heard with stethoscope)
- MORE ENERGY REQUIRED to drive same flow volume
- Occurs at high velocities, large diameters, low viscosity, at branching points
REYNOLDS' NUMBER (Re)
Re = (ρ × v × d) / η
Where:
- ρ (rho) = density of blood (~1.05 g/cm³)
- v = mean velocity of flow
- d = diameter of vessel
- η = viscosity of blood
Interpretation:
| Re Value | Flow Type |
|---|
| < 2000 | Laminar |
| 2000 - 3000 | Transitional |
| > 3000 | Turbulent |
In the CARDIOVASCULAR SYSTEM, turbulent flow is most likely when:
- High velocity (aorta during systole, stenotic valves)
- Low viscosity (severe anemia)
- Large diameter (major vessels)
Q8 / Q44 / Q52. How is the EJECTION FRACTION calculated?
EJECTION FRACTION (EF) is the fraction of end-diastolic volume ejected with each heartbeat.
EF = SV / EDV × 100%
Or equivalently:
EF = (EDV - ESV) / EDV × 100%
Normal values:
- Left ventricle: 55-70% (≥55% considered normal)
- Right ventricle: ~45-50%
Example:
- EDV = 130 mL, ESV = 60 mL
- SV = 130 - 60 = 70 mL
- EF = 70/130 × 100% = 54%
Clinical significance:
- EF < 40% = systolic heart failure (reduced ejection fraction - HFrEF)
- EF > 50% = preserved (HFpEF if heart failure symptoms present)
- Measured by echocardiography, MUGA scan, MRI
Q9. What is the END-DIASTOLIC VOLUME (EDV)?
END-DIASTOLIC VOLUME (EDV) is the volume of blood in the ventricle at the END of diastole (just before systole begins) - i.e., the maximum volume the ventricle reaches after filling.
- Normal value: ~120-130 mL (left ventricle)
- Represents the PRELOAD of the ventricle
- Occurs just before the QRS complex on ECG
Factors that INCREASE EDV:
- Increased venous return
- Slow heart rate (longer filling time)
- Increased blood volume
Factors that DECREASE EDV:
- Decreased venous return
- Tachycardia (shortened filling time)
- Hemorrhage, dehydration
EDV is the starting point: EDV - ESV = Stroke Volume
Q10 / Q46. What happens at the END of VENTRICULAR ISOVOLUMIC CONTRACTION?
ISOVOLUMIC CONTRACTION is the phase where:
- Ventricles contract but ALL VALVES ARE CLOSED
- Volume is CONSTANT (isovolumic)
- Ventricular pressure RISES RAPIDLY
At the END of isovolumic contraction:
- Left ventricular pressure exceeds AORTIC PRESSURE (~80 mmHg)
- Right ventricular pressure exceeds PULMONARY ARTERY PRESSURE (~8 mmHg)
- The AORTIC VALVE (left) and PULMONARY VALVE (right) OPEN
- EJECTION PHASE BEGINS - blood is actively ejected into the arterial system
Sequence:
Isovolumic contraction ends → Semilunar valves open → Rapid ejection begins
Q11. VASCULAR DISTENSIBILITY and COMPLIANCE
VASCULAR DISTENSIBILITY
Distensibility = ΔV / (ΔP × V₀)
- Fractional increase in volume per unit rise in pressure
- Represents the ELASTIC PROPERTY of the vessel wall
- Veins are about 8 times MORE DISTENSIBLE than arteries
VASCULAR COMPLIANCE (Capacitance)
Compliance (C) = ΔV / ΔP
- Total volume of blood stored per unit rise in pressure
- Compliance = Distensibility × Volume
| Vessel | Compliance/Distensibility |
|---|
| Veins | HIGH (large blood reservoir - ~64% of blood volume) |
| Arteries | LOW (maintain pressure, not volume) |
| Capillaries | Very low |
Why is venous compliance so important?
- Veins act as a RESERVOIR - small changes in venous tone shift large blood volumes
- Sympathetic stimulation → VENOCONSTRICTION → shifts blood from veins to heart → increases preload
- This is the basis of AUTOTRANSFUSION effect in exercise and stress
Clinical relevance: Aortic stiffening with age reduces compliance → increases pulse pressure → systolic hypertension
Q12. Sympathetic stimulation of the heart normally causes which condition?
Sympathetic stimulation causes INCREASED CARDIAC OUTPUT via:
- POSITIVE CHRONOTROPY - Increased heart rate (via β₁ receptors on SA node)
- POSITIVE INOTROPY - Increased contractility (stronger contractions, higher SV)
- POSITIVE LUSITROPY - Faster relaxation (enhanced diastolic filling)
- POSITIVE DROMOTROPY - Faster conduction through AV node
Net result: Increased cardiac output, elevated arterial pressure, shift of the Frank-Starling curve upward and to the LEFT.
Mechanism: Norepinephrine/Epinephrine → β₁-adrenergic receptors → ↑cAMP → ↑Ca²⁺ influx → stronger/faster contractions
Sympathetic stimulation normally causes TACHYCARDIA - this is the specific condition most commonly tested.
Q13. What is the END-SYSTOLIC VOLUME (ESV)?
END-SYSTOLIC VOLUME (ESV) is the volume of blood remaining in the ventricle at the END of systole (after ejection is complete) - i.e., the minimum volume the ventricle reaches.
- Normal value: ~50-60 mL (left ventricle)
- This is the blood that was NOT ejected
- SV = EDV - ESV
Factors that INCREASE ESV (less blood ejected):
- Increased afterload (aortic stenosis, hypertension)
- Decreased contractility (heart failure, myocardial infarction)
- Sympathetic withdrawal
Factors that DECREASE ESV (more blood ejected):
- Increased sympathetic stimulation (increased contractility)
- Decreased afterload
Q14 / Q37 / Q50. Which event is associated with the FIRST HEART SOUND?
S1 ("LUB") is caused by:
CLOSURE OF THE MITRAL (BICUSPID) AND TRICUSPID VALVES (AV valves)
- Occurs at the BEGINNING OF SYSTOLE
- Specifically at the ONSET OF ISOVOLUMIC CONTRACTION
- When ventricular pressure rises above atrial pressure → AV valves snap shut
Timing on cardiac cycle:
- Coincides with the END OF THE QRS COMPLEX / BEGINNING OF S-T SEGMENT on ECG
- Heard loudest at MITRAL AREA (apex) and TRICUSPID AREA (lower sternal border)
Components of S1:
- Mainly mitral valve closure (M1) - slightly before tricuspid (T1)
- The "LUB" in "LUB-DUB"
Mnemonic: "M1T1" closes at S1 (atrioventricular valves = START of systole)
Q15. CURRENT OF INJURY. The J POINT. CORONARY ISCHEMIA as a cause of current of injury.
CURRENT OF INJURY
- When myocardial cells are DAMAGED or ISCHEMIC, they cannot maintain their normal resting membrane potential
- The injured cells are PARTIALLY DEPOLARIZED at rest → leak positive current into surrounding normal cells
- This creates a CURRENT FLOWING FROM INJURED (positive) → NORMAL (negative) tissue = Current of injury
J POINT (Junction Point)
- The J POINT is the point where the QRS complex ends and the ST segment begins
- Normally at the ISOELECTRIC BASELINE
- In current of injury: the J point is DISPLACED
ST SEGMENT CHANGES with Ischemia
| Condition | ST Change | Mechanism |
|---|
| TRANSMURAL ISCHEMIA (full thickness) | ST ELEVATION | Current of injury - baseline shifts down during diastole |
| SUBENDOCARDIAL ISCHEMIA | ST DEPRESSION | Subendocardium depolarized, outer surface negative |
CORONARY ISCHEMIA
- During ischemia, the RESTING MEMBRANE POTENTIAL of affected cells is less negative (depolarized)
- This means during the TQ segment (diastole), current flows from normal cells to injured cells
- On ECG: TQ segment is depressed, but because ECG is AC-coupled (baseline correction), this appears as ST ELEVATION
- J point shifts ABOVE the isoelectric line
Clinical: ST elevation → STEMI (ST-elevation MI) → needs urgent revascularization
Q16 / Q56. How can the HEART RATE be calculated by the R-R INTERVAL of ECG?
Heart Rate = 60 / R-R interval (in seconds)
Or if the R-R interval is measured in LARGE SQUARES (each = 0.2 seconds at standard ECG speed of 25 mm/s):
HR = 300 / Number of large squares between R peaks
Or using small squares (each = 0.04 seconds):
HR = 1500 / Number of small squares between R peaks
Examples:
- R-R = 1 second → HR = 60 bpm
- R-R = 0.6 seconds → HR = 100 bpm
- 5 large squares → HR = 300/5 = 60 bpm
- 4 large squares → HR = 300/4 = 75 bpm
For IRREGULAR rhythms: Count the number of R-R intervals in a 6-second strip and multiply by 10, OR count R waves in 10 seconds and multiply by 6.
Q17. List the ELECTROCARDIOGRAPHIC LEADS
ECG uses 12 STANDARD LEADS total:
LIMB LEADS (Bipolar - Einthoven's Triangle)
| Lead | Positive Electrode | Negative Electrode |
|---|
| Lead I | Left Arm (LA) | Right Arm (RA) |
| Lead II | Left Leg (LL) | Right Arm (RA) |
| Lead III | Left Leg (LL) | Left Arm (LA) |
AUGMENTED UNIPOLAR LIMB LEADS (aVL, aVR, aVF)
- aVR = augmented Right arm (views right shoulder)
- aVL = augmented Left arm (views left shoulder)
- aVF = augmented Left Foot (views inferior wall)
- Each uses one limb as positive, average of other two as negative (Wilson central terminal)
PRECORDIAL (CHEST) LEADS - V1 through V6
| Lead | Position |
|---|
| V1 | 4th intercostal space, RIGHT sternal border |
| V2 | 4th intercostal space, LEFT sternal border |
| V3 | Between V2 and V4 |
| V4 | 5th intercostal space, midclavicular line |
| V5 | Anterior axillary line, same level as V4 |
| V6 | Midaxillary line, same level as V4-V5 |
EINTHOVEN'S LAW: Lead II = Lead I + Lead III (algebraically)
Q18. Which VASOACTIVE AGENT is usually the most important controller of CORONARY BLOOD FLOW?
ADENOSINE is the most important LOCAL metabolic regulator of coronary blood flow.
Mechanism:
- When myocardial O₂ demand increases → increased metabolic activity → ATP breakdown → ADENOSINE released
- Adenosine is a potent VASODILATOR of coronary arterioles → increases coronary blood flow to match O₂ demand
- This is the basis of METABOLIC AUTOREGULATION ("feed-forward" mechanism)
Other important vasoactive agents for coronary circulation:
| Agent | Effect | Notes |
|---|
| Adenosine | Vasodilation | PRIMARY controller |
| O₂ (low) | Vasodilation | Hypoxia directly dilates |
| CO₂ (high) | Vasodilation | |
| NO (nitric oxide) | Vasodilation | Endothelium-derived |
| Epinephrine/NE | β₂ → dilation, α → constriction | Net = dilation with exercise |
Key fact: Coronary blood flow is ~250 mL/min at rest = ~5% of cardiac output. The heart extracts ~70-80% of O₂ from blood (vs ~25% for other organs), so increased O₂ demand can ONLY be met by INCREASED FLOW.
Q19. The ARTERIAL PRESSURE PULSATIONS. Clinical methods for measuring SYSTOLIC and DIASTOLIC pressures.
ARTERIAL PRESSURE PULSATIONS
- Caused by INTERMITTENT ejection of blood into aorta during systole
- SYSTOLIC PRESSURE = peak pressure during ventricular contraction (~120 mmHg)
- DIASTOLIC PRESSURE = minimum pressure during ventricular relaxation (~80 mmHg)
- PULSE PRESSURE = Systolic - Diastolic = ~40 mmHg
- MEAN ARTERIAL PRESSURE (MAP) = Diastolic + 1/3 Pulse Pressure = ~93 mmHg
Pulse pressure is determined by:
- SV (stroke volume) - larger SV → larger pulse pressure
- Arterial compliance - stiffer arteries → larger pulse pressure (elderly)
CLINICAL METHODS for Measuring BP
1. AUSCULTATORY METHOD (Standard - Korotkoff Sounds)
- Inflate BP cuff above systolic → deflate slowly
- KOROTKOFF SOUNDS appear when cuff pressure = systolic (flow resumes turbulently)
- Sounds DISAPPEAR when cuff pressure = diastolic (flow becomes laminar/silent)
- Systolic = pressure when first sound is heard (K1)
- Diastolic = pressure when sounds disappear (K5)
2. PALPATORY METHOD
- Feel radial pulse while deflating cuff
- Pressure at which pulse RETURNS = systolic (cannot determine diastolic)
3. OSCILLOMETRIC METHOD (Automated digital devices)
- Detects oscillations in cuff pressure from arterial wall pulsations
- MAP determined at maximum oscillations; systolic/diastolic derived algorithmically
4. INTRA-ARTERIAL (Direct/Invasive)
- Arterial catheter (usually radial artery) → pressure transducer
- Gold standard, continuous monitoring, used in ICU
Q20. Which would TEND TO INCREASE capillary FILTRATION RATE?
Filtration rate is governed by the STARLING FORCES (net filtration pressure):
NFP = (Pc - Pi) - (πc - πi)
Where:
- Pc = capillary hydrostatic pressure
- Pi = interstitial hydrostatic pressure
- πc = plasma oncotic pressure (colloid osmotic)
- πi = interstitial oncotic pressure
Factors that INCREASE filtration:
| Factor | Effect | Example |
|---|
| ↑ Pc (capillary hydrostatic pressure) | INCREASE filtration | Hypertension, venous obstruction, heart failure |
| ↓ πc (plasma oncotic pressure) | INCREASE filtration | Hypoproteinemia, liver disease, nephrotic syndrome |
| ↑ πi (interstitial oncotic pressure) | INCREASE filtration | Lymphatic obstruction |
| ↑ Capillary permeability | INCREASE filtration | Inflammation, histamine |
Result of excess filtration → EDEMA
Q21. How is the NORMAL RHYTHM OF THE AV NODE?
AV NODAL RHYTHM (Junctional Rhythm):
- Intrinsic rate: 40-60 beats/min (escape rhythm)
- Fires only when SA node FAILS or is blocked
- P waves are ABSENT, INVERTED, or BURIED in QRS
- QRS is narrow (normal) if impulse travels normally through bundle of His
Normal physiology of AV node:
- AV node receives impulses from SA node (~70 bpm)
- Its own automaticity (40-60 bpm) is SUPPRESSED by the faster SA node
- If SA node fails → AV node takes over as SUBSIDIARY PACEMAKER
Q22 / Q54. When recording LEAD II on an ECG, which is the POSITIVE ELECTRODE?
In Lead II:
- POSITIVE ELECTRODE = LEFT LEG (LL) / Left Foot
- NEGATIVE ELECTRODE = RIGHT ARM (RA)
This means Lead II records current flowing FROM right arm TOWARD left leg (inferior-leftward direction), which is nearly parallel to the MEAN ELECTRICAL AXIS of the normal heart.
Result: Lead II normally shows the TALLEST, MOST UPRIGHT P waves and QRS complexes of all limb leads - it is the "best" lead for rhythm analysis.
Q23. The VEINS and their FUNCTIONS
Structural features
- Thin walls (less smooth muscle and elastic tissue than arteries)
- Large lumens
- Contain VENOUS VALVES (prevent backflow, especially in extremities)
- Contain ~64% of total blood volume at any time
Functions of Veins
- BLOOD RESERVOIR (Capacitance Vessels)
- Veins store the bulk of circulating blood volume
- High compliance allows large volume storage with little pressure change
- Sympathetic constriction can mobilize 300-500 mL of blood rapidly
- RETURN OF BLOOD TO THE HEART (Venous Return)
- Driven by the pressure gradient between peripheral veins (~15 mmHg) and right atrium (~0 mmHg)
- Assisted by: venous valves, skeletal muscle pump, respiratory pump (negative thoracic pressure during inspiration)
- PRESSURE RESERVOIR at low pressure
- Systemic venous pressure = 0-10 mmHg (vs arterial 80-120 mmHg)
- THERMOREGULATION
- Cutaneous veins dilate to dissipate heat; constrict to conserve body heat
- ABSORPTION
- Portal veins carry absorbed nutrients from gut to liver
Q24. A decrease in which would tend to INCREASE LYMPH FLOW?
A decrease in PLASMA ONCOTIC PRESSURE (πc) would tend to increase lymph flow.
Reasoning (Starling Forces):
- Decreased plasma oncotic pressure → Less reabsorption of fluid from interstitium back into capillaries → More fluid accumulates in interstitial space → Increased lymphatic drainage
Also, a decrease in:
- Interstitial fluid pressure (Pi) - if more negative (rare) can promote filtration
- Actually: decrease in Pi in certain tissues leads to increased capillary filtration
Most correct answer: A DECREASE IN PLASMA COLLOID OSMOTIC PRESSURE increases capillary filtration → overwhelms lymphatic return capacity → promotes increased lymph flow to drain excess fluid.
Other factors that increase lymph flow:
- Increased capillary hydrostatic pressure
- Increased capillary permeability
- Elevated interstitial oncotic pressure (lymphatic blockage)
Q25. How is the NORMAL RHYTHM of the SINUS NODE?
SINUS RHYTHM (Normal Sinus Rhythm - NSR):
- Intrinsic rate: 60-100 beats/min (adult resting)
- Actually, the intrinsic pacemaker rate of the SA node is ~100 bpm
- At REST, vagal tone slows it to ~70 bpm
ECG characteristics of Normal Sinus Rhythm:
- P wave present before every QRS
- P wave UPRIGHT in Lead II, inverted in aVR
- P-R interval: 0.12-0.20 seconds (3-5 small squares)
- QRS: narrow (<0.12 sec)
- Regular R-R intervals
- Rate 60-100 bpm
The SA node fires spontaneously due to PACEMAKER POTENTIAL - slow depolarization caused by "funny current" (If) which is an inward Na⁺ current, plus Ca²⁺ current through T-type channels.
Q26 / (complement to Q22). When recording LEAD II on an ECG, which is the NEGATIVE ELECTRODE?
In Lead II:
- NEGATIVE ELECTRODE = RIGHT ARM (RA)
- Positive electrode = Left Leg (LL)
(See also Q22 above)
Q27. LOCAL CONTROL OF BLOOD FLOW by tissues. HORMONAL REGULATION.
LOCAL (INTRINSIC/AUTOREGULATION) CONTROL
1. METABOLIC THEORY
- Tissues release VASODILATORY metabolites proportional to metabolic activity:
- CO₂ (increase → vasodilation)
- H⁺ (decreased pH → vasodilation)
- Adenosine (most potent local vasodilator)
- K⁺ (released during muscle contraction)
- Lactic acid, hypoxia (low O₂)
- These metabolites relax arteriolar smooth muscle → local vasodilation → increased local flow to match demand
2. MYOGENIC THEORY (Bayliss Effect)
- Arterioles stretch when transmural pressure increases → smooth muscle contracts (VASOCONSTRICTION)
- Prevents over-distension and maintains constant flow despite pressure changes
- Basis of PRESSURE AUTOREGULATION (brain, kidney, heart)
3. LOCAL ENDOTHELIAL FACTORS
- NO (Nitric Oxide) - potent vasodilator (shear stress-induced)
- Prostacyclin (PGI₂) - vasodilator
- Endothelin-1 - vasoconstrictor
- Bradykinin - vasodilator
HORMONAL (HUMORAL) REGULATION
| Hormone | Effect | Mechanism |
|---|
| Epinephrine | Vasodilation (β₂) in muscle; Vasoconstriction (α₁) in skin/gut | Adrenal medulla |
| Norepinephrine | VASOCONSTRICTION (α₁ dominant) | Sympathetic nerves, adrenal medulla |
| Angiotensin II | VASOCONSTRICTION (potent) | RAAS activation |
| Vasopressin (ADH) | VASOCONSTRICTION (V1 receptors) | Posterior pituitary |
| Histamine | VASODILATION, increased permeability | Mast cells, inflammation |
| Bradykinin | VASODILATION | Kallikrein-kinin system |
| ANP/BNP | VASODILATION | Atrial stretch |
Q28. The TENDENCY for TURBULENT FLOW is greatest in which part of the circulation?
TURBULENT FLOW is greatest in the AORTA (and major arteries during systole)
Why?
- Reynolds number is highest where:
- VELOCITY IS HIGH (aorta receives entire stroke volume rapidly)
- DIAMETER IS LARGE (aorta)
- Re in the aorta during peak systole can reach 3000-4000 → turbulent
Hierarchy of turbulence tendency:
- AORTA (especially during systole) - highest Re
- Large elastic arteries
- Muscular arteries
- Arterioles (high resistance but small diameter, lower velocity)
- Capillaries (very slow, laminar)
Also significant: turbulence at sites of stenosis, bifurcations (carotid bifurcation), and across diseased heart valves (produces murmurs).
Q29. Which stages of the cardiac cycle does DIASTOLE include?
DIASTOLE includes 3 phases:
- ISOVOLUMIC RELAXATION
- All valves CLOSED
- Ventricles relax rapidly
- Ventricular pressure falls but volume unchanged
- Ends when AV valves open
- RAPID VENTRICULAR FILLING (Early Diastole)
- Mitral/tricuspid valves OPEN
- Blood rushes from atria into ventricles
- ~70-80% of ventricular filling occurs here
- Produces the "opening snap" sounds (S3 when abnormal)
- SLOW FILLING (Diastasis)
- Slow equalization of atrial and ventricular pressures
- Minimal blood flow
- ATRIAL SYSTOLE (Atrial Kick)
- Final ~20-30% of ventricular filling
- P wave on ECG → atrial contraction
- Important at high heart rates when passive filling decreases
- Produces S4 sound when abnormal
Simple rule: Diastole = from CLOSURE of semilunar valves → to CLOSURE of AV valves (i.e., all of ventricular relaxation and filling)
Q30. Which of the VESSELS has the greatest TOTAL CROSS-SECTIONAL AREA in the circulatory system?
CAPILLARIES have the greatest total cross-sectional area.
| Vessel Type | Approx. Total Cross-sectional Area |
|---|
| Aorta | ~4.5 cm² |
| Large arteries | ~20 cm² |
| Arterioles | ~400 cm² |
| Capillaries | ~4,500-5,000 cm² (LARGEST) |
| Venules | ~4,000 cm² |
| Veins | ~40 cm² |
| Vena cava | ~18 cm² |
Consequence - VELOCITY OF BLOOD FLOW:
Q = A × v → v = Q/A
Since flow (Q) must be constant throughout the circulation (conservation of mass), velocity is INVERSELY PROPORTIONAL to cross-sectional area:
- Aorta: fastest (~40 cm/s)
- Capillaries: SLOWEST (~0.07 cm/s) → allows time for gas/nutrient exchange!
Q31. NERVOUS REGULATION of the circulation (VASOMOTOR CENTER)
THE VASOMOTOR CENTER
Located in the RETICULAR FORMATION of the MEDULLA OBLONGATA and lower pons
Components:
- VASOCONSTRICTOR AREA (C1 area) - tonically active, sends sympathetic signals to maintain basal vascular tone
- VASODILATOR AREA - inhibits the vasoconstrictor area
- SENSORY AREA - receives baroreceptor and chemoreceptor input (NTS - Nucleus Tractus Solitarius)
How it works:
- Continuous sympathetic outflow from vasomotor center → VASOMOTOR TONE (maintains arterioles at partial constriction ~50%)
- Increased vasomotor activity → VASOCONSTRICTION → increased resistance → increased BP
- Decreased vasomotor activity → VASODILATION → decreased resistance → decreased BP
Inputs to vasomotor center:
| Input | Effect on VMC |
|---|
| BARORECEPTORS (↑BP) | INHIBIT VMC → vasodilation (negative feedback) |
| CHEMORECEPTORS (↓O₂, ↑CO₂) | STIMULATE VMC → vasoconstriction |
| Hypothalamus | Modulates temperature, emotion responses |
| Cerebral cortex | Mediates "fight-or-flight", fainting |
| Ischemic response | Extreme ↑BP if brain ischemic |
Sympathetic pathways:
- Vasomotor center → spinal cord (intermediolateral column) → sympathetic ganglia → norepinephrine on α₁ receptors of arterioles → vasoconstriction
Q32. What happens if the SINUS NODE FAILS?
If the SA node fails, the next pacemaker in the CONDUCTION HIERARCHY takes over:
Hierarchy of Pacemakers (Escape Pacemakers)
| Pacemaker | Intrinsic Rate | Takes over when... |
|---|
| SA Node (sinoatrial) | 60-100 bpm | Normal pacemaker |
| AV Node (junctional) | 40-60 bpm | SA node fails |
| Bundle of His | 20-40 bpm | AV node fails |
| Purkinje fibers/Ventricle | 15-40 bpm | Bundle of His fails |
When SA node fails:
- AV NODAL RHYTHM (Junctional Escape) takes over at 40-60 bpm
- ECG shows: absent/inverted P waves, narrow QRS at 40-60 bpm
- If AV node also fails → idioventricular rhythm (15-40 bpm) - very dangerous
Clinically: SA node failure → SICK SINUS SYNDROME → may require PACEMAKER implantation
Q33. Which stages of the cardiac cycle does SYSTOLE include?
SYSTOLE includes 2 phases:
- ISOVOLUMIC CONTRACTION
- All valves CLOSED
- Ventricles contract (tension builds)
- Pressure rises rapidly
- No change in volume
- Ends when semilunar valves open
- VENTRICULAR EJECTION (Systolic ejection phase)
- Rapid ejection (first 2/3): aortic/pulmonary valves open, blood ejected quickly
- Reduced ejection (last 1/3): slower ejection, pressure begins to decline
Timing of systole:
- Begins: onset of QRS (ventricular depolarization) → MITRAL VALVE CLOSES (S1)
- Ends: AORTIC VALVE CLOSES (S2)
- Duration: ~0.3 seconds at resting HR of 72 bpm
Mnemonic: Systole = "SQUEEZE" phase (Isovolumic contraction + Ejection)
Q34. How does blood FLOW CHANGE in a vessel when VISCOSITY OF BLOOD INCREASES?
Answer: BLOOD FLOW DECREASES
From Poiseuille's Law: Q = ΔP × π × r⁴ / (8 × η × L)
Flow (Q) is INVERSELY PROPORTIONAL to viscosity (η)
- If viscosity doubles → flow HALVES (at constant pressure)
- If viscosity increases → vascular resistance increases → flow decreases
Clinical Example - Polycythemia:
- Hematocrit rises from 40% to 70%
- Viscosity increases ~10-fold
- Blood flow can drop dramatically
- Risk: THROMBOSIS, STROKE, myocardial infarction
Note: The body partially compensates by increasing cardiac output and blood pressure, but blood flow to tissues is still impaired at very high viscosities.
Q35. Role of the NERVOUS SYSTEM for RAPID CONTROL of ARTERIAL PRESSURE
The nervous system provides FAST pressure control (seconds to minutes) via:
1. BARORECEPTOR REFLEX (Most important rapid mechanism)
- BARORECEPTORS located in the CAROTID SINUS and AORTIC ARCH
- Sense stretch (wall tension) when BP rises
- Signal via Hering's nerve (CN IX) and vagus nerve (CN X) to NTS in medulla
When BP RISES:
↑BP → ↑baroreceptor firing → ↑parasympathetic, ↓sympathetic → ↓HR, ↓contractility, VASODILATION → ↓BP (negative feedback)
When BP FALLS:
↓BP → ↓baroreceptor firing → ↓parasympathetic, ↑sympathetic → ↑HR, ↑contractility, VASOCONSTRICTION → ↑BP
- Speed of response: within SECONDS
- Range: most effective between 60-180 mmHg
- Limitation: adapts/resets over 1-2 days (cannot maintain long-term BP control)
2. CHEMORECEPTOR REFLEX
- Peripheral chemoreceptors (carotid/aortic bodies): respond to ↓O₂, ↑CO₂, ↓pH
- Central chemoreceptors (medulla): respond primarily to ↑CO₂
- Stimulation → vasoconstriction → ↑BP
3. CNS ISCHEMIC RESPONSE (Cushing Reflex)
- When brain is ischemic (very low BP/high ICP): EXTREME sympathetic discharge
- Raises BP dramatically as "last resort"
- Cushing triad: hypertension, bradycardia, irregular breathing
4. ATRIAL STRETCH (BAINBRIDGE REFLEX)
- Increased atrial volume → accelerates heart rate (tachycardia) → increases CO → increases BP
Q38. (Duplicate of Q2) - Structure with SLOWEST conduction: AV NODE - see Q2 above.
Q39. The RENIN-ANGIOTENSIN SYSTEM (RAS)
Overview
The RAS is a HORMONAL SYSTEM for LONG-TERM blood pressure control and fluid balance regulation.
Step-by-step pathway:
LOW BP / Low renal perfusion / Low Na+
         ↓
JUXTAGLOMERULAR CELLS of kidney release
         ↓
    RENIN (enzyme)
         ↓
Cleaves ANGIOTENSINOGEN (from liver)
         ↓
    ANGIOTENSIN I (10 amino acids, inactive)
         ↓
Converted by ACE (Angiotensin Converting Enzyme)
in LUNGS (primarily)
         ↓
    ANGIOTENSIN II (8 amino acids, ACTIVE)
Effects of ANGIOTENSIN II (via AT₁ receptors):
| Action | Location | Effect |
|---|
| VASOCONSTRICTION (potent) | Arterioles | ↑ Resistance → ↑BP |
| Stimulates ALDOSTERONE | Adrenal cortex | ↑Na⁺/H₂O reabsorption → ↑blood volume |
| ADH release | Pituitary | ↑Water reabsorption |
| Thirst | Hypothalamus | ↑Water intake |
| Renal Na⁺ reabsorption | Proximal tubule | Directly promotes Na⁺ reabsorption |
| Sympathetic stimulation | Central + peripheral | ↑NE release |
Clinical significance:
- ACE inhibitors (enalapril, lisinopril) block conversion of Ang I → Ang II → treat hypertension, heart failure
- ARBs (losartan, valsartan) block AT₁ receptor
- Spironolactone blocks aldosterone
Q41. Which SEGMENT of the circulatory system has the LOWEST VELOCITY of blood flow?
CAPILLARIES have the lowest velocity of blood flow.
- Velocity ≈ 0.07 mm/s in capillaries
- Compare: Aorta ≈ 40 cm/s
Why so slow in capillaries?
- By continuity equation: Q = A × v (constant flow throughout system)
- Capillaries have the greatest total cross-sectional area (~4,500-5,000 cm²)
- Therefore velocity must be LOWEST in capillaries
Physiological importance of slow capillary flow:
- Allows TIME (1-2 seconds) for O₂, CO₂, nutrients, waste to exchange between blood and tissues
- Slow flow = efficient exchange
Q43. CONTROL OF CARDIAC OUTPUT by VENOUS RETURN and NERVOUS SYSTEM
1. VENOUS RETURN CONTROL (Primary mechanism)
The heart operates by the FRANK-STARLING MECHANISM:
- More venous return → more stretch of ventricle → stronger contraction → more CO
- CO = Venous Return (in steady state)
MEAN SYSTEMIC FILLING PRESSURE (MSFP):
- The equilibrium pressure that would exist if the heart stopped (~7 mmHg)
- Driving force for venous return: MSFP - RAP (Right Atrial Pressure)
-
Venous Return = (MSFP - RAP) / Venous Resistance
Factors increasing venous return:
- ↑Blood volume (IV fluids, venoconstriction)
- ↑Skeletal muscle pump (exercise)
- ↑Respiratory pump (deep breathing)
- ↓RAP (improves gradient)
2. NERVOUS SYSTEM CONTROL
-
SYMPATHETIC STIMULATION:
-
Heart: ↑HR (chronotropy), ↑contractility (inotropy) → shifts cardiac function curve UP
-
Veins: VENOCONSTRICTION → ↑MSFP → more venous return
-
Net effect: LARGE INCREASE in CO
-
PARASYMPATHETIC STIMULATION:
-
Primarily slows HR (negative chronotropy)
-
Minimal effect on contractility or veins
-
Net: decreased CO when predominant
Cardiac Function Curve + Venous Return Curve:
CO is determined at the INTERSECTION of the two curves. Sympathetic stimulation moves the cardiac function curve upward AND shifts the venous return curve right (via venoconstriction increasing MSFP), resulting in a large increase in CO.
Q45. Which BLOOD VESSEL has the HIGHEST VASCULAR RESISTANCE?
ARTERIOLES have the highest vascular resistance.
| Vessel | % of Total Peripheral Resistance |
|---|
| Aorta + large arteries | ~19% |
| Arterioles | ~47-50% (HIGHEST) |
| Capillaries | ~27% |
| Veins | ~7% |
Why arterioles?
- Small diameter (15-100 μm) → highest resistance per unit length (R ∝ 1/r⁴)
- Have a thick layer of smooth muscle (can dramatically change radius)
- Are the primary site of PERIPHERAL RESISTANCE CONTROL
- Sympathetic nerves heavily innervate arterioles
Arterioles = the "resistance vessels" of the circulation
Q47. VENOUS RETURN. MEAN SYSTEMIC FILLING PRESSURE. REGULATION of VENOUS RETURN.
VENOUS RETURN
The volume of blood returning from the systemic veins to the RIGHT ATRIUM per minute.
- Equal to Cardiac Output in steady state (~5 L/min)
MEAN SYSTEMIC FILLING PRESSURE (MSFP) = ~7 mmHg
- The pressure throughout the entire vascular system when the heart is stopped
- Represents the "fullness" of the vascular system
- MSFP is increased by: increased blood volume, venoconstriction (sympathetic stimulation)
- MSFP is decreased by: decreased blood volume, venodilation
Formula:
Venous Return = (MSFP - RAP) / Resistance to Venous Return
REGULATION of VENOUS RETURN
1. MSFP (Volume and tone)
- ↑Blood volume → ↑MSFP → ↑VR
- Sympathetic venoconstriction → ↑MSFP → ↑VR
2. RIGHT ATRIAL PRESSURE (RAP)
- ↑RAP (e.g., heart failure) → reduces pressure gradient → ↓VR
- ↓RAP → increases gradient → ↑VR
3. SKELETAL MUSCLE PUMP
- Muscle contraction compresses veins → squeezes blood toward heart
- Venous valves prevent backflow
- Major during EXERCISE
4. RESPIRATORY PUMP
- Inspiration → negative intrathoracic pressure → expands thoracic veins/right atrium → sucks blood in
- Increases VR during inspiration
5. STANDING/GRAVITY EFFECTS
- Standing: venous pooling in lower limbs → decreased VR
- Compensated by sympathetic reflex vasoconstriction
Q49. Which PART of the CIRCULATION has the HIGHEST COMPLIANCE?
VEINS (venous system) have the highest compliance.
- Veins contain ~64% of total blood volume
- Venous compliance is ~20-24 times that of arteries
- A small change in venous pressure causes a LARGE change in venous volume
| Location | Approximate Blood Volume |
|---|
| Systemic arteries | ~11% |
| Systemic capillaries | ~5% |
| Systemic veins | ~64% |
| Heart | ~7% |
| Pulmonary circulation | ~9% |
Veins = "Capacitance vessels"
High venous compliance is the reason why:
- Blood volume shifts cause large pressure changes only slowly
- Sympathetic venoconstriction can rapidly increase venous return (auto-transfusion)
Q51. The CORONARY CIRCULATION
Anatomy
- RIGHT CORONARY ARTERY (RCA): supplies right ventricle, inferior/posterior left ventricle, SA node (60%), AV node (80%), posterior interventricular septum
- LEFT CORONARY ARTERY (LCA) divides into:
- LAD (Left Anterior Descending): anterior LV, anterior 2/3 of interventricular septum, apex - "artery of sudden death"
- LCX (Left Circumflex): lateral/posterior LV, SA node (40%)
Blood Flow
- Normal coronary flow: ~250 mL/min = ~5% of CO
- Heart extracts ~70-80% of O₂ from blood (highest of any organ)
- Can increase flow 4-5 times during exercise (coronary reserve)
Unique Feature - PHASIC FLOW
- LEFT CORONARY: Flows primarily in DIASTOLE (compressed during systole by high intramyocardial pressure)
- RIGHT CORONARY: Flows in both systole and diastole (lower pressures in RV)
Regulation of Coronary Flow
- METABOLIC AUTOREGULATION (primary): Adenosine, CO₂, O₂, K⁺, H⁺
- MYOGENIC: pressure autoregulation
- NEURAL: sympathetic (α₁ constriction, β₂ dilation); net = dilation via metabolic override
- ENDOTHELIAL: NO (nitric oxide) is a key dilator
Clinical Correlates
- Coronary artery disease (CAD): atherosclerosis reduces lumen → ischemia
- Angina: O₂ demand > supply → chest pain
- STEMI: complete occlusion → infarction
Q53. List the STAGES OF THE CARDIAC CYCLE
The cardiac cycle has 7 stages (Guyton):
| Stage | Valves | Volume | Events |
|---|
| 1. Atrial Systole | AV open, Semilunar closed | EDV increases | Atrial contraction (P wave); final ventricular filling |
| 2. Isovolumic Contraction | ALL CLOSED | Constant (EDV) | Pressure rises rapidly; S1 heart sound (AV valves close) |
| 3. Rapid Ejection | Semilunar OPEN, AV closed | Decreases rapidly | Blood ejected into aorta/PA; highest ventricular pressure |
| 4. Reduced Ejection | Semilunar open, AV closed | Continues decreasing | Ejection slows; T wave on ECG |
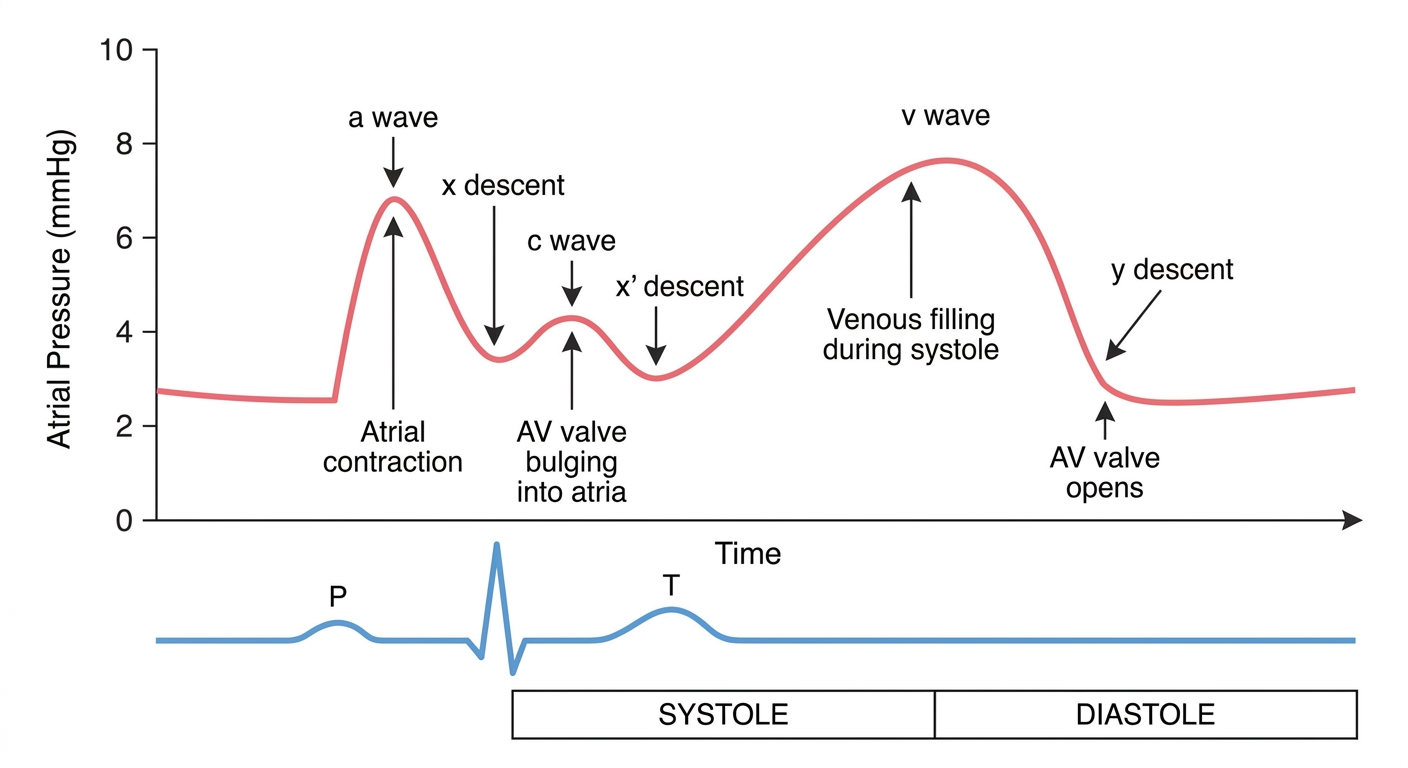
| 5. Isovolumic Relaxation | ALL CLOSED | Constant (ESV) | Pressure falls rapidly; S2 heart sound (semilunar valves close) |
| 6. Rapid Ventricular Filling | AV OPEN, Semilunar closed | Increases rapidly | ~70-80% of filling; possible S3 |
| 7. Slow Filling (Diastasis) | AV open, Semilunar closed | Slowly increases | Equalization of atrial/ventricular pressures |
SYSTOLE = stages 2, 3, 4
DIASTOLE = stages 5, 6, 7 (+ stage 1 of next cycle)
Q55. Describe the SPECIALIZED CONDUCTIVE SYSTEM of the HEART
The conductive system is responsible for the orderly generation and spread of electrical impulses to coordinate the cardiac cycle.
Components (in order of impulse travel):
1. SINOATRIAL (SA) NODE
- Location: Right atrium, near opening of superior vena cava
- The PRIMARY PACEMAKER (fastest intrinsic rate: 60-100 bpm)
- Fires spontaneously due to If "funny current" (HCN channels) + ICaT
- Impulse spreads through atria → atrial depolarization (P wave)
2. INTERNODAL PATHWAYS
- Conduct impulse through RIGHT ATRIUM to AV node
- 3 pathways: anterior (Bachmann's bundle to left atrium), middle, posterior
- Conduction: ~1 m/s
3. ATRIOVENTRICULAR (AV) NODE
- Location: Floor of right atrium, base of interatrial septum (Koch's triangle)
- GATEWAY between atria and ventricles
- Slowest conduction: 0.02-0.05 m/s → AV delay of ~0.1 second
- Intrinsic rate: 40-60 bpm (escape pacemaker)
- Acts as "frequency filter" - limits ventricular rate in atrial tachycardias
4. BUNDLE OF HIS (AV Bundle)
- Penetrates fibrous skeleton, connecting atria to ventricles
- ONLY normal electrical connection between atria and ventricles
- Divides into RIGHT and LEFT BUNDLE BRANCHES
- Intrinsic rate: 20-40 bpm
5. BUNDLE BRANCHES
- RIGHT BUNDLE BRANCH: right ventricle
- LEFT BUNDLE BRANCH: splits into anterior and posterior FASCICLES for left ventricle
6. PURKINJE FIBER NETWORK
- Terminal network of specialized conducting fibers
- FASTEST conduction: 1.5-4.0 m/s
- Rapidly spread impulse to all ventricular myocardium
- Ensures SIMULTANEOUS contraction of ventricles (maximum pumping efficiency)
- Intrinsic rate: 15-40 bpm (lowest escape rate)
Summary diagram (pathway):
SA Node → Atrial Myocardium → AV Node (DELAY ~0.1s) → Bundle of His →
Left Bundle Branch + Right Bundle Branch → Purkinje Fibers → Ventricular Myocardium
P-R interval on ECG = time from SA node firing to ventricular depolarization = 0.12-0.20 sec (reflects AV node delay + His-Purkinje conduction)
QUICK REFERENCE SUMMARY TABLE
| Q# | Topic | Key Answer |
|---|
| 1 | Stroke Volume | SV = EDV - ESV (~70 mL) |
| 2/38 | Slowest conduction | AV NODE (0.02-0.05 m/s) |
| 3 | Poiseuille's Law | Q = ΔP×πr⁴/8ηL; ↑viscosity → ↓flow |
| 4/36/40/48 | CO calculation | CO = HR × SV; Fick; Thermodilution |
| 5 | Cardiac Output | ~5 L/min; HR × SV |
| 6/42 | End of isovolumic relaxation | AV valves OPEN → filling begins |
| 7 | Turbulent flow / Reynolds | Re = ρvd/η; >3000 = turbulent |
| 8/44/52 | Ejection Fraction | EF = SV/EDV × 100% (normal ≥55%) |
| 9 | EDV | ~130 mL; PRELOAD; max volume |
| 10/46 | End of isovolumic contraction | Semilunar valves OPEN → ejection |
| 11 | Distensibility/Compliance | Veins most compliant; C = ΔV/ΔP |
| 12 | Sympathetic stimulation | Tachycardia, ↑inotropy, ↑CO |
| 13 | ESV | ~60 mL; minimum volume |
| 14/37/50 | 1st heart sound (S1) | CLOSURE of MITRAL + TRICUSPID valves |
| 15 | Current of injury/J point | Ischemia → ST elevation; J = QRS-ST junction |
| 16/56 | Heart rate from ECG | HR = 60/R-R sec = 300/large squares |
| 17 | ECG leads | 12 leads: I, II, III, aVR, aVL, aVF, V1-V6 |
| 18 | Coronary flow controller | ADENOSINE (primary metabolic regulator) |
| 19 | Arterial pulsations | Korotkoff sounds; PP = Sys-Dias |
| 20 | Increase filtration rate | ↑Pc, ↓πc, ↑permeability |
| 21 | AV node rhythm | 40-60 bpm (escape) |
| 22/54 | Lead II positive electrode | LEFT LEG (LL) |
| 23 | Veins functions | Reservoir, return, capacitance (64% volume) |
| 24 | ↑Lymph flow | ↓Plasma oncotic pressure |
| 25 | Sinus node rhythm | 60-100 bpm; NSR |
| 26 | Lead II negative electrode | RIGHT ARM (RA) |
| 27 | Local/hormonal regulation | Adenosine/NO local; Ang II/NE humoral |
| 28 | Most turbulent | AORTA (during systole) |
| 29 | Diastole stages | Isovolumic relaxation + rapid fill + diastasis + atrial systole |
| 30 | Greatest cross-sectional area | CAPILLARIES |
| 31 | Vasomotor center | Medulla oblongata; baroreceptor reflex center |
| 32 | SA node fails | AV node takes over (40-60 bpm) |
| 33 | Systole stages | Isovolumic contraction + ejection |
| 34 | ↑Viscosity → flow | DECREASES (inversely proportional) |
| 35 | Rapid BP control | Baroreceptor reflex (SECONDS) |
| 39 | RAAS | Renin→Ang I→Ang II→aldosterone→↑BP |
| 41 | Lowest velocity | CAPILLARIES (~0.07 mm/s) |
| 43 | CO control | Frank-Starling + sympathetic |
| 45 | Highest resistance | ARTERIOLES (~47-50% TPR) |
| 47 | Venous return | MSFP ~7 mmHg; VR = (MSFP-RAP)/R |
| 49 | Highest compliance | VEINS (capacitance vessels) |
| 51 | Coronary circulation | RCA, LAD, LCX; left flows in diastole |
| 53 | Stages of cardiac cycle | 7 stages; Systole (2-4); Diastole (5-7+1) |
| 55 | Conductive system | SA→internodal→AV→His→BB→Purkinje |
NOTE ON DUPLICATES: Several questions are repeated in the paper (Q4=Q36=Q40=Q48 re: CO calculation; Q6=Q42 re: isovolumic relaxation; Q8=Q44=Q52 re: EF; Q10=Q46 re: isovolumic contraction; Q14=Q37=Q50 re: S1; Q2=Q38 re: slowest conduction). All have been answered in their first occurrence above, with cross-references for the duplicates.