
Enumerate the indications for and describe the acute therapy of non hemorrhagic stroke including the use of thrombolytic agents This is My topic.make a ppt for a ug level final year mbbs Subject general medicine
ischemic stroke CT scan brain infarct
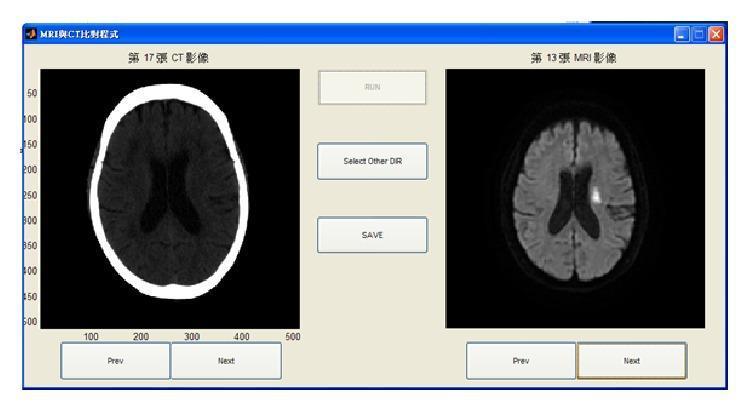
This Comparison Chart illustrates the side-by-side diagnostic evaluation of an ischemic stroke using a customized computer-aided assessment interface. The left panel shows an axial Non-Contrast Computed Tomography (NCCT) scan of the brain, demonstrating the characteristic hyperdense skull and low-contrast parenchyma where early subtle hypodensity might represent an acute infarct. The right panel displays a corresponding Magnetic Resonance Image (MRI), likely a Diffusion-Weighted Imaging (DWI) sequence, of the same patient. This MRI shows a distinct, localized hyperintense (bright) lesion in the left hemisphere adjacent to the lateral ventricle, which clearly delineates the area of acute cerebral infarction. The comparison highlights the higher sensitivity of MRI over CT in the hyperacute and acute phases of stroke. The interface includes navigational controls and analysis buttons ('RUN', 'Select Other DIR', 'SAVE'), indicating its use as a clinical decision support tool designed to assist radiologists in identifying and localizing stroke-affected regions.
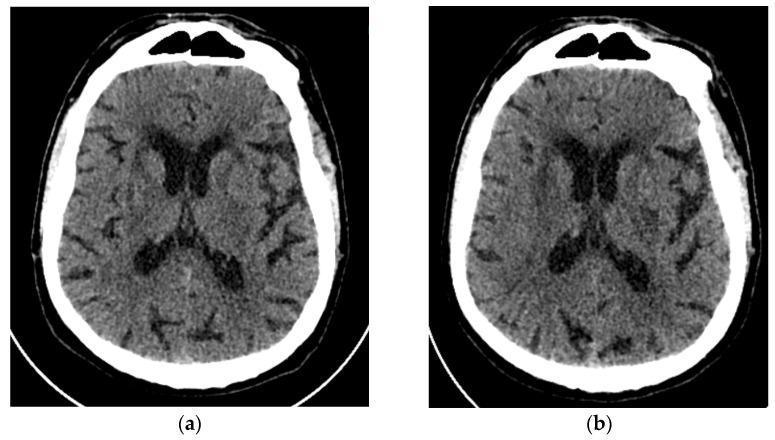
Two side-by-side axial non-contrast brain CT scans demonstrating the progression of an acute ischemic stroke. Scan (a), obtained at the time of emergency admission, shows baseline chronic changes including ischemic microangiopathy represented by mild periventricular hypodensity. No evidence of acute intracranial hemorrhage or definitive acute infarction is visible at this initial stage. Scan (b), a follow-up performed 48 hours later on the same patient, reveals the evolution of a focal hypodense lesion in the left basal ganglia region. The location of this infarct corresponds specifically to the neuroanatomical distribution of the left anterior choroidal artery (AChA), involving the posterior limb of the internal capsule. Both scans show similar ventricular morphology and cortical sulcal patterns, without significant mass effect or midline shift. This comparison serves as an educational example of how acute ischemic lesions may only become clearly visible on CT imaging after a period of temporal evolution, highlighting the importance of clinical correlation and follow-up imaging in suspected stroke cases.
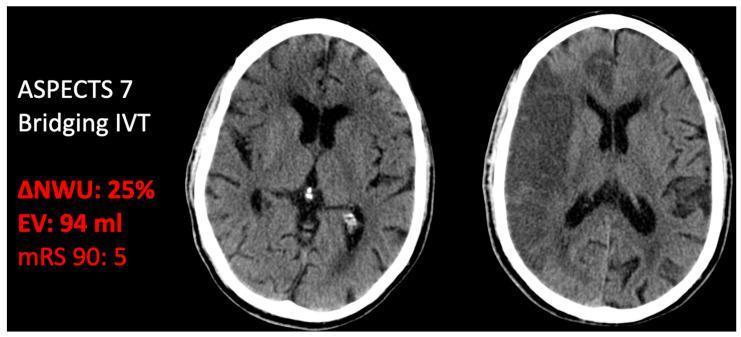
This diagnostic image displays two side-by-side axial non-contrast CT scans of the brain, demonstrating the progression of ischemic stroke and associated cerebral edema. The scan on the left (initial admission) shows subtle signs of early ischemia with an ASPECTS score of 7, indicating early parenchymal changes. The scan on the right (follow-up) reveals a large, well-defined area of hypodensity in the left hemisphere, primarily involving the temporal and parietal lobes. This hypodensity represents a significant infarct with edema progression, leading to a calculated edema volume (EV) of 94 ml and a ΔNWU (net water uptake) of 25%. Visible structures include the lateral ventricles, which remain patent but show slight mass effect from the surrounding hypodense tissue. The image is annotated with clinical outcomes including a modified Rankin Scale (mRS) score of 5 at 90 days, illustrating the correlation between extensive edema formation despite bridging intravenous thrombolysis (IVT) and poor functional prognosis in acute ischemic stroke management.
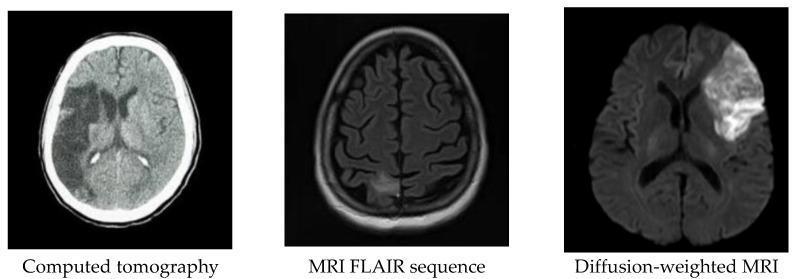
A comparison of diagnostic neuroimaging modalities showing acute ischemic stroke in axial brain slices. The first image is a non-contrast Computed Tomography (CT) scan displaying a large, wedge-shaped area of hypodensity in the right hemisphere, consistent with a Middle Cerebral Artery (MCA) territory infarct and associated cytotoxic edema. The second image is an MRI Fluid Attenuated Inversion Recovery (FLAIR) sequence, which demonstrates the infarct as a region of hyperintensity (bright signal) against the dark, signal-suppressed cerebrospinal fluid (CSF). The third image is a Diffusion-Weighted Imaging (DWI) MRI, showcasing the same pathology as a prominent hyperintense region. This bright signal on DWI indicates restricted water diffusion, which is a hallmark of acute cerebral ischemia. The panel illustrates how different imaging sequences enhance the contrast between normal and infarcted neural tissue, facilitating early stroke identification and localization.
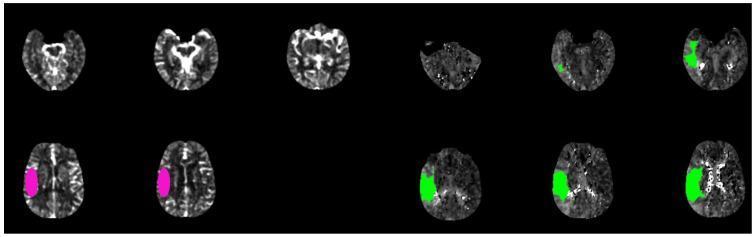
This diagnostic image series presents a Brain CT Perfusion (CTP) scan analyzed using automated software (RAPID) in the context of an acute ischemic stroke evaluation. The image displays multiple axial brain slices with color-coded overlays representing critical perfusion parameters. Areas highlighted in pink denote the 'infarct core,' where cerebral blood flow (CBF) is significantly reduced (<30%), indicating likely irreversible tissue damage. Areas highlighted in green represent the 'ischemic penumbra,' characterized by delayed contrast transit (Tmax > 6.0 s), indicating tissue at risk but potentially salvageable with reperfusion therapy. The spatial distribution of the green regions is notably larger than the pink regions, primarily involving the temporal, parietal, and frontal lobes of one hemisphere. This visual relationship demonstrates a 'favorable mismatch,' which is a key clinical indicator for determining a patient's eligibility for mechanical thrombectomy or thrombolytic treatment based on the mismatch ratio and volume.
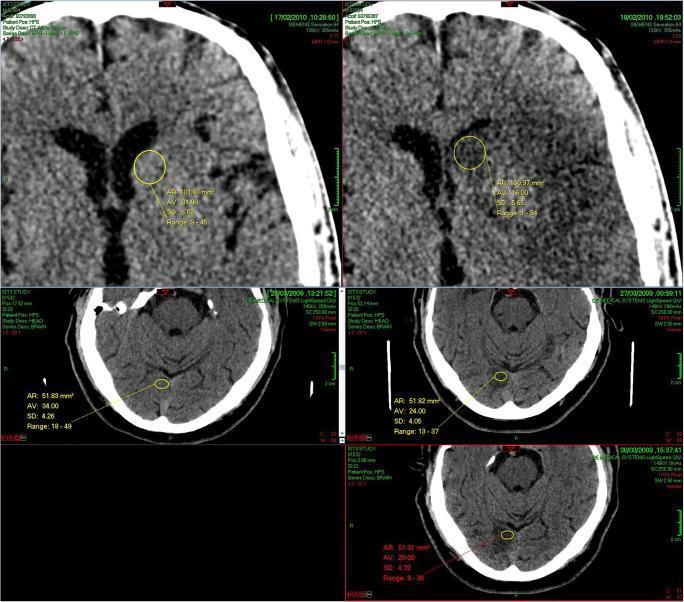
This Comparison Chart displays sequential non-contrast computed tomography (NCCT) scans of the brain from two patients to demonstrate the progression of ischemic stroke attenuation. The image is divided into upper and lower panels, each showing serial axial slices of developing infarcts. The upper panel tracks an evolving lesion near the lateral ventricle, comparing a scan at 175 minutes to one at 36 hours post-symptom onset. The lower panel displays three sequential scans (120 minutes, 22 hours, and 100 hours) showing the natural history of a posterior fossa infarct. Yellow circular Regions of Interest (ROIs) are manually placed within the hypoattenuating ischemic zones to measure Hounsfield Units (HU). These annotations quantify the progressive loss of tissue density (hypodensity) over time, characterized by darker visual texture and lower mean attenuation values as the cytotoxic edema matures. The visual material illustrates the clinical concept of using CT attenuation ratios to estimate the time of stroke onset, providing critical objective data for neuroradiological assessment and potential thrombolytic eligibility in acute stroke management.
thrombolysis alteplase tPA stroke treatment mechanism
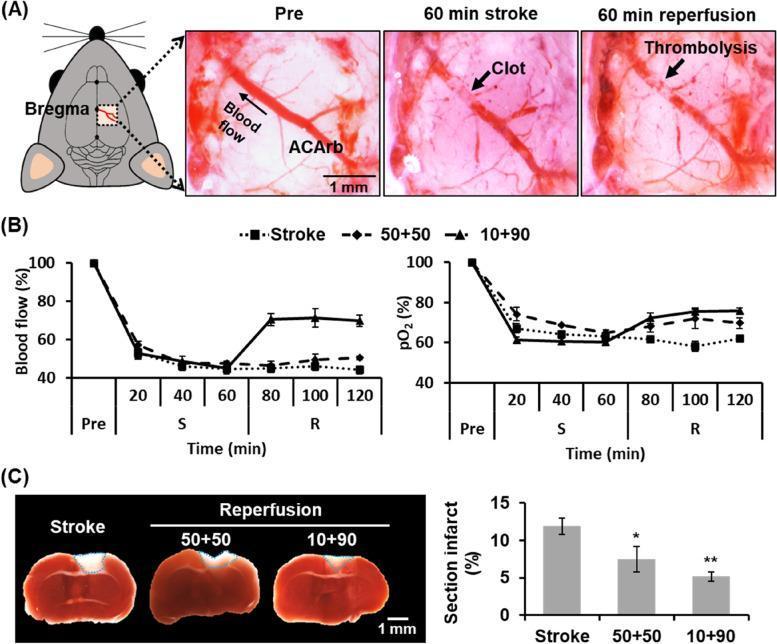
This composite educational graphic illustrates a murine model of stroke and reperfusion (S/R) used to evaluate thrombolysis efficacy. Panel A features dissecting microscope images of the anterior cerebral artery remote branch (ACArb). It visualizes the progression from healthy baseline blood flow ('Pre') to vessel occlusion by a visible thrombus ('60 min stroke') and subsequent clot dissolution following tPA administration ('60 min reperfusion'). Panel B presents line graphs quantifying hemodynamic and metabolic changes: the percentage of blood flow and partial pressure of oxygen (pO2) are plotted over time across pre-treatment, stroke (S), and reperfusion (R) phases, comparing three treatment groups (Stroke control, 50+50 bolus, and 10+90 bolus/infusion). Panel C displays pathological assessment via 2,3,5-triphenyltetrazolium chloride (TTC) staining of brain cross-sections. Healthy tissue appears red, while infarcted tissue is white (demarcated by blue dotted lines). A corresponding bar graph quantifies the infarct area, showing that the 10+90 tPA administration protocol significantly reduces the percentage of brain infarction compared to the stroke control and 50+50 bolus groups.
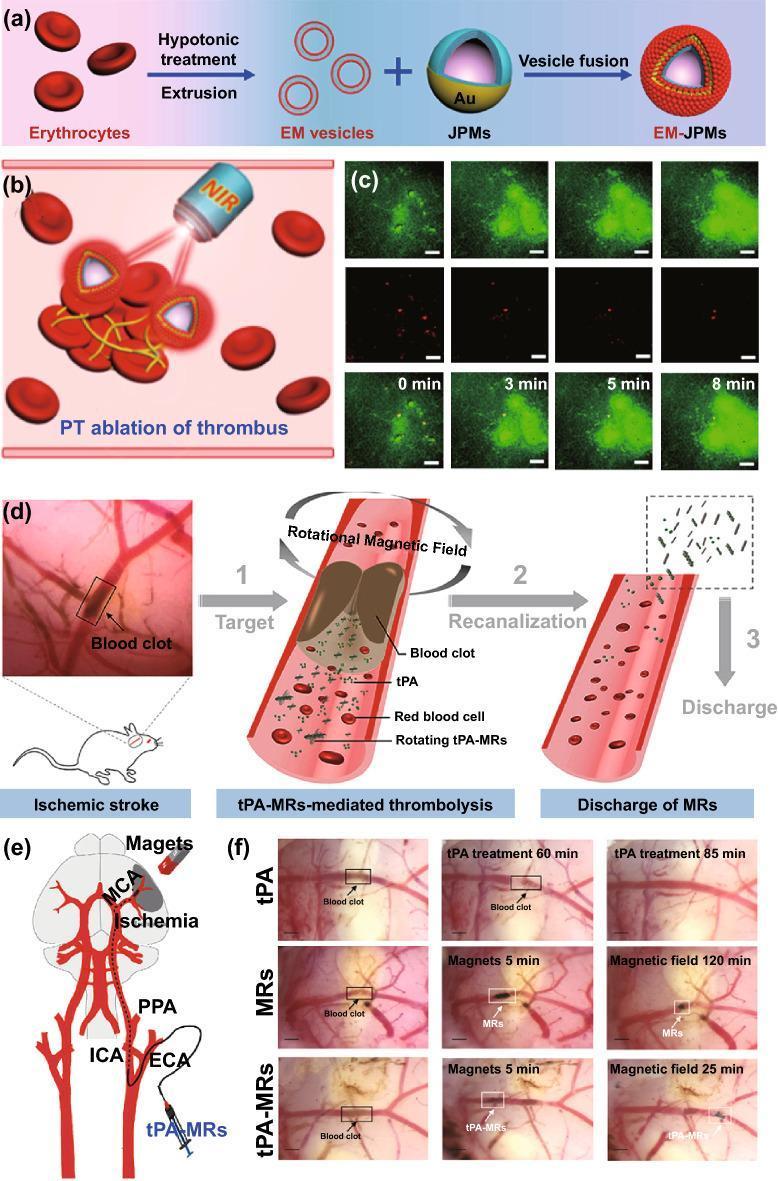
This multi-panel figure illustrates advanced nanomedicine strategies for thrombolysis (blood clot dissolution). (a) Schematic of Erythrocyte Membrane-coated Janus Polymeric Motors (EM-JPMs) preparation via hypotonic treatment, extrusion into EM vesicles, and fusion with gold-capped Janus motors. (b) Diagram of photothermal (PT) ablation using Near-Infrared (NIR) laser targeting a thrombus. (c) Time-lapsed Two-Photon Confocal Laser Scanning Microscopy (TP-CLSM) fluorescence images (0-8 min) demonstrating thrombus reduction following PT ablation. (d) Three-step schematic of magnetic field-responsive thrombolysis: 1. Targeting the clot; 2. Recanalization through rotational magnetic field-driven tPA-Microrods (tPA-MRs); 3. Discharge of fragmented materials. (e) Anatomical diagram of a cranial arterial tree (ICA, ECA, MCA, PPA) showing magnetic guidance of tPA-MRs to an ischemic MCA region. (f) Optical Coherence Tomography (OCT) clinical images comparing thrombolytic efficacy of tPA alone, MRs alone, and tPA-MRs under a rotational magnetic field, with the latter showing rapid, significant recanalization by 25 minutes. The figure highlights the integration of nanotechnology, magnetic guidance, and photothermal therapy in treating ischemic stroke and vascular thrombosis.
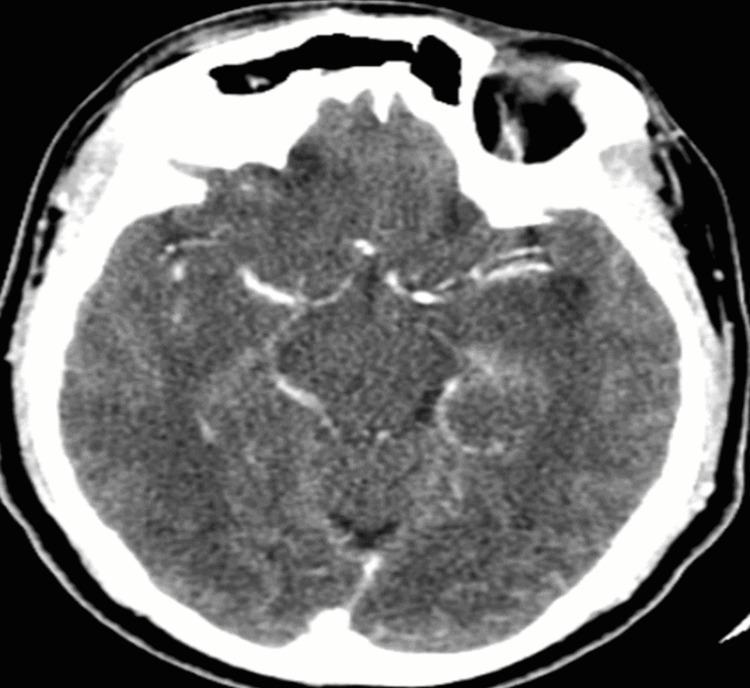
This diagnostic image is an axial slice from a Computed Tomography Angiogram (CTA) of the brain, demonstrating the intracranial vasculature at the level of the Circle of Willis. The primary clinical focus is the evaluation of the left middle cerebral artery (MCA) following thrombolytic therapy with alteplase. The image shows contrast opacification and partial recanalization of the M1 segment of the left MCA, which appears as a hyperdense, linear structure relative to the adjacent parenchyma. An area of subtle hypodensity is visible in the left temporal lobe, consistent with an ischemic territory post-stroke. The anterior circulation, including segments of the internal carotid arteries and right MCA, demonstrates continuity of contrast. This imaging is characteristic of post-thrombolysis monitoring in acute ischemic stroke, used to assess for vessel patency, recanalization status, and the development of collateral circulation. It is a critical resource for neurology and radiology students studying neurovascular emergencies and treatment outcomes.
NIH stroke scale NIHSS neurological assessment
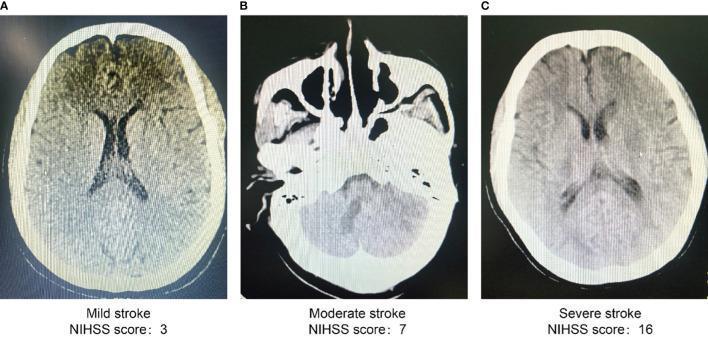
This diagnostic imaging set consists of three non-contrast axial computed tomography (CT) scans of the head, demonstrating various presentations of ischemic stroke categorized by National Institutes of Health Stroke Scale (NIHSS) severity. Panel A represents a mild stroke (NIHSS: 3), showing relatively preserved gray-white matter differentiation and symmetrical lateral ventricles with no visible acute hypodensity or mass effect. Panel B depicts a moderate stroke (NIHSS: 7) at a lower anatomical level (base of skull/posterior fossa), showing early signs of subtle parenchymal hypoattenuation. Panel C illustrates a severe stroke (NIHSS: 16), characterized by significant loss of structural clarity, generalized loss of sulcal definition, and widespread areas of reduced tissue density (hypodensity), indicative of extensive cytotoxic edema and tissue damage. The series serves as an educational comparison of radiological findings—such as loss of gray-white matter ribbon and ventricular compression—correlated with clinical neurological deficits in acute cerebrovascular accidents.
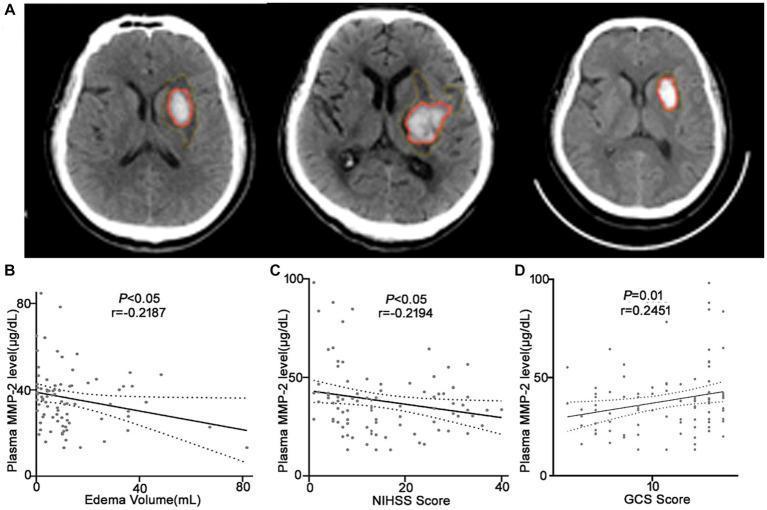
This composite image illustrates the correlation between plasma Matrix Metalloproteinase-2 (MMP-2) levels and clinical parameters in patients with intracerebral hemorrhage (ICH). Panel A presents three non-contrast axial CT brain scans demonstrating acute hypertensive ICH in the basal ganglia. Each scan features manual segmentations: red outlines highlight the hyperdense hematoma, while yellow outlines demarcate the surrounding hypodense perihematomal edema (PHE). Panels B, C, and D are scatter plots with linear regression lines and 95% confidence intervals showing bivariate correlation analysis (Spearman coefficient). Graph B shows a statistically significant negative correlation (r = -0.2187, p < 0.05) between plasma MMP-2 levels (µg/dL) and edema volume (mL). Graph C indicates a negative correlation (r = -0.2194, p < 0.05) with the NIH Stroke Scale (NIHSS) score, representing neurological deficit severity. Graph D displays a positive correlation (r = 0.2451, p = 0.01) between MMP-2 and Glasgow Coma Scale (GCS) scores, suggesting that higher MMP-2 levels are associated with better conscious states. The data collectively suggest that lower circulating MMP-2 levels correlate with increased brain edema and poorer clinical neurological status in ICH patients.
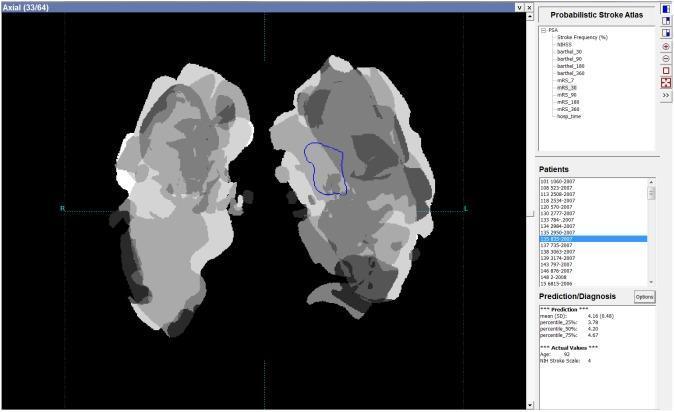
A clinical software interface displaying a Probabilistic Stroke Atlas (PSA) designed for patient-specific outcome prediction. The main viewer displays an axial grayscale image of a normalized brain representation, specifically a 90-day modified Rankin Scale (mRS90) map. The image shows non-uniform intensity distributions across both hemispheres, where varying grayscale shades represent the spatial probability of functional outcomes. A blue contour is superimposed over the left hemisphere, delineating the normalized infarcted region for the case under prediction. The right-hand sidebar contains three functional panels: an upper selector for probabilistic parameters (e.g., NIHSS, Barthel Index, mRS at various intervals), a middle panel for patient case selection, and a lower 'Prediction/Diagnosis' panel. The prediction panel displays statistical data for the selected case, including a mean predicted mRS90 score of 4.25, percentile distributions, and actual clinical values (Age: 90, NIH Stroke Scale: 4). This tool illustrates the integration of neuroradiological scan data with clinical scoring systems for predictive stroke modeling.
mkdir -p /tmp/workspace/stroke-ppt && ls /tmp/workspace/
~/stroke-ppt/build_stroke_ppt.py
import json, subprocess, base64, sys
from io import BytesIO
from pptx import Presentation
from pptx.util import Inches, Pt, Emu
from pptx.dml.color import RGBColor
from pptx.enum.text import PP_ALIGN, MSO_ANCHOR
from pptx.util import Inches, Pt

# ── Colour palette ──────────────────────────────────────────────
NAVY      = RGBColor(0x0A, 0x3D, 0x62)   # deep navy – headers
TEAL      = RGBColor(0x00, 0x7A, 0x8A)   # teal – accent / section bars
ORANGE    = RGBColor(0xE5, 0x5A, 0x00)   # orange – highlights / keywords
WHITE     = RGBColor(0xFF, 0xFF, 0xFF)
LIGHT_BG  = RGBColor(0xF0, 0xF6, 0xFA)   # slide background
DARK_TEXT = RGBColor(0x1A, 0x1A, 0x2E)
MID_GRAY  = RGBColor(0x6C, 0x75, 0x7D)

prs = Presentation()
prs.slide_width  = Inches(13.333)
prs.slide_height = Inches(7.5)
blank = prs.slide_layouts[6]

# ── Helper: filled rectangle ─────────────────────────────────────
def add_rect(slide, x, y, w, h, fill_rgb, alpha=None):
    shape = slide.shapes.add_shape(1, Inches(x), Inches(y), Inches(w), Inches(h))
    shape.line.fill.background()
    shape.fill.solid()
    shape.fill.fore_color.rgb = fill_rgb
    return shape

# ── Helper: text box ─────────────────────────────────────────────
def add_text(slide, text, x, y, w, h, size, bold=False, color=DARK_TEXT,
             align=PP_ALIGN.LEFT, italic=False, wrap=True):
    tb = slide.shapes.add_textbox(Inches(x), Inches(y), Inches(w), Inches(h))
    tf = tb.text_frame
    tf.word_wrap = wrap
    tf.margin_left = 0; tf.margin_right = 0
    tf.margin_top = 0;  tf.margin_bottom = 0
    p = tf.paragraphs[0]
    p.alignment = align
    run = p.add_run()
    run.text = text
    run.font.name  = "Calibri"
    run.font.size  = Pt(size)
    run.font.bold  = bold
    run.font.italic = italic
    run.font.color.rgb = color
    return tb

# ── Helper: multi-bullet text box ────────────────────────────────
def add_bullets(slide, bullets, x, y, w, h, size=16, color=DARK_TEXT,
                bold_first=False, indent=False):
    tb = slide.shapes.add_textbox(Inches(x), Inches(y), Inches(w), Inches(h))
    tf = tb.text_frame
    tf.word_wrap = True
    tf.margin_left = 0; tf.margin_right = 0
    tf.margin_top = Pt(4); tf.margin_bottom = 0
    for i, b in enumerate(bullets):
        p = tf.add_paragraph() if i > 0 else tf.paragraphs[0]
        p.space_before = Pt(3)
        p.space_after  = Pt(2)
        prefix = "    \u2023 " if indent else "\u2022 "
        run = p.add_run()
        run.text = prefix + b
        run.font.name = "Calibri"
        run.font.size = Pt(size)
        run.font.bold = (i == 0 and bold_first)
        run.font.color.rgb = color
    return tb

# ── Helper: section label bar ────────────────────────────────────
def add_section_bar(slide, label, color=TEAL):
    add_rect(slide, 0, 0, 13.333, 0.55, color)
    add_text(slide, label, 0.3, 0.05, 12.5, 0.5, 22, bold=True,
             color=WHITE, align=PP_ALIGN.LEFT)

# ── Helper: slide background ─────────────────────────────────────
def set_bg(slide, color=LIGHT_BG):
    add_rect(slide, 0, 0, 13.333, 7.5, color)

# ── Helper: fetch + embed image ──────────────────────────────────
def embed_image(slide, url, x, y, w, h=None):
    try:
        result = json.loads(subprocess.check_output(
            ["python", "/tmp/skills/shared/scripts/fetch_images.py", url],
            timeout=30
        ))
        if result and result[0].get("base64"):
            raw_b64 = result[0]["base64"]
            if "," in raw_b64:
                raw_b64 = raw_b64.split(",", 1)[1]
            img_bytes = BytesIO(base64.b64decode(raw_b64))
            if h:
                slide.shapes.add_picture(img_bytes, Inches(x), Inches(y),
                                         Inches(w), Inches(h))
            else:
                slide.shapes.add_picture(img_bytes, Inches(x), Inches(y), Inches(w))
    except Exception as e:
        print(f"Image embed failed for {url}: {e}", file=sys.stderr)

# ═══════════════════════════════════════════════════════════════════
#  SLIDE 1 – TITLE
# ═══════════════════════════════════════════════════════════════════
s = prs.slides.add_slide(blank)
# Full navy background
add_rect(s, 0, 0, 13.333, 7.5, NAVY)
# Teal accent bar top
add_rect(s, 0, 0, 13.333, 0.12, TEAL)
# Teal accent bar bottom
add_rect(s, 0, 7.38, 13.333, 0.12, TEAL)
# Orange vertical accent
add_rect(s, 0.5, 1.8, 0.08, 3.9, ORANGE)

add_text(s, "NON-HEMORRHAGIC STROKE", 0.8, 1.7, 12, 1.4, 44, bold=True,
         color=WHITE)
add_text(s, "Indications & Acute Management", 0.8, 3.1, 12, 0.8, 26,
         color=RGBColor(0xA8, 0xD8, 0xEA))
add_text(s, "Including Thrombolytic Therapy", 0.8, 3.85, 10, 0.6, 22,
         italic=True, color=RGBColor(0xFF, 0xA5, 0x00))
add_text(s, "General Medicine  |  Final Year MBBS", 0.8, 5.5, 12, 0.5, 17,
         color=MID_GRAY)
add_text(s, "AHA/ASA Guidelines 2019 | Davidson's | Harrison's | Rosen's EM",
         0.8, 6.2, 12, 0.4, 13, italic=True,
         color=RGBColor(0x78, 0x85, 0x92))

# ═══════════════════════════════════════════════════════════════════
#  SLIDE 2 – DEFINITION & TYPES
# ═══════════════════════════════════════════════════════════════════
s = prs.slides.add_slide(blank)
set_bg(s)
add_section_bar(s, "Definition & Classification of Stroke")

# Left column – definition box
add_rect(s, 0.3, 0.7, 6.1, 1.8, NAVY)
add_text(s, "STROKE (CVA) – WHO Definition",
         0.5, 0.75, 5.8, 0.5, 14, bold=True, color=WHITE)
add_text(s, "Rapidly developing clinical signs of focal (or global) "
            "disturbance of cerebral function, lasting more than 24 hours "
            "or leading to death, with no apparent cause other than vascular.",
         0.5, 1.15, 5.8, 1.2, 13, color=RGBColor(0xD0, 0xE8, 0xF5), wrap=True)

# Types
add_rect(s, 0.3, 2.65, 6.1, 0.45, TEAL)
add_text(s, "TYPES OF STROKE", 0.5, 2.68, 5, 0.38, 14, bold=True, color=WHITE)

type_data = [
    ("Ischemic (Non-Hemorrhagic)  ~87%", ORANGE, True),
    ("  Thrombotic  |  Embolic  |  Lacunar", DARK_TEXT, False),
    ("Hemorrhagic  ~13%", DARK_TEXT, True),
    ("  Intracerebral (ICH)  |  Subarachnoid (SAH)", DARK_TEXT, False),
]
yy = 3.2
for txt, col, bold in type_data:
    add_text(s, txt, 0.6, yy, 5.8, 0.4, 14, bold=bold, color=col)
    yy += 0.38

# Right column – TOAST classification
add_rect(s, 6.8, 0.7, 6.2, 0.45, TEAL)
add_text(s, "TOAST Classification of Ischemic Stroke", 6.95, 0.73, 6, 0.38, 13, bold=True, color=WHITE)

toast = [
    "Large-artery atherosclerosis (thrombotic / embolic from plaque)",
    "Cardioembolism (AF, valvular disease, MI, dilated CMP)",
    "Small-vessel occlusion (lacunar – lenticulostriate arteries)",
    "Stroke of other determined etiology (vasculitis, dissection, hypercoag.)",
    "Stroke of undetermined etiology (cryptogenic)"
]
yy2 = 1.25
for i, t in enumerate(toast):
    add_rect(s, 6.8, yy2, 0.4, 0.38, TEAL if i % 2 == 0 else NAVY)
    add_text(s, str(i+1), 6.82, yy2+0.01, 0.35, 0.38, 13, bold=True, color=WHITE, align=PP_ALIGN.CENTER)
    add_text(s, t, 7.3, yy2, 5.6, 0.42, 12.5, color=DARK_TEXT)
    yy2 += 0.5

add_text(s, "Ischemic stroke constitutes ~87% of all strokes — FOCUS of this session",
         0.3, 6.75, 12.7, 0.4, 12, italic=True, color=TEAL)

# ═══════════════════════════════════════════════════════════════════
#  SLIDE 3 – PATHOPHYSIOLOGY
# ═══════════════════════════════════════════════════════════════════
s = prs.slides.add_slide(blank)
set_bg(s)
add_section_bar(s, "Pathophysiology of Ischemic Stroke")

add_text(s, "The Ischemic Penumbra Concept", 0.3, 0.65, 9, 0.55, 20,
         bold=True, color=NAVY)

# Core vs Penumbra boxes
for i, (label, desc, col) in enumerate([
    ("ISCHEMIC CORE", "CBF < 10 mL/100g/min\nIrreversible neuronal death\nCytotoxic edema\nNo ATP production", RGBColor(0xC0, 0x39, 0x2B)),
    ("PENUMBRA", "CBF 10–20 mL/100g/min\nElectrically silent but viable\nSalvageable with reperfusion\n\"Time is Brain\"", ORANGE),
    ("OLIGEMIA", "CBF 20–55 mL/100g/min\nAutoreg. still intact\nAt-risk if CBF falls\nCollateral circulation", TEAL),
]):
    x = 0.3 + i * 4.3
    add_rect(s, x, 1.3, 4.0, 0.5, col)
    add_text(s, label, x+0.1, 1.32, 3.8, 0.45, 14, bold=True, color=WHITE)
    add_rect(s, x, 1.8, 4.0, 1.9, RGBColor(0xF8, 0xF9, 0xFA))
    for j, line in enumerate(desc.split("\n")):
        add_text(s, "• " + line, x+0.15, 1.85 + j*0.45, 3.8, 0.42, 13, color=DARK_TEXT)

# Cascade
add_rect(s, 0.3, 3.85, 12.7, 0.42, NAVY)
add_text(s, "Ischemic Cascade", 0.5, 3.88, 4, 0.35, 14, bold=True, color=WHITE)

cascade = [
    "↓ Cerebral blood flow",
    "→  ATP depletion",
    "→  Ion pump failure",
    "→  Glutamate excitotoxicity",
    "→  Ca²⁺ influx",
    "→  Free radicals",
    "→  Neuronal death"
]
x_pos = 0.3
for item in cascade:
    add_text(s, item, x_pos, 4.35, 1.75, 0.4, 11.5, color=DARK_TEXT)
    x_pos += 1.72

add_text(s, "Normal CBF = 55 mL/100g/min  |  Penumbra is the THERAPEUTIC TARGET of thrombolysis",
         0.3, 5.6, 12.7, 0.4, 13, italic=True, color=TEAL)

# Time chart
add_rect(s, 0.3, 6.1, 12.7, 0.9, RGBColor(0xE8, 0xF4, 0xFD))
add_text(s, "Time windows: 0–3 h (Class I tPA)  |  3–4.5 h (Class I with restrictions)  |  0–24 h (Thrombectomy in select cases)",
         0.5, 6.25, 12.3, 0.55, 14, bold=True, color=NAVY)

# ═══════════════════════════════════════════════════════════════════
#  SLIDE 4 – CLINICAL FEATURES / INDICATIONS FOR TREATMENT
# ═══════════════════════════════════════════════════════════════════
s = prs.slides.add_slide(blank)
set_bg(s)
add_section_bar(s, "Clinical Features & Indications for Acute Intervention")

# Two-column layout
add_rect(s, 0.3, 0.65, 6.0, 0.45, NAVY)
add_text(s, "CLINICAL FEATURES BY TERRITORY", 0.45, 0.67, 5.6, 0.38, 13, bold=True, color=WHITE)

territories = [
    ("MCA territory (most common)", [
        "Contralateral hemiplegia / hemiparesis",
        "Hemisensory loss (face + arm > leg)",
        "Homonymous hemianopia",
        "Aphasia (dominant); Neglect (non-dominant)",
        "Eyes deviate toward lesion ('wrong way gaze')",
    ]),
    ("ACA territory", [
        "Contralateral leg > arm weakness",
        "Urinary incontinence",
        "Personality changes / abulia",
    ]),
    ("PCA territory", [
        "Contralateral homonymous hemianopia",
        "Visual agnosia, alexia without agraphia",
        "Thalamic syndrome (pain, sensory loss)",
    ]),
    ("Brainstem / Posterior circulation", [
        "5 D's: Diplopia, Dysphagia, Dysarthria,",
        "Dizziness, Drop attacks",
        "Crossed cranial nerve + limb signs",
        "Horner's syndrome (lateral medullary)",
    ]),
]

y = 1.18
for title, feats in territories:
    add_rect(s, 0.3, y, 6.0, 0.35, TEAL)
    add_text(s, title, 0.45, y+0.02, 5.7, 0.3, 12.5, bold=True, color=WHITE)
    y += 0.37
    for f in feats:
        add_text(s, "• " + f, 0.5, y, 5.8, 0.32, 11.5, color=DARK_TEXT)
        y += 0.3
    y += 0.08

# Right column – indications for thrombolysis
add_rect(s, 6.6, 0.65, 6.4, 0.45, ORANGE)
add_text(s, "INDICATIONS FOR THROMBOLYTIC THERAPY (IV tPA)", 6.75, 0.67, 6.1, 0.38, 12.5, bold=True, color=WHITE)

indications = [
    ("Time Criteria", [
        "Onset to treatment within 3 h (standard)",
        "3–4.5 h window (selected patients)",
        "Wake-up stroke: DWI+/FLAIR- on MRI",
    ]),
    ("Clinical Criteria", [
        "Ischemic stroke with measurable neurological deficit",
        "NIHSS > 0 with disabling symptoms",
        "Age ≥ 18 years (no upper age limit within 3 h)",
    ]),
    ("Laboratory Criteria", [
        "BP < 185/110 mm Hg (or can be safely lowered)",
        "Blood glucose > 50 mg/dL",
        "No intracranial hemorrhage on CT",
        "Platelet count ≥ 100,000; INR ≤ 1.7; aPTT ≤ 40 s",
    ]),
]

y2 = 1.18
for title, pts in indications:
    add_rect(s, 6.6, y2, 6.4, 0.35, NAVY)
    add_text(s, title, 6.75, y2+0.02, 6.1, 0.3, 12.5, bold=True, color=WHITE)
    y2 += 0.37
    for p in pts:
        add_text(s, "✓ " + p, 6.75, y2, 6.2, 0.32, 11.5, color=DARK_TEXT)
        y2 += 0.3
    y2 += 0.1

# ═══════════════════════════════════════════════════════════════════
#  SLIDE 5 – NIHSS SCALE
# ═══════════════════════════════════════════════════════════════════
s = prs.slides.add_slide(blank)
set_bg(s)
add_section_bar(s, "NIH Stroke Scale (NIHSS) — Standardized Neurological Assessment")

add_text(s, "The NIHSS quantifies neurological deficit severity and guides thrombolysis decisions",
         0.3, 0.62, 12.7, 0.4, 14, italic=True, color=NAVY)

nihss_items = [
    ("1a", "Level of Consciousness", "0–3"),
    ("1b", "LOC Questions (month/age)", "0–2"),
    ("1c", "LOC Commands (eyes/fist)", "0–2"),
    ("2",  "Best Gaze", "0–2"),
    ("3",  "Visual Fields", "0–3"),
    ("4",  "Facial Palsy", "0–3"),
    ("5",  "Motor Arm (L+R)", "0–4 each"),
    ("6",  "Motor Leg (L+R)", "0–4 each"),
    ("7",  "Limb Ataxia", "0–2"),
    ("8",  "Sensory", "0–2"),
    ("9",  "Language/Aphasia", "0–3"),
    ("10", "Dysarthria", "0–2"),
    ("11", "Extinction/Neglect", "0–2"),
]

# Two columns
col1 = nihss_items[:7]
col2 = nihss_items[7:]

for col_items, x_start in [(col1, 0.3), (col2, 6.7)]:
    # Header
    add_rect(s, x_start, 1.1, 6.0, 0.38, NAVY)
    add_text(s, "Item", x_start+0.05, 1.12, 0.5, 0.32, 12, bold=True, color=WHITE)
    add_text(s, "Assessment", x_start+0.65, 1.12, 4.0, 0.32, 12, bold=True, color=WHITE)
    add_text(s, "Score", x_start+4.9, 1.12, 1.0, 0.32, 12, bold=True, color=WHITE)

    for i, (item, desc, score) in enumerate(col_items):
        bg = RGBColor(0xE8, 0xF4, 0xFD) if i % 2 == 0 else WHITE
        add_rect(s, x_start, 1.5 + i*0.42, 6.0, 0.4, bg)
        add_text(s, item, x_start+0.05, 1.52+i*0.42, 0.5, 0.36, 12, bold=True, color=TEAL)
        add_text(s, desc, x_start+0.65, 1.52+i*0.42, 4.1, 0.36, 12, color=DARK_TEXT)
        add_text(s, score, x_start+4.9, 1.52+i*0.42, 1.05, 0.36, 12, color=ORANGE, bold=True)

# Interpretation bar
add_rect(s, 0.3, 6.5, 12.7, 0.8, RGBColor(0x2C, 0x3E, 0x50))
interp = "0–4: Minor  |  5–15: Moderate  |  16–20: Moderate-Severe  |  21–42: Severe"
add_text(s, "NIHSS Interpretation:  " + interp, 0.5, 6.6, 12.3, 0.5, 13.5, bold=True, color=WHITE)

# ═══════════════════════════════════════════════════════════════════
#  SLIDE 6 – IMMEDIATE INITIAL MANAGEMENT (ABCs)
# ═══════════════════════════════════════════════════════════════════
s = prs.slides.add_slide(blank)
set_bg(s)
add_section_bar(s, "Initial Emergency Management — ABCs & Stabilization")

add_text(s, '"Time is Brain" — 1.9 million neurons die every minute of untreated stroke',
         0.3, 0.62, 12.7, 0.4, 14, italic=True, bold=True, color=ORANGE)

steps = [
    ("A", "AIRWAY", NAVY, [
        "Assess for airway obstruction, noisy breathing",
        "Head tilt / jaw thrust if needed; consider intubation if GCS ≤ 8",
        "Supplemental O₂ to maintain SpO₂ > 94% (avoid hyperoxia)",
        "NPO until formal swallowing assessment by speech pathologist",
    ]),
    ("B", "BREATHING", TEAL, [
        "Pulse oximetry; ABG if SpO₂ borderline",
        "Ventilatory assistance if hypoventilating",
        "Avoid hypercapnia (worsens ICP) and hypocapnia",
        "Prevent aspiration — HOB ≥ 30°",
    ]),
    ("C", "CIRCULATION", RGBColor(0x17, 0x6A, 0x38), [
        "Cardiac monitoring minimum 48 h (detect AF/arrhythmias)",
        "12-lead ECG + serum troponin on arrival",
        "Large-bore IV access × 2; IV normal saline",
        "Avoid hypotension; target SBP 160–200 mmHg initially",
    ]),
    ("D", "DISABILITY / NEURO", ORANGE, [
        "GCS, NIHSS assessment",
        "Blood glucose — treat hypoglycemia (< 60 mg/dL) urgently",
        "Temperature — treat fever aggressively (paracetamol; cooling)",
        "Avoid hyperglycemia — target 140–180 mg/dL",
    ]),
]

for i, (letter, title, col, pts) in enumerate(steps):
    x = 0.3 + i * 3.25
    add_rect(s, x, 1.1, 3.0, 0.55, col)
    add_text(s, letter, x+0.08, 1.1, 0.5, 0.52, 26, bold=True, color=WHITE)
    add_text(s, title, x+0.55, 1.2, 2.35, 0.4, 14, bold=True, color=WHITE)
    yy = 1.75
    for p in pts:
        add_text(s, "• " + p, x+0.05, yy, 3.1, 0.38, 11.5, color=DARK_TEXT)
        yy += 0.38

# Bottom: labs
add_rect(s, 0.3, 5.7, 12.7, 1.6, RGBColor(0xE8, 0xF4, 0xFD))
add_text(s, "Immediate Labs & Investigations", 0.5, 5.75, 12, 0.35, 14, bold=True, color=NAVY)
labs = [
    "CBC with diff & platelets",
    "PT / INR / aPTT",
    "Blood glucose (stat)",
    "Electrolytes, BUN, Creatinine",
    "Liver function tests",
    "Cardiac troponin",
    "12-lead ECG",
    "Non-contrast CT head (NCCT) — STAT",
    "CXR",
    "Toxicology screen (if indicated)",
]
x_l = 0.5
y_l = 6.18
for i, lab in enumerate(labs):
    col_x = x_l + (i % 5) * 2.55
    row_y = y_l + (i // 5) * 0.38
    add_text(s, "• " + lab, col_x, row_y, 2.5, 0.36, 11.5, color=DARK_TEXT)

# ═══════════════════════════════════════════════════════════════════
#  SLIDE 7 – BLOOD PRESSURE MANAGEMENT
# ═══════════════════════════════════════════════════════════════════
s = prs.slides.add_slide(blank)
set_bg(s)
add_section_bar(s, "Blood Pressure Management in Acute Ischemic Stroke")

add_text(s, "Cerebral autoregulation is IMPAIRED in ischemic stroke — perfusion is pressure-dependent",
         0.3, 0.62, 12.7, 0.4, 14, italic=True, color=NAVY)

scenarios = [
    ("NOT FOR tPA\n(No treatment)", TEAL,
     ["Allow permissive hypertension",
      "Do NOT treat unless SBP > 220 mmHg",
      "  OR DBP > 120 mmHg",
      "Lower BP by ~15% in first 24 h only if",
      "  very severe (>220/>120)",
      "Exception: Aortic dissection, AMI,",
      "  severe heart failure, renal failure"]),
    ("ELIGIBLE FOR tPA\n(Pre-thrombolysis)", ORANGE,
     ["Must achieve BP < 185/110 mmHg",
      "  BEFORE starting alteplase",
      "Agents: Labetalol 10–20 mg IV bolus",
      "  OR Nicardipine infusion 5 mg/h",
      "  OR Hydralazine 10 mg IV",
      "Do NOT give tPA if BP cannot be",
      "  safely controlled to < 185/110"]),
    ("POST-tPA\nBP monitoring", NAVY,
     ["Target BP ≤ 180/105 mmHg",
      "Monitor Q15 min × 2h then Q30 min × 6h",
      "  then Q1h × 16h",
      "Treat SBP > 180 or DBP > 105",
      "Watch for hemorrhagic transformation",
      "Never lower BP abruptly",
      "Avoid hypotension at all times"]),
    ("Antihypertensive\nAgents Used", RGBColor(0x17, 0x6A, 0x38),
     ["Labetalol 10–20 mg IV over 1–2 min",
      "  (repeat q10 min; max 300 mg)",
      "Nicardipine 5–15 mg/h infusion",
      "Clevidipine 1–21 mg/h infusion",
      "Hydralazine 10–20 mg IV",
      "AVOID nitroprusside (ICP rise)",
      "AVOID sublingual nifedipine"]),
]

for i, (title, col, pts) in enumerate(scenarios):
    x = 0.3 + i * 3.25
    add_rect(s, x, 1.1, 3.0, 0.75, col)
    add_text(s, title, x+0.1, 1.12, 2.85, 0.7, 12.5, bold=True, color=WHITE)
    yy = 1.93
    for p in pts:
        add_text(s, p if p.startswith("  ") else "• " + p, x+0.05, yy, 3.1, 0.35, 11, color=DARK_TEXT)
        yy += 0.35

add_rect(s, 0.3, 6.8, 12.7, 0.45, RGBColor(0xFF, 0xF3, 0xCD))
add_text(s, "KEY PEARL: Avoid treating BP in acute stroke UNLESS pre-tPA criteria apply. Permissive hypertension maintains penumbral perfusion.",
         0.5, 6.83, 12.3, 0.38, 12.5, bold=True, color=RGBColor(0x7D, 0x41, 0x00))

# ═══════════════════════════════════════════════════════════════════
#  SLIDE 8 – IV tPA: MECHANISM & DOSING
# ═══════════════════════════════════════════════════════════════════
s = prs.slides.add_slide(blank)
set_bg(s)
add_section_bar(s, "Intravenous Alteplase (IV tPA) — Mechanism & Dosing Protocol")

# Mechanism box
add_rect(s, 0.3, 0.65, 5.8, 4.5, RGBColor(0xE8, 0xF4, 0xFD))
add_rect(s, 0.3, 0.65, 5.8, 0.45, NAVY)
add_text(s, "MECHANISM OF ACTION", 0.45, 0.67, 5.5, 0.38, 14, bold=True, color=WHITE)

mech = [
    "Alteplase = recombinant tissue plasminogen activator (rtPA)",
    "Binds to fibrin in thrombus with high specificity",
    "Converts plasminogen → plasmin",
    "Plasmin cleaves fibrin → clot dissolution",
    "Restores blood flow to ischemic penumbra",
    "Half-life: ~4–5 minutes",
    "Cleared by liver",
    "Fibrin-specific (less systemic lysis than streptokinase)",
]
for i, m in enumerate(mech):
    add_text(s, ("→  " if i > 0 else "•  ") + m, 0.45, 1.18 + i*0.44, 5.7, 0.42, 12.5, color=DARK_TEXT)

# Dosing protocol
add_rect(s, 6.4, 0.65, 6.6, 4.5, RGBColor(0xFFF8F0))
add_rect(s, 6.4, 0.65, 6.6, 0.45, ORANGE)
add_text(s, "ALTEPLASE DOSING PROTOCOL", 6.55, 0.67, 6.3, 0.38, 14, bold=True, color=WHITE)

dose_info = [
    ("Standard Dose", "0.9 mg/kg IV\n(maximum 90 mg)"),
    ("Loading Bolus", "10% of total dose given over 1 minute"),
    ("Infusion", "Remaining 90% over 60 minutes"),
    ("Example (70 kg)", "Total = 63 mg\nBolus = 6.3 mg IV push\nInfusion = 56.7 mg over 60 min"),
    ("Route", "IV only — do NOT give IM or intra-arterially as primary route"),
    ("Monitoring", "Neurological checks Q15 min during infusion\nBP monitoring as per protocol above"),
]

yy = 1.18
for label, val in dose_info:
    add_rect(s, 6.4, yy, 2.2, 0.8, TEAL)
    add_text(s, label, 6.5, yy+0.1, 2.0, 0.6, 11.5, bold=True, color=WHITE)
    add_text(s, val, 8.7, yy+0.05, 4.2, 0.75, 12, color=DARK_TEXT)
    yy += 0.85

# Post tPA actions
add_rect(s, 0.3, 5.3, 12.7, 0.45, NAVY)
add_text(s, "AFTER ALTEPLASE: Admit to Stroke Unit / ICU  |  No antiplatelets/anticoagulants for 24 h  |  MRI/CT head at 24 h  |  Watch for angioedema",
         0.5, 5.33, 12.3, 0.38, 12.5, bold=True, color=WHITE)

add_rect(s, 0.3, 5.82, 12.7, 1.5, RGBColor(0xFDE8E8))
add_text(s, "COMPLICATIONS OF IV tPA", 0.5, 5.88, 6, 0.38, 13, bold=True, color=RGBColor(0x8B, 0x00, 0x00))
complications = [
    "Symptomatic intracranial hemorrhage (sICH): ~6%",
    "Orolingual angioedema: 1–5%",
    "Systemic bleeding",
    "Reperfusion injury",
    "Early neurological deterioration",
]
x_c = 0.5
for i, c in enumerate(complications):
    cx = x_c + (i % 3) * 4.2
    cy = 6.3 + (i // 3) * 0.38
    add_text(s, "⚠ " + c, cx, cy, 4.1, 0.35, 11.5, color=RGBColor(0x8B, 0x00, 0x00))

# ═══════════════════════════════════════════════════════════════════
#  SLIDE 9 – CONTRAINDICATIONS TO tPA
# ═══════════════════════════════════════════════════════════════════
s = prs.slides.add_slide(blank)
set_bg(s)
add_section_bar(s, "Contraindications to IV Alteplase (AHA/ASA 2019)")

# Absolute column
add_rect(s, 0.3, 0.65, 5.9, 0.45, RGBColor(0xC0, 0x39, 0x2B))
add_text(s, "ABSOLUTE CONTRAINDICATIONS", 0.45, 0.67, 5.6, 0.38, 14, bold=True, color=WHITE)

abs_ci = [
    "Evidence of intracranial hemorrhage on CT",
    "Significant head trauma or stroke in last 3 months",
    "Previous intracranial surgery in past 3 months",
    "History of intracranial hemorrhage",
    "Intracranial neoplasm, AVM, or aneurysm",
    "Active internal bleeding (excluding menstruation)",
    "Suspected aortic arch dissection",
    "Infective endocarditis",
    "SBP > 185 or DBP > 110 (uncontrolled)",
    "Platelet count < 100,000 / mm³",
    "INR > 1.7 (if on warfarin)",
    "aPTT > 40 s (if on heparin)",
    "Blood glucose < 50 mg/dL",
    "Direct thrombin inhibitors / Xa inhibitors in last 48 h",
    "Full treatment dose LMWH in last 24 h",
]
yy = 1.18
for ci in abs_ci:
    add_text(s, "✗  " + ci, 0.45, yy, 5.7, 0.33, 11.5, color=RGBColor(0x7B, 0x00, 0x00))
    yy += 0.33

# Relative column
add_rect(s, 6.5, 0.65, 6.5, 0.45, ORANGE)
add_text(s, "RELATIVE CONTRAINDICATIONS (3–4.5 h window)", 6.65, 0.67, 6.2, 0.38, 13, bold=True, color=WHITE)

rel_ci = [
    "Age > 80 years",
    "NIHSS score > 25 (severe stroke)",
    "History of both DM AND prior stroke",
    "Imaging showing > 1/3 MCA territory involvement",
    "Taking oral anticoagulants",
]
yy2 = 1.18
for rc in rel_ci:
    add_text(s, "⚠  " + rc, 6.65, yy2, 6.2, 0.36, 12.5, color=RGBColor(0x7D, 0x41, 0x00))
    yy2 += 0.38

# Note about 3h window
add_rect(s, 6.5, yy2+0.1, 6.5, 0.45, TEAL)
add_text(s, "NOTE: No upper age limit for 0–3 h window", 6.65, yy2+0.12, 6.2, 0.38, 13, bold=True, color=WHITE)
yy2 += 0.65

add_rect(s, 6.5, yy2, 6.5, 0.45, NAVY)
add_text(s, "Mild nondisabling stroke (NIHSS 0–5, non-disabling)", 6.65, yy2+0.02, 6.2, 0.38, 12.5, bold=True, color=RGBColor(0xFF, 0xA0, 0x00))
add_text(s, "IV alteplase NOT recommended (PRISMS trial)", 6.65, yy2+0.2, 6.2, 0.38, 12, color=WHITE)

add_rect(s, 0.3, 6.75, 12.7, 0.55, RGBColor(0xFFF3CD))
add_text(s, "RULE OF THUMB: When in doubt — obtain CT head STAT, check BP, glucose, coags. If any absolute CI present → do NOT give tPA.",
         0.5, 6.78, 12.3, 0.46, 12.5, bold=True, color=RGBColor(0x7D, 0x41, 0x00))

# ═══════════════════════════════════════════════════════════════════
#  SLIDE 10 – CT IMAGE + Penumbra imaging slide
# ═══════════════════════════════════════════════════════════════════
s = prs.slides.add_slide(blank)
set_bg(s)
add_section_bar(s, "Neuroimaging in Acute Ischemic Stroke")

add_text(s, "NCCT Head — First-line imaging: Rules out hemorrhage. MRI-DWI — Gold standard for early infarct detection.",
         0.3, 0.62, 12.7, 0.4, 13, italic=True, color=NAVY)

# Image 1 – CT comparison
embed_image(s, "https://cdn.orris.care/cdss_images/pmc_clinical_VQA_8c984050a4657747f99e63b46b61788a1bc2089bec72be63731970ba6e8e585c.jpg",
            0.3, 1.1, 5.8, 3.4)
add_text(s, "CT: Baseline vs. 48h — Left basal ganglia infarct (AChA territory)",
         0.3, 4.6, 5.8, 0.45, 11, italic=True, color=MID_GRAY)

# Image 2 – CT perfusion
embed_image(s, "https://cdn.orris.care/cdss_images/pmc_clinical_VQA_9ddb9786c87b8ef665592c1ff5a780f0fd16028d71ae2a8cabfdf23d702b683e.jpg",
            6.4, 1.1, 6.6, 3.4)
add_text(s, "CT Perfusion (CTP-RAPID): Pink = infarct core | Green = salvageable penumbra",
         6.4, 4.6, 6.6, 0.45, 11, italic=True, color=MID_GRAY)

# Key imaging points
add_rect(s, 0.3, 5.15, 12.7, 0.42, NAVY)
add_text(s, "Imaging Algorithm", 0.5, 5.17, 3, 0.36, 13, bold=True, color=WHITE)
add_text(s, "1. NCCT head (STAT) → Rule out hemorrhage / major infarct  2. CTA (if thrombectomy candidate)  3. CTP or MRI-DWI if extended window",
         3.5, 5.17, 9.5, 0.36, 12.5, color=WHITE)

img_notes = [
    ("NCCT", "Normal in first 6 h\nHyperdense MCA sign\nEarly ischemic changes: loss of insular ribbon, sulcal effacement"),
    ("DWI-MRI", "Positive within 30 min of onset\nRestricted diffusion = bright signal\nMost sensitive for acute infarct"),
    ("FLAIR-MRI", "Negative in first 6 h post-onset\nDWI+/FLAIR- = <4.5 h onset\n(WAKE-UP trial basis)"),
    ("CTA/MRA", "Detects vessel occlusion\nGuides thrombectomy decision\nAssesses collateral circulation"),
]
for i, (modality, desc) in enumerate(img_notes):
    x_i = 0.3 + i * 3.25
    add_rect(s, x_i, 5.65, 3.05, 0.45, TEAL if i % 2 == 0 else ORANGE)
    add_text(s, modality, x_i+0.1, 5.67, 2.85, 0.38, 13, bold=True, color=WHITE)
    for j, line in enumerate(desc.split("\n")):
        add_text(s, "• " + line, x_i+0.1, 6.15 + j*0.38, 2.95, 0.36, 11, color=DARK_TEXT)

# ═══════════════════════════════════════════════════════════════════
#  SLIDE 11 – MECHANICAL THROMBECTOMY
# ═══════════════════════════════════════════════════════════════════
s = prs.slides.add_slide(blank)
set_bg(s)
add_section_bar(s, "Mechanical Thrombectomy (Endovascular Therapy)")

add_text(s, "Large vessel occlusion (LVO) of ICA / M1-M2 MCA / basilar artery — thrombectomy is CLASS I recommendation",
         0.3, 0.62, 12.7, 0.4, 14, italic=True, bold=True, color=NAVY)

# Indications box
add_rect(s, 0.3, 1.1, 5.8, 0.42, TEAL)
add_text(s, "INDICATIONS FOR THROMBECTOMY", 0.45, 1.12, 5.6, 0.35, 13, bold=True, color=WHITE)

thromb_ind = [
    "Pre-treatment NIHSS ≥ 6",
    "Age ≥ 18 years",
    "LVO on CTA/MRA: ICA, M1/M2 MCA, basilar artery",
    "Alberta Stroke Program Early CT Score (ASPECTS) ≥ 6",
    "Within 6 h of symptom onset (standard)",
    "6–16 h with favorable imaging (DAWN/DEFUSE-3 trial criteria)",
    "Up to 24 h in selected patients (DAWN trial — wake-up stroke)",
    "Premorbid mRS 0–1 (independent prior to stroke)",
    "Can be done WITH or WITHOUT prior IV tPA",
]
yy = 1.6
for ind in thromb_ind:
    add_text(s, "✓  " + ind, 0.45, yy, 5.7, 0.36, 12, color=DARK_TEXT)
    yy += 0.36

# Procedure details
add_rect(s, 6.4, 1.1, 6.6, 0.42, ORANGE)
add_text(s, "PROCEDURE & KEY POINTS", 6.55, 1.12, 6.3, 0.35, 13, bold=True, color=WHITE)

proc = [
    ("Device", "Stent retriever (Solitaire, Trevo) — first-line\nDirect aspiration (ADAPT technique) — alternative"),
    ("Access", "Femoral artery → guide catheter → microcatheter\nDeployed past thrombus → stent retrieves clot"),
    ("Goal", "Recanalization (TICI 2b/3 = successful reperfusion)\nDoor-to-groin < 90 min ideal"),
    ("Anesthesia", "Conscious sedation preferred over GA\n(GA associated with worse outcomes in trials)"),
    ("Benefit", "NNT = 2.6 (number needed to treat for 1 good outcome)\nSignificant reduction in disability at 90 days"),
    ("Trials", "MR CLEAN, ESCAPE, SWIFT PRIME, EXTEND-IA,\nTHAWS, DAWN, DEFUSE-3 — all positive"),
]

yy = 1.6
for label, val in proc:
    add_rect(s, 6.4, yy, 1.5, 0.65, NAVY)
    add_text(s, label, 6.5, yy+0.08, 1.35, 0.5, 12, bold=True, color=WHITE, align=PP_ALIGN.CENTER)
    add_text(s, val, 7.98, yy+0.04, 4.95, 0.62, 11.5, color=DARK_TEXT)
    yy += 0.7

add_rect(s, 0.3, 6.78, 12.7, 0.5, RGBColor(0xE8, 0xF8, 0xEE))
add_text(s, "Bridge therapy: Give IV tPA first (if eligible) then proceed to thrombectomy — combined approach is standard of care",
         0.5, 6.82, 12.3, 0.4, 13, bold=True, color=RGBColor(0x0B, 0x5E, 0x2C))

# ═══════════════════════════════════════════════════════════════════
#  SLIDE 12 – ANTIPLATELET & ANTICOAGULATION THERAPY
# ═══════════════════════════════════════════════════════════════════
s = prs.slides.add_slide(blank)
set_bg(s)
add_section_bar(s, "Antiplatelet & Anticoagulation Therapy in Acute Ischemic Stroke")

add_rect(s, 0.3, 0.65, 5.8, 0.45, TEAL)
add_text(s, "ANTIPLATELET THERAPY", 0.45, 0.67, 5.6, 0.38, 14, bold=True, color=WHITE)

anti_plt = [
    "Aspirin 300 mg loading dose STAT (if no tPA given)",
    "Start aspirin within 24–48 h of stroke onset",
    "If tPA given: wait 24 h before starting aspirin",
    "Dual antiplatelet (Aspirin + Clopidogrel):",
    "  → For minor stroke (NIHSS ≤ 3) or high-risk TIA",
    "  → CHANCE trial: 21-day dual therapy ↓ recurrence",
    "  → POINT trial: confirms CHANCE findings (90 days)",
    "Long-term secondary prevention: aspirin 75–100 mg/day",
    "  OR clopidogrel 75 mg/day (if aspirin intolerant)",
    "  OR aspirin + dipyridamole MR 200 mg BD",
]
yy = 1.18
for a in anti_plt:
    add_text(s, a if a.startswith("  ") else "• " + a, 0.45, yy, 5.7, 0.36, 12, color=DARK_TEXT)
    yy += 0.36

add_rect(s, 6.4, 0.65, 6.6, 0.45, NAVY)
add_text(s, "ANTICOAGULATION THERAPY", 6.55, 0.67, 6.3, 0.38, 14, bold=True, color=WHITE)

anticaog = [
    "NOT routinely used for acute ischemic stroke",
    "Cardioembolic stroke (AF): START anticoagulation",
    "  but timing debate — '1-3-6-12 rule':",
    "  → TIA: start immediately",
    "  → Minor stroke (NIHSS ≤ 8): day 3",
    "  → Moderate stroke (NIHSS 8–16): day 6",
    "  → Severe stroke (NIHSS > 16): day 12",
    "Warfarin: INR target 2–3 for non-valvular AF",
    "DOACs: Rivaroxaban, Apixaban, Dabigatran preferred",
    "  for non-valvular AF (RELY, ROCKET-AF, ARISTOTLE)",
    "Heparin: NOT recommended routinely (CAST, IST trials)",
    "VTE prophylaxis: LMWH + compression stockings",
]
yy2 = 1.18
for a in anticaog:
    add_text(s, a if a.startswith("  ") else "• " + a, 6.55, yy2, 6.3, 0.36, 12, color=DARK_TEXT)
    yy2 += 0.36

add_rect(s, 0.3, 6.7, 12.7, 0.55, RGBColor(0xFFF3CD))
add_text(s, "KEY EXAM POINT: Aspirin within 24–48 h is standard. IV heparin is NOT indicated routinely in acute ischemic stroke.",
         0.5, 6.73, 12.3, 0.46, 13, bold=True, color=RGBColor(0x7D, 0x41, 0x00))

# ═══════════════════════════════════════════════════════════════════
#  SLIDE 13 – SUPPORTIVE CARE & COMPLICATIONS
# ═══════════════════════════════════════════════════════════════════
s = prs.slides.add_slide(blank)
set_bg(s)
add_section_bar(s, "Supportive Care, Prevention of Complications & Cerebral Edema")

items = [
    ("Fever", TEAL, [
        "Hyperthermia worsens ischemic injury",
        "Target temperature < 37.5°C",
        "Paracetamol 1g QID for fever",
        "Cooling blankets if refractory",
        "Treat infections aggressively",
    ]),
    ("Glucose", ORANGE, [
        "Hyperglycemia worsens infarct",
        "Target 140–180 mg/dL",
        "Insulin infusion if glucose > 180",
        "Avoid hypoglycemia (< 60 mg/dL)",
        "SHINE trial: intensive control = no benefit",
    ]),
    ("Cerebral Edema", NAVY, [
        "Peak at 72–120 h post-stroke",
        "Malignant MCA infarct = risk of herniation",
        "HOB 20–30°; avoid hypotonic fluids",
        "Osmotherapy: Mannitol 1 g/kg IV",
        "Hypertonic saline (3% NaCl) — evidence growing",
        "Decompressive craniectomy (DESTINY-2 trial)",
        "NO role for corticosteroids in ischemic stroke",
    ]),
    ("DVT / PE\nProphylaxis", RGBColor(0x17, 0x6A, 0x38), [
        "Immobile patients at high VTE risk",
        "Graduated compression stockings",
        "Pneumatic compression devices",
        "LMWH after 24 h (if no hemorrhagic transformation)",
        "Early mobilization when safe",
    ]),
    ("Nutrition\n& Swallowing", RGBColor(0x6C, 0x35, 0x83), [
        "Dysphagia in ~50% of stroke patients",
        "NPO until swallowing assessed",
        "Formal swallowing screen by speech pathologist",
        "NG tube / nasogastric feeding if unsafe swallow",
        "PEG for prolonged dysphagia (> 2–3 weeks)",
    ]),
    ("Neuroprotection\n& Statins", RGBColor(0x1A, 0x65, 0x5E), [
        "No proven neuroprotective agent to date",
        "Statins: High-intensity (Atorvastatin 80 mg)",
        "  ↓ recurrence by 16% (SPARCL trial)",
        "Start statins before discharge",
        "Continue pre-existing statins",
    ]),
]

for i, (title, col, pts) in enumerate(items):
    row, ci = divmod(i, 3)
    x = 0.3 + ci * 4.3
    y = 0.75 + row * 3.3
    add_rect(s, x, y, 4.0, 0.48, col)
    add_text(s, title, x+0.1, y+0.04, 3.8, 0.42, 13, bold=True, color=WHITE)
    yy = y + 0.55
    for p in pts:
        add_text(s, p if p.startswith("  ") else "• " + p, x+0.1, yy, 3.85, 0.35, 11.5, color=DARK_TEXT)
        yy += 0.35

# ═══════════════════════════════════════════════════════════════════
#  SLIDE 14 – STROKE UNIT & CHAIN OF SURVIVAL
# ═══════════════════════════════════════════════════════════════════
s = prs.slides.add_slide(blank)
set_bg(s)
add_section_bar(s, "Stroke Unit Care & The Acute Stroke Chain of Survival")

add_text(s, "Stroke unit care reduces mortality by 18%, disability, and nursing home placement — STRONGER than any single drug",
         0.3, 0.62, 12.7, 0.42, 14, italic=True, color=NAVY)

chain = [
    ("RECOGNITION", "Sudden face drooping\nArm weakness\nSpeech difficulty\nCall emergency services\n(FAST acronym)", TEAL),
    ("DISPATCH &\nTRANSPORT", "Pre-notification to\nstroke center\nPatient positioning\nVital signs en route\nAvoid delays", ORANGE),
    ("ED TRIAGE\n(Door-to-CT < 25 min)", "Stroke team activation\nRapid NIHSS\nImmediate NCCT head\nLabs drawn\nIV access", NAVY),
    ("DIAGNOSIS\n(Door-to-DX < 45 min)", "CT reviewed for ICH\nEligibility for tPA\nassessed\nNeurology consult\nConsent", RGBColor(0x17, 0x6A, 0x38)),
    ("tPA / THROMBECT.\n(Door-to-needle < 60 min)", "Alteplase 0.9 mg/kg\nor IR team activated\nfor thrombectomy\nICU/Stroke unit\nadmission", RGBColor(0x6C, 0x35, 0x83)),
]

for i, (title, desc, col) in enumerate(chain):
    x = 0.2 + i * 2.6
    add_rect(s, x, 1.1, 2.4, 0.55, col)
    add_text(s, title, x+0.05, 1.12, 2.3, 0.48, 11.5, bold=True, color=WHITE, align=PP_ALIGN.CENTER)
    add_rect(s, x, 1.65, 2.4, 2.55, RGBColor(0xF0, 0xF6, 0xFA))
    for j, line in enumerate(desc.split("\n")):
        add_text(s, "• " + line, x+0.08, 1.72 + j*0.42, 2.3, 0.4, 11.5, color=DARK_TEXT)
    if i < 4:
        add_text(s, "→", x+2.4, 1.82, 0.18, 0.4, 22, bold=True, color=ORANGE)

# Key time targets
add_rect(s, 0.3, 4.4, 12.7, 0.42, NAVY)
add_text(s, "TIME TARGETS:  Door-to-CT < 25 min  |  Door-to-thrombolysis < 60 min  |  Door-to-groin (thrombectomy) < 90 min",
         0.5, 4.43, 12.3, 0.35, 13, bold=True, color=WHITE)

# Stroke unit benefits
add_rect(s, 0.3, 4.95, 12.7, 0.42, TEAL)
add_text(s, "What stroke units provide:", 0.5, 4.97, 3.5, 0.35, 13, bold=True, color=WHITE)

su_benefits = [
    "Continuous cardiac monitoring",
    "Regular neuro assessment",
    "BP/glucose management",
    "Early physiotherapy",
    "Speech therapy",
    "OT assessment",
    "DVT prevention",
    "Family education",
]
x_su = 4.0
for i, b in enumerate(su_benefits):
    cx = x_su + (i % 4) * 2.3
    cy = 4.97 + (i // 4) * 0.38
    add_text(s, "✓ " + b, cx, cy, 2.25, 0.36, 12, color=WHITE)

# Secondary prevention
add_rect(s, 0.3, 5.75, 12.7, 1.55, RGBColor(0xE8, 0xF8, 0xEE))
add_text(s, "SECONDARY PREVENTION (Post-Discharge):", 0.5, 5.82, 6, 0.35, 13, bold=True, color=RGBColor(0x0B, 0x5E, 0x2C))
sec_prev = [
    "Antiplatelet therapy (aspirin / clopidogrel)",
    "Statin therapy (atorvastatin 80 mg)",
    "Aggressive BP control (target < 130/80)",
    "Glycaemic control in diabetics",
    "Anticoagulation if cardioembolic (AF)",
    "Carotid endarterectomy / stenting if significant carotid stenosis",
    "Lifestyle: smoking cessation, weight loss, exercise, diet",
    "Cardiac investigation: Echo, Holter monitor for AF",
]
x_sp = 0.5
for i, sp in enumerate(sec_prev):
    cx = x_sp + (i % 4) * 3.2
    cy = 6.25 + (i // 4) * 0.38
    add_text(s, "• " + sp, cx, cy, 3.15, 0.36, 11.5, color=DARK_TEXT)

# ═══════════════════════════════════════════════════════════════════
#  SLIDE 15 – SUMMARY & KEY EXAM POINTS
# ═══════════════════════════════════════════════════════════════════
s = prs.slides.add_slide(blank)
add_rect(s, 0, 0, 13.333, 7.5, NAVY)
add_rect(s, 0, 0, 13.333, 0.12, TEAL)
add_rect(s, 0, 7.38, 13.333, 0.12, ORANGE)

add_text(s, "SUMMARY & HIGH-YIELD EXAM POINTS", 0.4, 0.18, 12.5, 0.65, 26,
         bold=True, color=WHITE, align=PP_ALIGN.CENTER)
add_rect(s, 0.3, 0.88, 12.7, 0.05, ORANGE)

key_points = [
    ("tPA Dose", "0.9 mg/kg IV (max 90 mg); 10% bolus + 90% over 60 min", ORANGE),
    ("tPA Window", "Class I: 0–3 h | Class I with restrictions: 3–4.5 h | Extended: DWI+/FLAIR- on MRI", TEAL),
    ("tPA BP threshold", "Must be < 185/110 mmHg before starting; maintain < 180/105 after", RGBColor(0xA8, 0xD8, 0xEA)),
    ("BP in stroke (no tPA)", "Permissive hypertension — treat only if > 220/120 mmHg", ORANGE),
    ("Aspirin", "300 mg loading if no tPA; 75–100 mg/day maintenance; dual APT for minor stroke/TIA", TEAL),
    ("Anticoagulation", "NOT routine; use for cardioembolic (AF) with 1-3-6-12 timing rule", RGBColor(0xA8, 0xD8, 0xEA)),
    ("Heparin", "NOT recommended routinely (CAST & IST trials — no benefit, increased hemorrhage)", ORANGE),
    ("Thrombectomy", "LVO + NIHSS ≥ 6 + ASPECTS ≥ 6 → up to 24 h (DAWN trial); door-to-groin < 90 min", TEAL),
    ("Steroids", "NO role in ischemic stroke (worsen hyperglycemia, increase infection risk)", RGBColor(0xA8, 0xD8, 0xEA)),
    ("Statins", "High-dose atorvastatin 80 mg — start before discharge (SPARCL trial)", ORANGE),
    ("Cerebral edema Rx", "Mannitol / hypertonic saline / decompressive craniectomy; NO steroids", TEAL),
    ("NIHSS > 15", "Indicates large infarction; consider thrombectomy workup", RGBColor(0xA8, 0xD8, 0xEA)),
]

x_kp = 0.3
y_kp = 1.05
for i, (label, fact, col) in enumerate(key_points):
    row, ci_idx = divmod(i, 2)
    x_box = x_kp + ci_idx * 6.4
    y_box = y_kp + row * 0.5
    add_rect(s, x_box, y_box, 1.6, 0.44, col)
    add_text(s, label, x_box+0.05, y_box+0.02, 1.55, 0.4, 11, bold=True, color=NAVY, align=PP_ALIGN.CENTER)
    add_text(s, fact, x_box+1.65, y_box+0.02, 4.6, 0.4, 11.5, color=WHITE)

add_rect(s, 0.3, 7.12, 12.7, 0.26, TEAL)
add_text(s, "References: AHA/ASA Stroke Guidelines 2019 | Rosen's Emergency Medicine 9e | Bradley & Daroff's Neurology | Textbook of Family Medicine 9e | Davidson's Principles & Practice of Medicine",
         0.5, 7.14, 12.3, 0.22, 9, italic=True, color=WHITE)

# ─── Save ─────────────────────────────────────────────────────────
out = "/tmp/workspace/stroke-ppt/Non_Hemorrhagic_Stroke_MBBS.pptx"
buf = BytesIO()
prs.save(buf)
with open(out, "wb") as f:
    f.write(buf.getvalue())
print(f"Saved: {out}")
print(f"Slides: {len(prs.slides)}")
cd /tmp/workspace/stroke-ppt && python build_stroke_ppt.py 2>&1
grep -n "RGBColor(0x" /tmp/workspace/stroke-ppt/build_stroke_ppt.py | grep -v "0x[0-9A-Fa-f][0-9A-Fa-f], 0x" | head -20
sed -i \ 's/RGBColor(0xFFF8F0)/RGBColor(0xFF, 0xF8, 0xF0)/g' \ /tmp/workspace/stroke-ppt/build_stroke_ppt.py && \ sed -i \ 's/RGBColor(0xFDE8E8)/RGBColor(0xFD, 0xE8, 0xE8)/g' \ /tmp/workspace/stroke-ppt/build_stroke_ppt.py && \ sed -i \ 's/RGBColor(0xFFF3CD)/RGBColor(0xFF, 0xF3, 0xCD)/g' \ /tmp/workspace/stroke-ppt/build_stroke_ppt.py && \ python /tmp/workspace/stroke-ppt/build_stroke_ppt.py 2>&1
# Download the two images directly cd /tmp/workspace/stroke-ppt && \ python3 -c " import urllib.request, os urls = [ ('https://cdn.orris.care/cdss_images/pmc_clinical_VQA_8c984050a4657747f99e63b46b61788a1bc2089bec72be63731970ba6e8e585c.jpg', 'img1.jpg'), ('https://cdn.orris.care/cdss_images/pmc_clinical_VQA_9ddb9786c87b8ef665592c1ff5a780f0fd16028d71ae2a8cabfdf23d702b683e.jpg', 'img2.jpg'), ] for url, fname in urls: try: urllib.request.urlretrieve(url, fname) print(f'Downloaded {fname}: {os.path.getsize(fname)} bytes') except Exception as e: print(f'FAILED {fname}: {e}') "
~/stroke-ppt/build_stroke_ppt.py
Successfully replaced 1 instance(s) of the string in '/tmp/workspace/stroke-ppt/build_stroke_ppt.py'
# Add 'import os' near the top if missing head -5 /tmp/workspace/stroke-ppt/build_stroke_ppt.py
~/stroke-ppt/build_stroke_ppt.py
Successfully replaced 1 instance(s) of the string in '/tmp/workspace/stroke-ppt/build_stroke_ppt.py'
cd /tmp/workspace/stroke-ppt && python build_stroke_ppt.py 2>&1
Non Hemorrhagic Stroke MBBS
Presentation · PPTX
What's Inside — 15 Slides
| # | Slide Title | Key Content |
|---|---|---|
| 1 | Title Slide | Professional navy/teal design with citation line |
| 2 | Definition & Classification | WHO definition, hemorrhagic vs ischemic split (87%), full TOAST classification |
| 3 | Pathophysiology | Ischemic core vs penumbra vs oligemia; ischemic cascade; CBF thresholds; time windows |
| 4 | Clinical Features & Indications | MCA / ACA / PCA / posterior circulation syndromes; indications for tPA (time, clinical, lab criteria) |
| 5 | NIHSS Scale | All 13 items with scores; interpretation bands (minor to severe) |
| 6 | Initial Emergency Management (ABCs) | Airway-Breathing-Circulation-Disability; immediate labs and investigations table |
| 7 | Blood Pressure Management | 4-column breakdown: no tPA / pre-tPA / post-tPA / agents used; labetalol / nicardipine dosing |
| 8 | IV tPA: Mechanism & Dosing | rtPA mechanism; 0.9 mg/kg protocol with bolus/infusion; complications (sICH 6%, angioedema) |
| 9 | Contraindications to tPA | Absolute vs relative (3–4.5 h window); AHA/ASA 2019 table |
| 10 | Neuroimaging | Real CT scans embedded (baseline vs 48h infarct; CT perfusion RAPID); NCCT/DWI/FLAIR/CTA comparison |
| 11 | Mechanical Thrombectomy | LVO indications; ASPECTS; DAWN/DEFUSE-3 extended window; NNT = 2.6; key trial names |
| 12 | Antiplatelet & Anticoagulation | Aspirin timing; CHANCE/POINT trial dual APT; cardioembolic 1-3-6-12 rule; DOACs vs heparin |
| 13 | Supportive Care & Complications | Fever, glucose, cerebral edema (mannitol, no steroids), DVT prophylaxis, nutrition, statins |
| 14 | Stroke Unit & Chain of Survival | 5-step chain (recognition → tPA); time targets; secondary prevention checklist |
| 15 | Summary / High-Yield Exam Points | 12 rapid-recall boxes: doses, windows, BP targets, key trials, drug rules |