
Pathogenicity of hbv and various serum markers
"hepatitis B virus" AND pathogenesis
hepatitis B serology markers acute chronic infection diagram
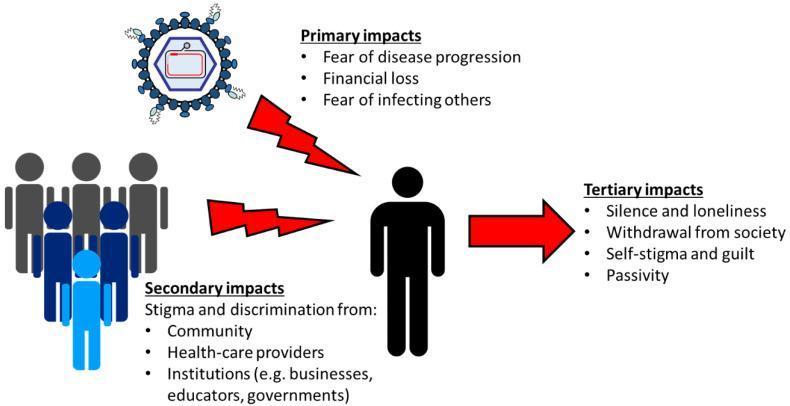
A pathophysiology and psychosocial diagram illustrating the impact of chronic Hepatitis B virus (HBV) infection on an individual. The central element is a black silhouette of a person, representing an individual living with chronic hepatitis B (CHB). To the top-left, a diagram of the HBV virus particles indicates the clinical origin of the condition. Red jagged arrows point from the virus and a group of blue-toned human figures toward the central individual, symbolizing external stressors. The diagram categorizes the consequences into three tiers: 'Primary impacts' (fear of progression, financial loss, fear of transmission); 'Secondary impacts' originating from the community and healthcare providers (stigma and discrimination); and 'Tertiary impacts' shown on the right (silence, loneliness, withdrawal from society, self-stigma, and passivity). The visual logic demonstrates how biological disease leads to societal reaction, which ultimately results in negative psychological internalizations for the patient. This educational infographic is designed for clinicians and public health educators to understand the multifaceted lived experience of CHB beyond clinical markers.
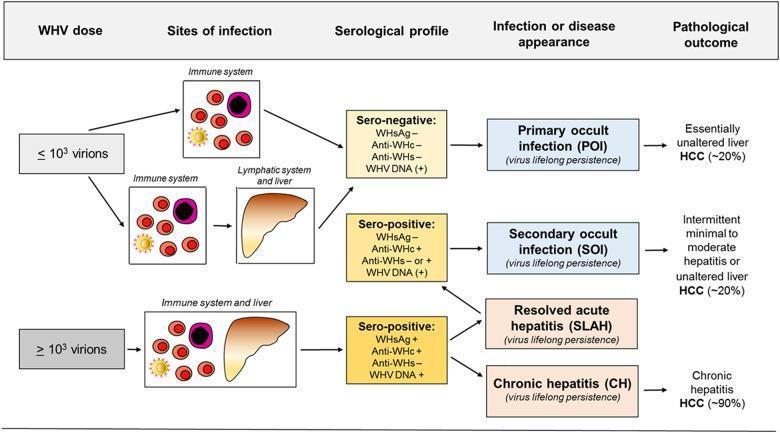
This pathophysiology flow diagram illustrates the development of Woodchuck Hepatitis Virus (WHV) infections, serving as a preclinical model for human Hepatitis B virus (HBV). The diagram categorizes outcomes based on viral load (WHV dose), sites of infection, serological profiles, and pathological outcomes. A low dose (≤ 10^3 virions) primarily targets the immune system, leading to Primary Occult Infection (POI) characterized by a sero-negative profile (WHsAg-, Anti-WHc-, Anti-WHs-) despite WHV DNA persistence. This may progress to hepatocellular carcinoma (HCC) in ~20% of cases. A secondary pathway for low doses involves the lymphatic system and liver, leading to Secondary Occult Infection (SOI) with a sero-positive profile (WHsAg-, Anti-WHc+, Anti-WHs +/-). Higher doses (≥ 10^3 virions) concurrently infect the immune system and liver, presenting as sero-positive (WHsAg+, Anti-WHc+, Anti-WHs-). These infections lead to either Resolved Acute Hepatitis (SLAH), which transitions to SOI, or Chronic Hepatitis (CH). CH carries a high risk of HCC (~90%). The chart emphasizes the persistence of viral DNA across all outcomes despite differing serological markers.
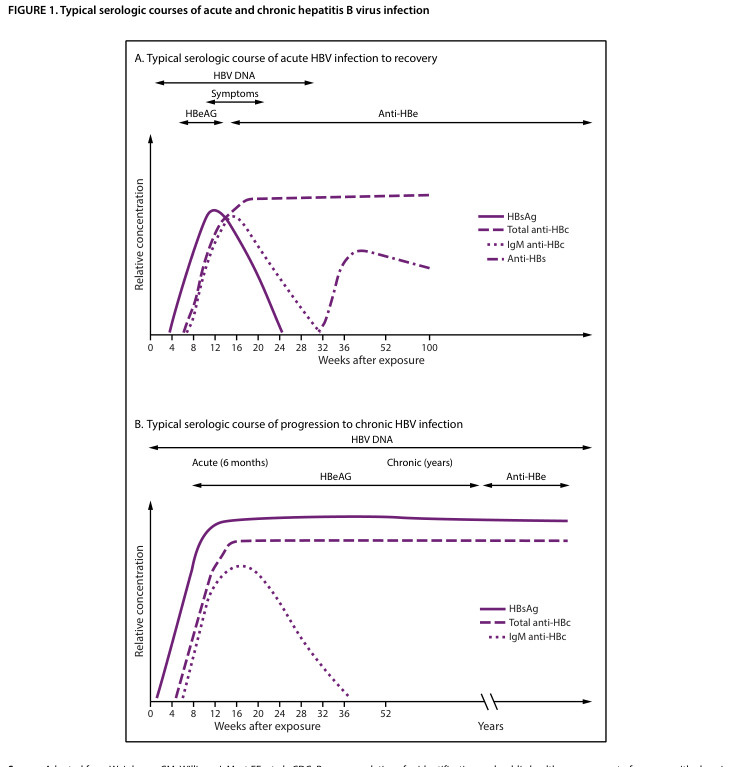
Summary : This figure presents two line plots showing the typical serologic courses of acute and chronic hepatitis B virus (HBV) infection, comparing the progression and recovery of serologic markers over time. line plot: # Panel A: Typical serologic course of acute HBV infection to recovery ## Title & Axes : • Title: "A. Typical serologic course of acute HBV infection to recovery" • X-axis: "Weeks after exposure" (tick labels: 0, 4, 8, 12, 16, 20, 24, 28, 32, 36, 52, 100) • Y-axis: "Relative concentration" (no explicit tick labels) • Additional timeline annotations: "HBV DNA", "Symptoms", "HBeAG", "Anti-HBe" (horizontal arrows above plot) ## Data Points : • HBsAg (solid line): Rises sharply after exposure, peaks around 8–12 weeks, then declines and disappears by ~24–28 weeks. • Total anti-HBc (dashed line): Rises after exposure, peaks around 16–20 weeks, remains elevated beyond 100 weeks. • IgM anti-HBc (dotted line): Rises after exposure, peaks around 12–16 weeks, declines and disappears by ~28–32 weeks. • Anti-HBs (long dashed line): Appears after ~24–28 weeks, rises and remains elevated beyond 100 weeks. ## Design Encodings : • HBsAg: solid purple line • Total anti-HBc: dashed purple line • IgM anti-HBc: dotted purple line • Anti-HBs: long dashed purple line • All lines plotted against the same axes; no log scale or error bars. ## Distribution & Trends : • HBsAg and IgM anti-HBc both show transient peaks and then decline. • Total anti-HBc and anti-HBs persist long-term after recovery. # Panel B: Typical serologic course of progression to chronic HBV infection ## Title & Axes : • Title: "B. Typical serologic course of progression to chronic HBV infection" • X-axis: "Weeks after exposure" (tick labels: 0, 4, 8, 12, 16, 20, 24, 28, 32, 36, 52), then "Years" (break in axis) • Y-axis: "Relative concentration" (no explicit tick labels) • Additional timeline annotations: "HBV DNA", "Acute (6 months)", "Chronic (years)", "HBeAG", "Anti-HBe" (horizontal arrows above plot) ## Data Points : • HBsAg (solid line): Rises after exposure, remains persistently elevated for years. • Total anti-HBc (dashed line): Rises after exposure, remains persistently elevated for years. • IgM anti-HBc (dotted line): Rises after exposure, peaks around 12–16 weeks, declines and disappears by ~28–32 weeks. ## Design Encodings : • HBsAg: solid purple line • Total anti-HBc: dashed purple line • IgM anti-HBc: dotted purple line • All lines plotted against the same axes; no log scale or error bars. ## Distribution & Trends : • HBsAg and total anti-HBc remain persistently elevated in chronic infection. • IgM anti-HBc is transient and disappears after the acute phase. # Analysis : • In acute HBV infection (Panel A), HBsAg and IgM anti-HBc are transient, while total anti-HBc and anti-HBs persist after recovery, indicating resolution and immunity. • In chronic HBV infection (Panel B), HBsAg and total anti-HBc remain persistently elevated for years, while IgM anti-HBc is only present during the acute phase, indicating ongoing infection without resolution. • The presence and duration of serologic markers distinguish acute recovery from progression to chronic infection.
Hepatitis B Virus (HBV): Pathogenicity and Serum Markers
1. The Virus - Structure Basics
| Form | Size | Nature |
|---|---|---|
| Complete virion (Dane particle) | 42 nm | Infectious; double-shelled |
| Spherical 22-nm particles | 22 nm | Excess surface protein (HBsAg), non-infectious |
| Tubular/filamentous forms | 22 nm wide | Excess surface protein |
2. Replication Strategy (the Key to Pathogenicity)
- Entry via binding to the sodium taurocholate cotransporting polypeptide (NTCP) receptor on hepatocytes
- Viral DNA is converted in the nucleus to covalently closed circular DNA (cccDNA) - this is the critical persistence reservoir
- cccDNA acts as template for messenger RNA and pregenomic RNA
- The viral DNA polymerase reverse-transcribes the pregenomic RNA into minus-strand DNA
- Plus-strand DNA is synthesized from the minus strand
- Proteins are translated and packaged into virions for secretion
3. Pathogenesis - How HBV Causes Disease
A. HBV is NOT directly cytopathic
"The factors determining the clinical manifestations of acute hepatitis B are not fully known; however, the pathogenesis appears to be immune-mediated."
- Sherris & Ryan's Medical Microbiology, 8th Ed.
B. Mechanisms of Liver Injury
| Mechanism | Detail |
|---|---|
| CTL (CD8+ T cell)-mediated hepatocyte killing | HBV-specific cytotoxic T lymphocytes recognize viral antigens on infected hepatocytes and destroy them - this is the major pathogenic mechanism |
| Immune complex disease | Circulating HBsAg-anti-HBs complexes activate complement, causing the serum sickness-like prodrome (arthritis, urticaria) that precedes jaundice. These complexes also deposit in kidneys causing renal damage (HBV-associated glomerulonephritis) |
| Antibody-mediated responses | Anti-HBs is protective and associated with disease resolution; anti-HBc does not appear protective |
| Impaired cellular immunity | Patients with insufficient T-lymphocyte function have a high rate of progression to chronic HBV carrier state |
- Sherris & Ryan's Medical Microbiology, 8th Ed., p. 499
C. Pathological Progression
- Integrated HBV DNA is found in nearly all HBV-associated HCCs
- The virus has no proven transforming gene but may activate cellular oncogenes
- The cyclic pattern of hepatocyte damage and intense regenerative hyperplasia greatly increases opportunities for spontaneous oncogenic mutations
- Sherris & Ryan's, p. 500
4. Serum Markers - The HBV Antigen-Antibody System
Overview Table
| Marker | What it is | Clinical Significance |
|---|---|---|
| HBsAg | Surface antigen; outer envelope protein (S gene product) | First detectable marker (1-12 weeks post-exposure); persistence >6 months = chronic infection |
| HBcAg | Core/nucleocapsid antigen | NOT detectable in serum (too low); detected in hepatocyte nuclei by immunostaining only |
| HBeAg | Soluble glycoprotein; secreted form of core antigen | Marker of active viral replication and high infectivity; seen only when HBsAg is also present |
| HBV DNA | Viral genome | Most sensitive/accurate marker of viral replication; detected by PCR |
| Anti-HBs | Antibody to HBsAg | Marker of recovery and immunity (from infection or vaccination); protective |
| Anti-HBc IgM | IgM antibody to core antigen | Marker of acute HBV infection; present during "window period"; disappears within 6 months |
| Anti-HBc IgG | IgG antibody to core antigen | Persists for life; marker of past or chronic infection (not present after vaccination alone) |
| Anti-HBe | Antibody to HBeAg | Indicates seroconversion from active replication phase; associated with lower infectivity |
- Sherris & Ryan's Medical Microbiology, 8th Ed., Table 13-2; Yamada's Gastroenterology 7th Ed.; Harrison's 22E
5. Serological Courses - Visual
Acute HBV with Recovery vs. Progression to Chronic
Sequence of Markers in Acute Self-Limiting HBV
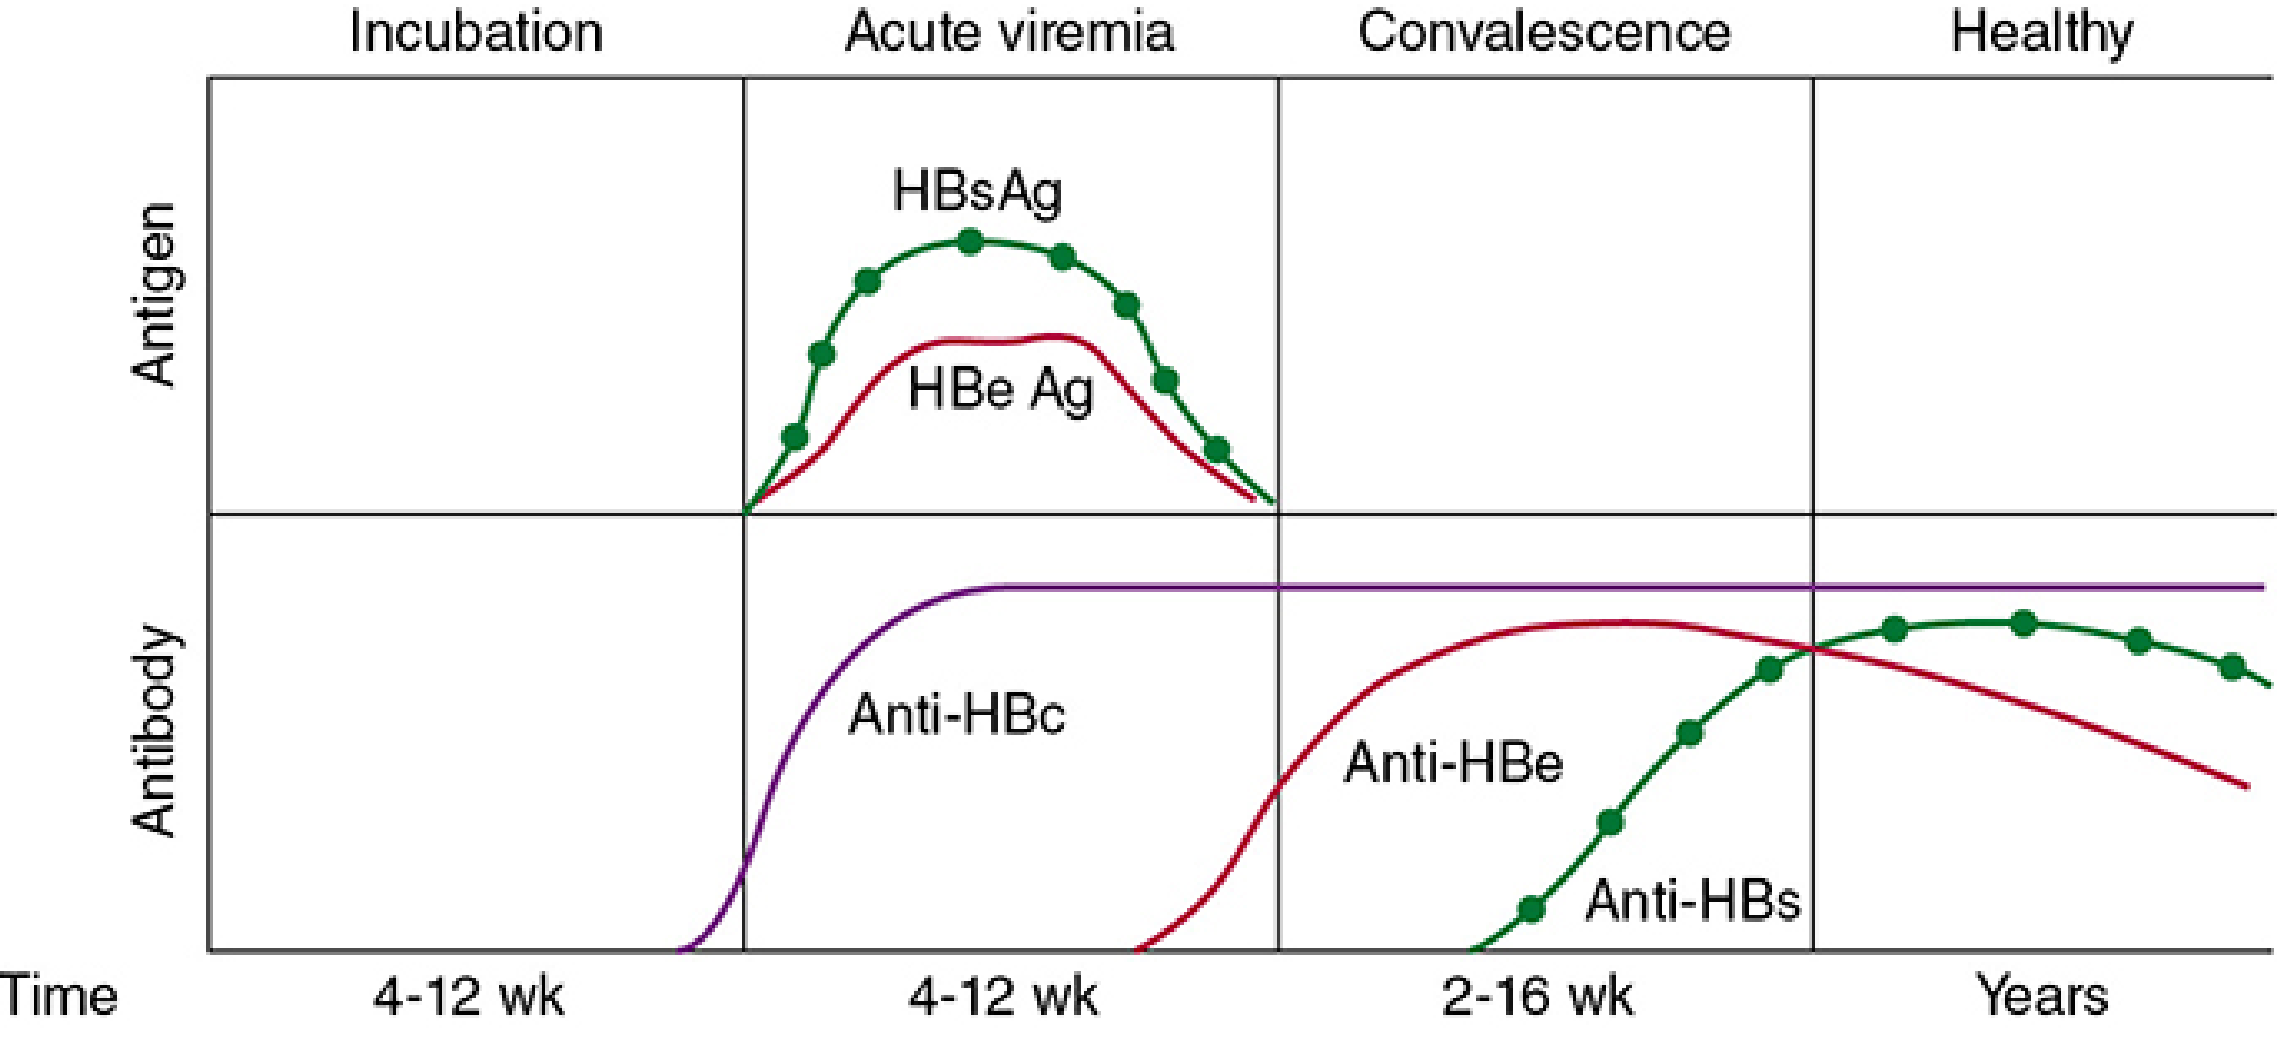
6. The "Window Period"
-
HBsAg: negative (cleared)
-
Anti-HBs: not yet detectable
-
IgM anti-HBc: positive - the only marker present, therefore critical for diagnosing acute HBV during the window period
-
Sherris & Ryan's, p. 503
7. Interpreting Common Serologic Patterns
| HBsAg | Anti-HBs | Anti-HBc IgM | Anti-HBc IgG | HBeAg | Interpretation |
|---|---|---|---|---|---|
| + | - | + | + | + | Acute HBV infection (active replication) |
| + | - | - | + | + | Chronic HBV, high replication (HBeAg+) |
| + | - | - | + | - | Chronic HBV, low replication (HBeAg-) |
| - | - | + | + | - | Window period or resolving acute infection |
| - | + | - | + | - | Past infection, recovered |
| - | + | - | - | - | Vaccinated (anti-HBs only, no anti-HBc) |
| - | - | - | + | - | Isolated anti-HBc (remote past infection, or occult HBV) |
8. HBV DNA and HBV DNA Polymerase
9. Clinical Correlation
-
ALT/AST are typically 2-25x upper limit of normal during acute or chronic active hepatitis (immune-mediated hepatocyte necrosis)
-
Bilirubin, albumin, PT are normal unless cirrhosis or acute liver failure is present
-
Alpha-fetoprotein (AFP) elevation signals HCC development
-
Platelet count <160,000, AST > ALT, raised bilirubin, low albumin, and prolonged PT suggest advanced fibrosis/cirrhosis
-
Goldman-Cecil Medicine, International Edition; Harrison's 22E, p. 2687