
inbound5094961052635882988.jpg
Explain me this Ecg photo
Reading File
Finding Sources
Searching the Web
left ventricular hypertrophy ECG criteria Sokolow-Lyon voltage criteria interpretation
Finding Sources
Reading Web Page
https://litfl.com/left-ventricular-hypertrophy-lvh-ecg-libra…
Reading File
Loading Image
Here is a thorough interpretation of this ECG:
ECG Interpretation: Left Ventricular Hypertrophy (LVH)
Technical settings: 25 mm/s paper speed, 10 mm/mV gain, HR = 70 bpm — all standard. The machine has already labeled this LVH.
Basic Parameters
| Parameter | Finding |
|---|---|
| Heart rate | 70 bpm (normal) |
| Rhythm | Regular sinus rhythm |
| PR interval | Normal (~160–200 ms) |
| QRS duration | Mildly prolonged, consistent with LVH |
Key ECG Findings Supporting LVH
1. High Voltage (Voltage Criteria)
This is the most obvious feature. The QRS complexes are markedly tall/deep:
- V1–V2: Very deep S waves
- V5–V6: Very tall R waves
- Sokolow-Lyon criterion: S in V1 + R in V5 (or V6) ≥ 35 mm — clearly met on this tracing
- Cornell criterion: R in aVL + S in V3 ≥ 28 mm (men) — likely also met
2. LV Strain Pattern
- V5, V6, I, aVL: ST-segment depression with asymmetric T-wave inversion — this is the classic "strain" pattern, reflecting repolarization abnormality from the hypertrophied LV myocardium
- The strain pattern carries adverse prognostic significance (associated with higher cardiovascular event rates)
3. Limb Lead Changes
- aVL: Tall R wave (≥11 mm is criterion for LVH)
- aVR: Predominantly negative deflection (expected)
- aVF: Low-amplitude or biphasic complexes — axis is likely normal to slightly leftward
4. Precordial Transition
- Poor R-wave progression in V1–V3, consistent with the enlarged LV dominating the electrical field
What LVH Means Clinically
LVH on ECG indicates the left ventricle has increased muscle mass, typically due to:
| Common Cause | Notes |
|---|---|
| Hypertension (most common) | Chronic pressure overload |
| Aortic stenosis | Pressure overload |
| Hypertrophic cardiomyopathy | Primary myocardial disease |
| Aortic regurgitation | Volume overload |
| Athlete's heart | Usually without strain |
The combination of high voltage + strain pattern (as seen here) is most consistent with pathological LVH (hypertension or valvular disease) rather than athletic adaptation.
Visual Reference
Below is the textbook diagram showing how LVH shifts electrical forces leftward/posteriorly, producing deep S waves in V1 and tall R waves in V6, compared to normal and RVH:
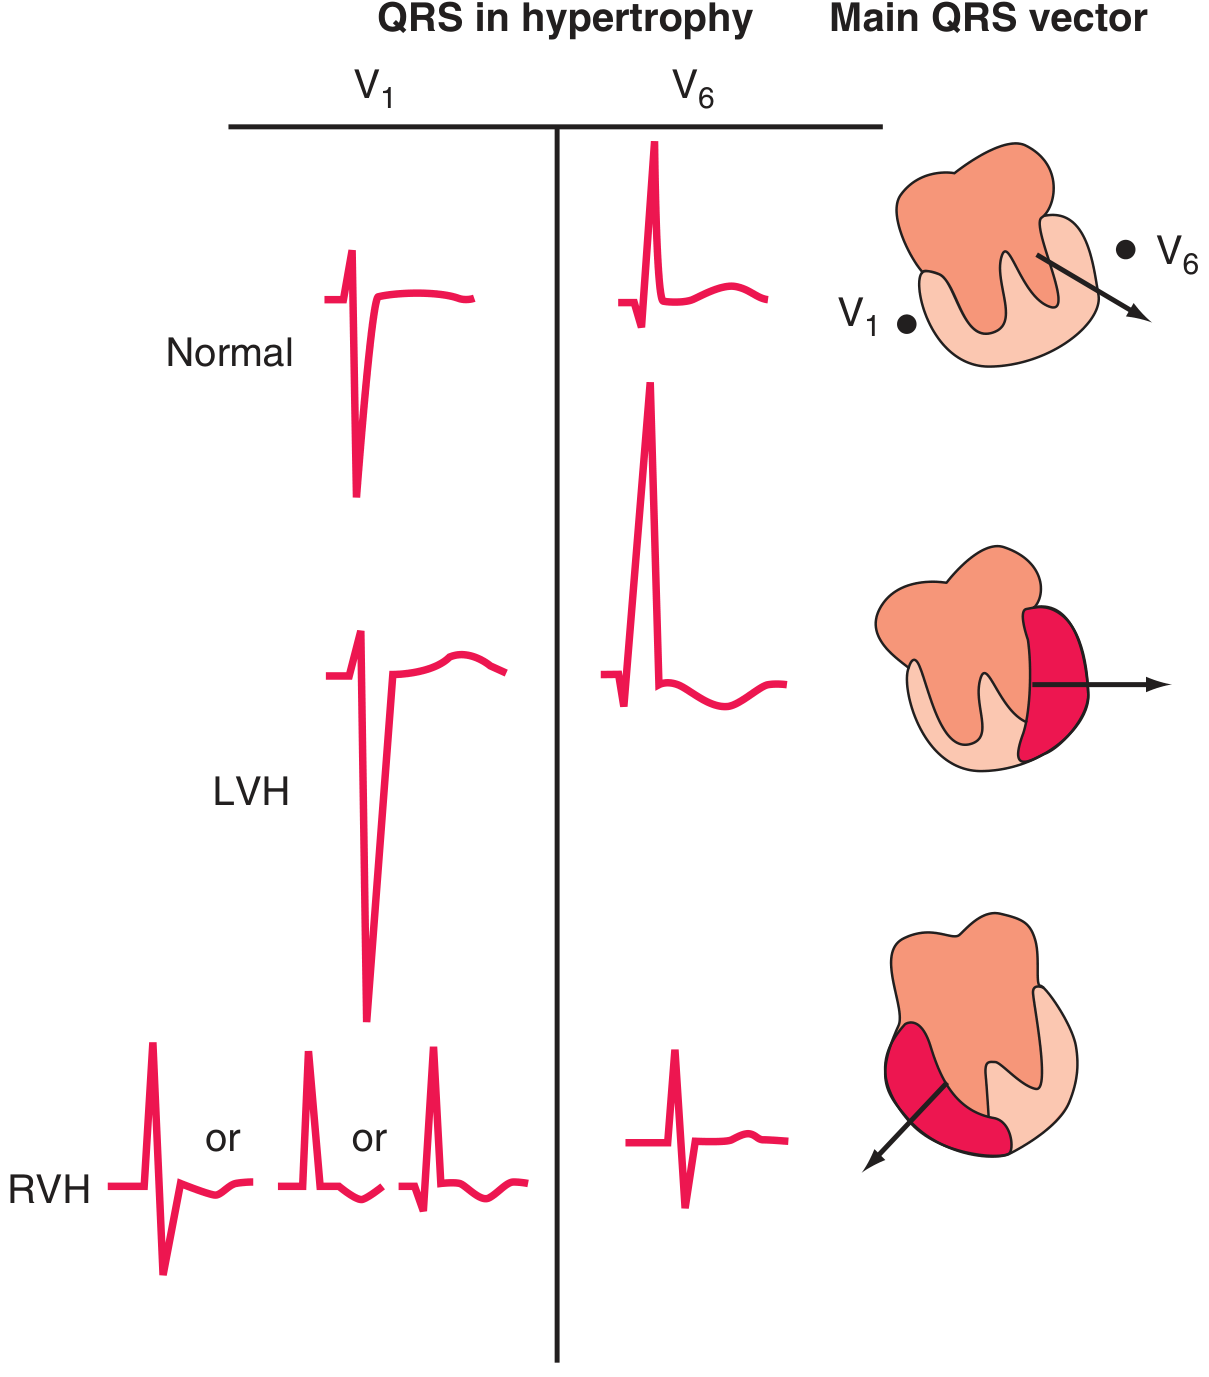
Source: Harrison's Principles of Internal Medicine, 22nd ed. (2025), Figure 247-9
Summary
This is a classic LVH ECG with:
- ✅ Voltage criteria met (deep S in V1–V2, tall R in V5–V6)
- ✅ LV strain pattern (ST depression + T-wave inversion in lateral leads V5, V6, aVL)
- ✅ HR 70, regular sinus rhythm — no arrhythmia
- ✅ Machine interpretation confirmed: LVH
Clinical recommendation: Echocardiogram is the gold standard to confirm and quantify LV mass, and to look for an underlying cause (especially hypertension or valvular disease).
⚠️ This interpretation is for educational purposes only and is not a substitute for evaluation by a licensed clinician.
Qrs comple x ta pic e dekhai dao
Reading File
Searching Images
QRS complex ECG waveform labeled diagram components Q R S waves
Finding Sources
Loading Image
Loading Image
এই ছবিগুলো দেখো — QRS complex ভালোভাবে বোঝার জন্য:
QRS Complex — সম্পূর্ণ ব্যাখ্যা
১. ECG-র পূর্ণ তরঙ্গচিত্র (Harrison's Textbook)
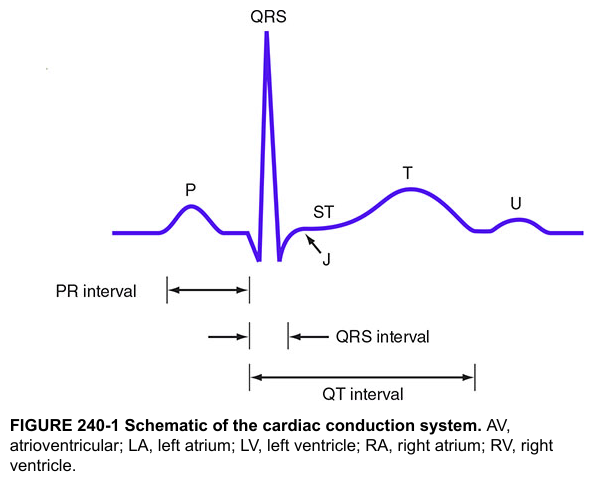
২. QRS Complex কী?
QRS Complex-এর প্রতিটি অংশ:
| তরঙ্গ | কী বোঝায় | দিক |
|---|---|---|
| Q wave | প্রথম নিচমুখী (negative) deflection | Baseline-এর নিচে |
| R wave | বড় উচ্চমুখী (positive) spike | Baseline-এর উপরে — সবচেয়ে লম্বা |
| S wave | R-এর পরের নিচমুখী deflection | Baseline-এর নিচে |
QRS Complex কী প্রতিনিধিত্ব করে?
ভেন্ট্রিকলের (হৃদয়ের নিচের দুই কক্ষ) বৈদ্যুতিক উত্তেজনা (depolarization) = রক্ত পাম্পের সংকোচন
- P wave → Atria (উপরের কক্ষ) সংকুচিত হয়
- QRS complex → Ventricle (নিচের কক্ষ) সংকুচিত হয় — রক্ত সারা শরীরে যায়
- T wave → Ventricle বিশ্রাম নেয় (repolarization)
QRS-এর স্বাভাবিক মাপ:
| বৈশিষ্ট্য | স্বাভাবিক মান |
|---|---|
| সময় (Duration) | ≤ 120 ms (3 ছোট বর্গ) |
| R wave height (V5/V6) | ≤ 25–27 mm |
| Q wave | Depth < 25% of R wave, duration < 40 ms |
তোমার ECG-তে (LVH):
- R wave অনেক লম্বা (V5, V6-তে) → LVH-র প্রধান লক্ষণ
- S wave অনেক গভীর (V1, V2-তে) → LVH confirm করে
- Sokolow-Lyon: S(V1) + R(V5) ≥ 35 mm → এই ECG-তে clearly পূরণ হয়েছে
সহজ কথায়: QRS হলো হার্টের পাম্প করার বৈদ্যুতিক সংকেত — এটি যত লম্বা/গভীর, বুঝতে হবে হার্টের দেয়াল তত মোটা (LVH)।
This is a shared conversation. Sign in to Orris to start your own chat.