
Care of baby during first 1000 days of birth in detail pointwise
care of baby first 1000 days of life detailed guidelines nutrition development
first 1000 days of life infant development nutrition timeline
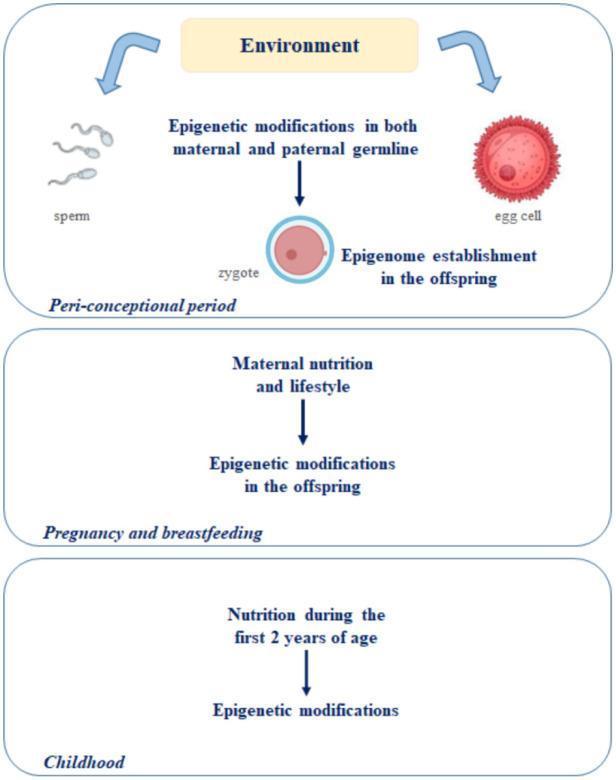
A pathophysiology diagram illustrating the 'First 1000 Days of Life' theory, highlighting the windows of epigenetic plasticity and susceptibility. The diagram is organized into three chronological stages. The 'Peri-conceptional period' shows sperm and egg cells being influenced by the environment, leading to epigenetic modifications in the maternal and paternal germlines during zygote formation. The second stage, 'Pregnancy and breastfeeding', emphasizes how maternal nutrition and lifestyle choices drive epigenetic modifications in the developing offspring. The final stage, 'Childhood', focuses on nutrition during the first 2 years of age as a key factor in continued epigenetic modification. The flowcharts use vertical pathways to demonstrate how external factors (environment and nutrition) directly influence the establishment of the epigenome from conception through early childhood development. This educational visual is designed for medical genetics and pediatrics, demonstrating the developmental origins of health and disease (DOHaD) concept.
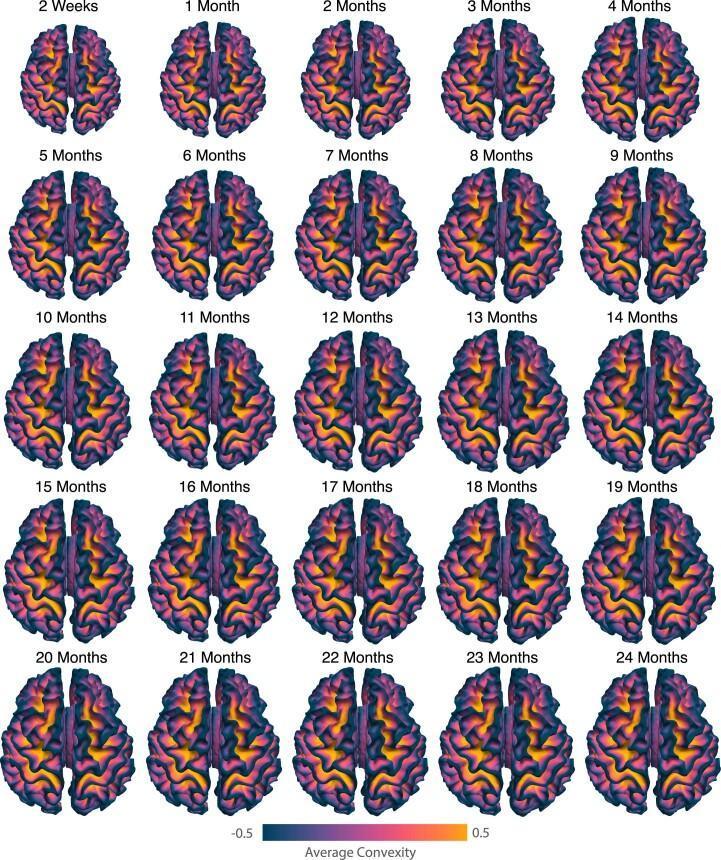
This series of 25 diagnostic images presents a longitudinal timeline of infant brain development through cortical surface atlases from 2 weeks to 24 months of age. Each atlas illustrates the gray matter-white matter interface (white surface) in a superior view, color-coded by average convexity measured in millimeters (scale: -0.5 to 0.5 mm). Darker blue/purple hues represent negative convexity (deep sulci), while yellow/orange hues represent positive convexity (prominent gyri). The timeline demonstrates a significant progression in cortical gyrification and surface complexity over the first two years of life. At 2 weeks, the brain displays a relatively smooth surface with simplified sulcal patterns. As maturation progresses, particularly between 6 and 12 months, the gyral and sulcal architecture becomes increasingly defined and intricate. By 24 months, the cortical folds exhibit adult-like complexity with sharp contrast between the deeply recessed sulci and well-formed primary and secondary gyri. This visual resource is used to study neurodevelopmental milestones in surface geometry and brain volume expansion during infancy.
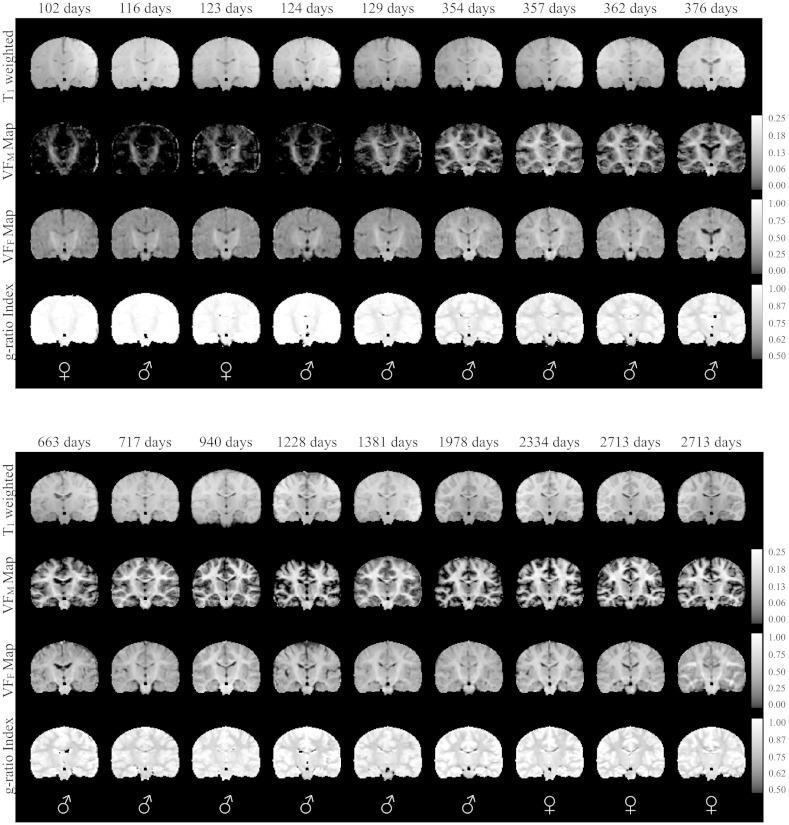
This Comparison Chart displays sequential coronal diagnostic images of infant brain development across a timeline ranging from 102 to 2713 days. The visualization is organized into four distinct imaging modalities per subject: T1-weighted MRI, Volume Fraction of Myelin (VFM) maps, Volume Fraction of Fluid (VFF) maps, and Myelin g-ratio index maps. The T1-weighted images demonstrate a progressive increase in gray-white matter contrast and signal intensity in the white matter, indicative of normative neurodevelopment. The VFM maps show a chronological increase in signal within white matter tracts, signifying active myelination. In contrast, the g-ratio index maps—representing the ratio of the inner to the outer diameter of the myelin sheath—show a decrease in values (transitioning from lighter to darker intensities) as the subjects age, reflecting the maturation and thickening of the myelin sheath. Clinical significance focuses on characterizing the spatio-temporal patterns of infant brain maturation, starting from central structures like the internal capsule and progressing toward the cortical lobes. This material serves as a reference for pediatric neuroradiology and developmental neuroscience.
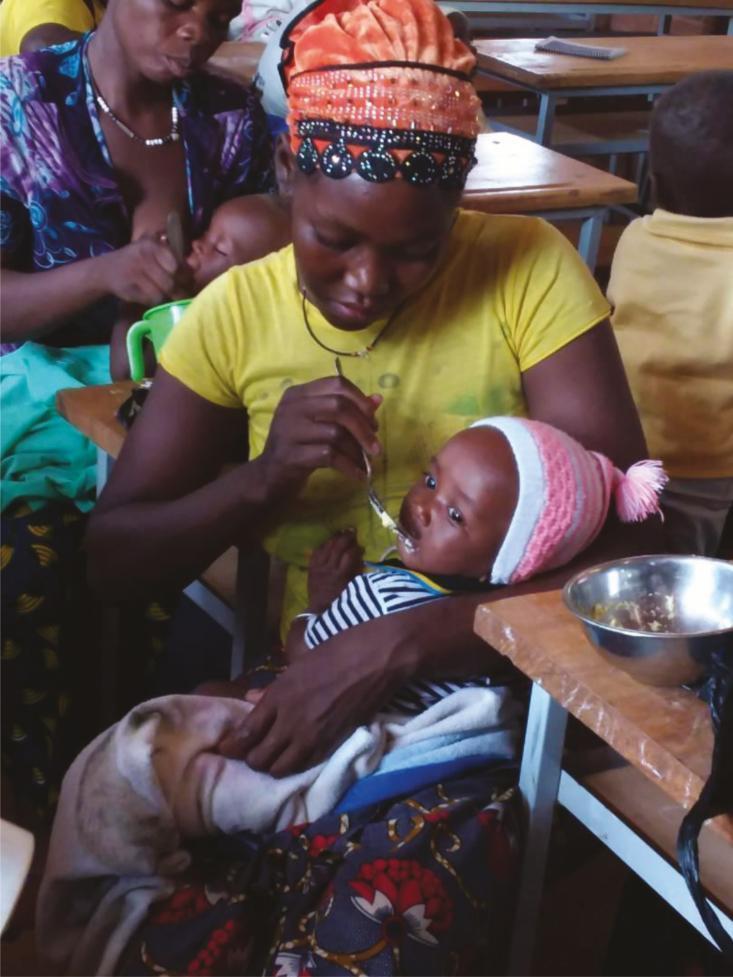
This clinical photograph illustrates a key aspect of pediatric nutrition and public health, depicting a woman feeding an infant in Burkina Faso. The image serves as an educational resource regarding the importance of complementary feeding and animal-sourced foods in low- and middle-income countries. The caregiver is using a metal spoon to feed the infant from a metal bowl containing eggs, which are high-quality sources of protein, essential amino acids, and polyunsaturated fatty acids like docosahexaenoic acid (DHA) and eicosapentaenoic acid (EPA). These nutrients are critical for neurodevelopment and preventing growth stunting. The setting appears to be a communal or educational environment, highlighting maternal-child health interventions. Key educational concepts include dietary diversity, the role of micronutrients (Vitamin A, B12, iron, and zinc) in preventing protein-energy malnutrition and anemia, and the impact of animal-sourced foods on cognitive development and overall physical growth during the first 1,000 days of life.
"first 1000 days" infant child development nutrition
Care of Baby During the First 1000 Days of Life
PHASE 1: Prenatal Period (Conception to Birth - ~270 days)
1. Maternal Nutrition
- Folic acid 400-800 mcg/day from preconception through first trimester to prevent neural tube defects
- Iron supplementation (30-60 mg/day) to prevent maternal anemia, which directly affects fetal brain oxygenation
- Iodine 150-220 mcg/day - iodine deficiency is the leading preventable cause of intellectual disability worldwide
- Omega-3 fatty acids (DHA/EPA) for fetal brain and retinal development
- Choline 450 mg/day for fetal hippocampal development and memory
- Calcium 1000 mg/day for fetal skeletal growth and to reduce maternal bone resorption
- Vitamin D 600-2000 IU/day for calcium absorption and immune programming
- Avoid alcohol, tobacco, and teratogenic drugs entirely
2. Antenatal Care
- Minimum 8 antenatal visits recommended by WHO
- Regular monitoring of fetal growth via fundal height and ultrasound
- Screening for gestational diabetes, pre-eclampsia, and infections (TORCH, GBS, HIV, syphilis)
- Tetanus toxoid vaccination for mother (2 doses)
- Prevention and treatment of infections (malaria, UTIs) that cause preterm birth and low birth weight
3. Birth Preparedness
- Institutional delivery at a facility with skilled birth attendance
- Planning for emergencies (hemorrhage, birth asphyxia)
- Preparation for immediate skin-to-skin contact and early breastfeeding
PHASE 2: Newborn Period (0-28 days)
4. Immediate Post-Birth Care (First Hour - "Golden Hour")
- Skin-to-skin contact (kangaroo care) immediately after birth for warmth, bonding, and breastfeeding initiation
- Early initiation of breastfeeding within 1 hour of birth - colostrum is the "first vaccine," rich in IgA antibodies, lactoferrin, and growth factors
- Delayed cord clamping (at least 1-3 minutes) - increases iron stores by 40-50%, reducing anemia risk in later infancy
- Drying and stimulating to prevent hypothermia
- Vitamin K 1 mg IM to prevent hemorrhagic disease of the newborn
- Eye prophylaxis (erythromycin ointment or 1% silver nitrate) for gonococcal ophthalmia neonatorum
5. Newborn Screening
- Metabolic screen: PKU, congenital hypothyroidism, galactosemia, CAH, G6PD deficiency, maple syrup urine disease (conditions treated if caught early prevent permanent disability)
- Hearing screen: Universal newborn hearing screening (OAE or ABR) - hearing loss identified by 3 months and treated by 6 months leads to normal language development
- Pulse oximetry: screening for critical congenital heart disease
- Gestational age assessment and classification (SGA, AGA, LGA)
6. Thermal Protection
- Normal room temperature 25-28°C
- Avoid bathing for 24 hours (or delay first bath 6-24 hours)
- Keep head covered; avoid drafts
- Skin-to-skin carries body heat for low birth weight (LBW) babies
7. Cord Care
- Keep umbilical stump clean and dry
- Use of chlorhexidine 7.1% gel on cord stump for neonates in low-resource settings reduces omphalitis and neonatal mortality
- Watch for signs of infection: redness, swelling, foul-smelling discharge
8. Vaccinations at Birth
- BCG (tuberculosis protection)
- OPV-0 (birth dose of oral polio vaccine)
- Hepatitis B (birth dose within 24 hours of birth - prevents vertical transmission)
PHASE 3: Infancy - 0 to 6 Months
9. Exclusive Breastfeeding
- Exclusive breastfeeding for the first 6 months - no water, formula, or other foods
- Breast milk changes composition (foremilk to hindmilk) within a feed; both are needed
- Feed on demand, typically 8-12 times per 24 hours in early weeks
- Benefits: provides all calories, water, and micronutrients; transfers maternal antibodies (sIgA); reduces SIDS risk by 50%; reduces diarrhea and pneumonia by 2-fold; lowers adult obesity, diabetes, and cardiovascular disease risk
- Signs of adequate intake: 6+ wet diapers/day, regains birth weight by day 10-14, consistent weight gain
10. Vitamin D Supplementation (0-12 months)
- 400 IU/day Vitamin D for all breastfed infants from day 1 - breast milk is low in Vitamin D regardless of maternal status
- Formula-fed infants who receive <1 L/day of formula also need supplementation
11. Growth Monitoring
- Weight checked at each visit: birth, 2 weeks, 1, 2, 4, 6, 9, 12, 15, 18, 24 months
- Plot on WHO Child Growth Standards (not older NCHS charts) - based on breastfed infants as the norm
- Track weight-for-age, length-for-age, weight-for-length, and head circumference
- Head circumference reflects brain growth - normal growth is 2 cm/month in first 3 months
12. Developmental Stimulation (0-6 months)
- Tummy time while awake and supervised (30 min/day total) - prevents flat head, strengthens neck muscles
- Talk, sing, and read to baby from birth - language circuits form by cooing and babbling stage (2-3 months)
- Visual tracking develops by 2 months (follows objects 180°)
- Social smile expected by 6-8 weeks - absence is a red flag
- Avoid screens entirely in this age group
13. Sleep Safety (Back to Sleep / Safe Sleep)
- Always place baby on their back to sleep - reduces SIDS risk by 50%
- Firm, flat sleep surface; no pillows, bumpers, or loose bedding
- Room-sharing (not bed-sharing) for first 6 months
- Pacifier use at sleep time reduces SIDS risk
PHASE 4: Infancy - 6 to 12 Months
14. Complementary Feeding (Weaning)
- Start complementary foods at exactly 6 months - not before 4 months, not after 6 months
- Continue breastfeeding alongside complementary foods up to 2 years and beyond
- Texture progression: purees (6 months) → mashed/lumpy (7-8 months) → soft pieces (9-12 months) → family foods (12+ months)
- Frequency: 2-3 meals/day at 6-8 months; 3-4 meals/day by 9-11 months
- Portion progression: 2-3 teaspoons at start → 125 mL (half cup) by 12 months
15. Key Nutrients in Complementary Foods
- Iron: highest priority at 6 months because fetal iron stores run out; iron-rich foods - meat, poultry, fish, iron-fortified cereals, lentils, beans
- Zinc: required for immune function and growth; found in meat, legumes, fortified foods
- Vitamin A: egg yolk, orange/yellow vegetables, dark leafy greens; prevents blindness and reduces infection severity
- DHA/Omega-3: oily fish 2x/week for brain and eye development
- Dietary diversity - minimum 5 out of 8 food groups recommended by WHO/UNICEF for adequate micronutrient coverage
16. Allergen Introduction
- Early introduction (between 4-6 months) of common allergens (peanut, egg, wheat, tree nuts, fish) reduces allergy risk - do NOT delay allergen introduction
- Introduce one new food every 3-5 days to watch for reactions
- Signs of allergy: hives, vomiting, wheeze within 2 hours of feeding
17. Immunization Schedule (6-12 months)
- 6 weeks: DTP-1, OPV-1, Hib-1, Rotavirus-1, PCV-1, IPV-1
- 10 weeks: DTP-2, OPV-2, Hib-2, Rotavirus-2, PCV-2
- 14 weeks: DTP-3, OPV-3, Hib-3, IPV-2, PCV-3
- 9 months: Measles/MR vaccine dose 1, Vitamin A 1st dose (100,000 IU)
- 12 months: Varicella, Hepatitis A dose 1 (in applicable countries)
18. Developmental Milestones to Monitor (6-12 months)
- Rolls both ways (5-6 months)
- Sits independently (6-7 months)
- Pincer grasp, transfers objects hand to hand (8-9 months)
- Stands with support, cruises (9-12 months)
- First words ("mama," "dada" with meaning) by 12 months
- Babbles consonants by 6-7 months; uses gestures (waving, pointing) by 12 months
- Red flags: not sitting by 9 months, no words by 16 months, regression in any skill
19. Oral Health
- Wipe gums with damp cloth even before teeth erupt
- First tooth usually appears at 6-8 months (range 4-12 months is normal)
- Begin brushing with tiny smear of fluoride toothpaste as soon as first tooth appears
- No juice or sweetened drinks; no bottle in bed
- First dental visit by age 1
PHASE 5: Toddler Period (12 to 24 months / Second Year)
20. Continued Breastfeeding
- WHO recommends continued breastfeeding up to 2 years and beyond
- Provides up to 40-50% of energy needs in second year when diet is inadequate
- Continues to provide immune factors, reducing infections
21. Diet in the Second Year
- Transition to family foods by 12-18 months
- 3 main meals + 1-2 healthy snacks per day
- Serve variety - exposure to different textures and flavors prevents picky eating
- Iron: continue prioritizing; cow's milk should be limited to 500 mL/day (excess displaces iron-rich foods and causes iron deficiency anemia)
- Introduce full-fat cow's milk at 12 months (not skim); delay low-fat until after 2 years
- No honey before 12 months (risk of infant botulism)
- Limit salt, sugar, and processed foods
- Responsive feeding: allow child to self-regulate quantity; avoid force-feeding or using food as reward/punishment
22. Micronutrient Supplementation in Toddlers
- Vitamin A 200,000 IU every 6 months from 9 months to 5 years of age
- Iron drops/syrup if dietary intake is inadequate or risk factors present (LBW, preterm, vegetarian diet)
- Vitamin D 600 IU/day if sun exposure is limited
- Zinc supplementation in areas of high diarrheal disease burden
- Routine deworming from 12 months in endemic areas
23. Immunization (12-24 months)
- 15 months: MMR-2 (second dose measles, mumps, rubella), DTP booster (in some schedules)
- 18 months: DTP booster, OPV booster
- 24 months: Hepatitis A dose 2, typhoid, meningococcal (depending on regional schedule)
- Maintain and review immunization card at every visit
24. Developmental Milestones (12-24 months)
- 12 months: stands alone briefly, first words
- 15 months: walks independently, 3-6 words, uses cup
- 18 months: runs, 10-20 words, points to body parts, parallel play begins
- 24 months: 2-word phrases ("want milk"), climbs stairs, uses spoon, 50+ words
- Red flags at 24 months: no 2-word phrases, not walking independently, no pointing, regression
25. Cognitive and Language Stimulation
- Read aloud daily - 15-20 minutes of shared book reading is one of the strongest predictors of language development
- Limit screen time to no screens before 18-24 months (video calls with known people are the exception)
- After 18-24 months: limit screen time to 1 hour/day of high-quality programming; co-view and discuss
- Play is the primary vehicle for learning: offer open-ended toys (blocks, cups, play-dough)
- Songs, nursery rhymes, and naming games build vocabulary
26. Physical Activity and Motor Development
- Encourage active floor play throughout the day
- No prolonged restraint in strollers/car seats/bouncers beyond necessity
- By 2 years: at least 3 hours of physical activity spread through the day (any intensity)
- Outdoor play for sunlight exposure and sensory stimulation
PHASE 6: Cross-Cutting Care Throughout the 1000 Days
27. Prevention of Infections
- Hand hygiene: handwashing with soap before feeding and after diaper changes reduces diarrhea by 44% and pneumonia by 23%
- Safe water and sanitation
- Exclusive breastfeeding is the most powerful single protective intervention against neonatal and infant infections
- Seek care early for signs of danger: fast breathing, not feeding, fever >38°C in infants <3 months, convulsions, very low weight
28. Prevention and Management of Common Illnesses
- Diarrhea: ORS + zinc (10-20 mg/day x 10-14 days) reduces duration and recurrence
- Pneumonia: danger signs - fast breathing, chest in-drawing, grunting; requires antibiotics and hospital care
- Iron deficiency anemia: most common nutritional deficiency globally; universal iron supplementation from 6 months for breastfed infants
- Rickets: prevented by Vitamin D + calcium; manifests as bowed legs, delayed closure of fontanelle
29. Psychosocial Care and Responsive Caregiving
- Respond consistently to baby's cues (crying, hunger, discomfort) - builds secure attachment
- Secure attachment is the foundation for social-emotional competence, stress regulation, and resilience throughout life
- Avoid harsh punishment; use positive reinforcement and redirection
- Parental mental health matters: screen mothers for postpartum depression at 2 weeks, 2 months, and 6 months (Edinburgh Postnatal Depression Scale); untreated maternal depression impairs child cognitive and emotional development
- Fathers and other caregivers should be actively involved - social/emotional enrichment from multiple responsive caregivers
30. Environmental Safety
- Never leave baby unattended on elevated surfaces (falls are leading cause of injury)
- Lock away medications, cleaning products
- Cover electrical outlets; secure furniture to walls
- Keep small objects away from reach (choking hazard)
- Never leave child near water unsupervised
- No smoking in the home - second-hand smoke increases SIDS, otitis media, and respiratory infections
31. Dental and Oral Development
- Avoid sugar-sweetened beverages entirely in first 2 years
- No dipping pacifier in honey or sugar
- Fluoride varnish application by dentist/pediatrician from first tooth eruption
32. Monitoring and Health System Contact
| Age | Recommended Action |
|---|---|
| Birth | Newborn screen, BCG, HBV, VitK |
| 6 weeks | First immunizations, weight, feeding check |
| 10 weeks | Second immunizations |
| 14 weeks | Third immunizations, growth monitoring |
| 6 months | Start complementary foods, growth monitoring |
| 9 months | MR vaccine, Vitamin A, hearing/vision check |
| 12 months | Booster vaccines, developmental screen |
| 15-18 months | Booster, language and developmental screen |
| 24 months | Final 1000-day review, dental check, screen for anemia |
Why the 1000 Days Are Irreplaceable
| Domain | Impact of Adequate Care |
|---|---|
| Brain | 80% of adult brain volume formed by age 3; neural connections peak and are pruned |
| Immune system | Gut microbiome established; immune tolerance/allergy risk determined |
| Metabolism | Epigenetic programming of insulin sensitivity, fat storage, and cardiovascular risk |
| Height | Stunting acquired before age 2 is largely permanent |
| Cognition | Children who receive full 1000-day support earn up to 20% more as adults (Lancet, 2024 review) |