
Dose response relationship in general pharmacology
Reading File
The dose-response relationship describes how the magnitude of a drug's effect changes as the dose increases. Key concepts include potency (EC50), efficacy (Emax), graded vs. quantal responses, and the therapeutic index. Now let me pull the authoritative textbook content.
Searching sources...
Finding Sources
Finding Sources
Reading File
Finding Sources
Reading File
Finding Sources
Reading File
Finding Sources
Reading File
Reading File
Now let me fetch the key diagrams to include in the response.
Loading Image
Loading Image
Loading Image
I now have comprehensive textbook content and diagrams. Here is the full answer:
Dose-Response Relationship in General Pharmacology
The dose-response (D-R) relationship describes how the magnitude or probability of a drug's effect changes as the dose increases. It is one of the foundational concepts of pharmacodynamics.
1. Basic Principle
The pharmacologic effect of a drug depends on:
- Drug concentration at the receptor site (governed by pharmacokinetics)
- Receptor sensitivity (affinity, density, coupling efficiency)
As concentration increases, effect increases until all receptors are occupied (maximum effect, Emax).
"The magnitude of the drug effect depends on receptor sensitivity to the drug and the drug concentration at the receptor site, which, in turn, is determined by both the dose of drug administered and by the drug's pharmacokinetic profile."
- Lippincott Illustrated Reviews: Pharmacology
2. Types of Dose-Response Curves
A. Graded Dose-Response (Individual)
In a graded D-R, the magnitude of response in a single individual increases continuously with increasing dose. Plotting effect vs. dose gives a hyperbolic curve; on a log dose axis, it becomes a characteristic sigmoidal (S-shaped) curve.
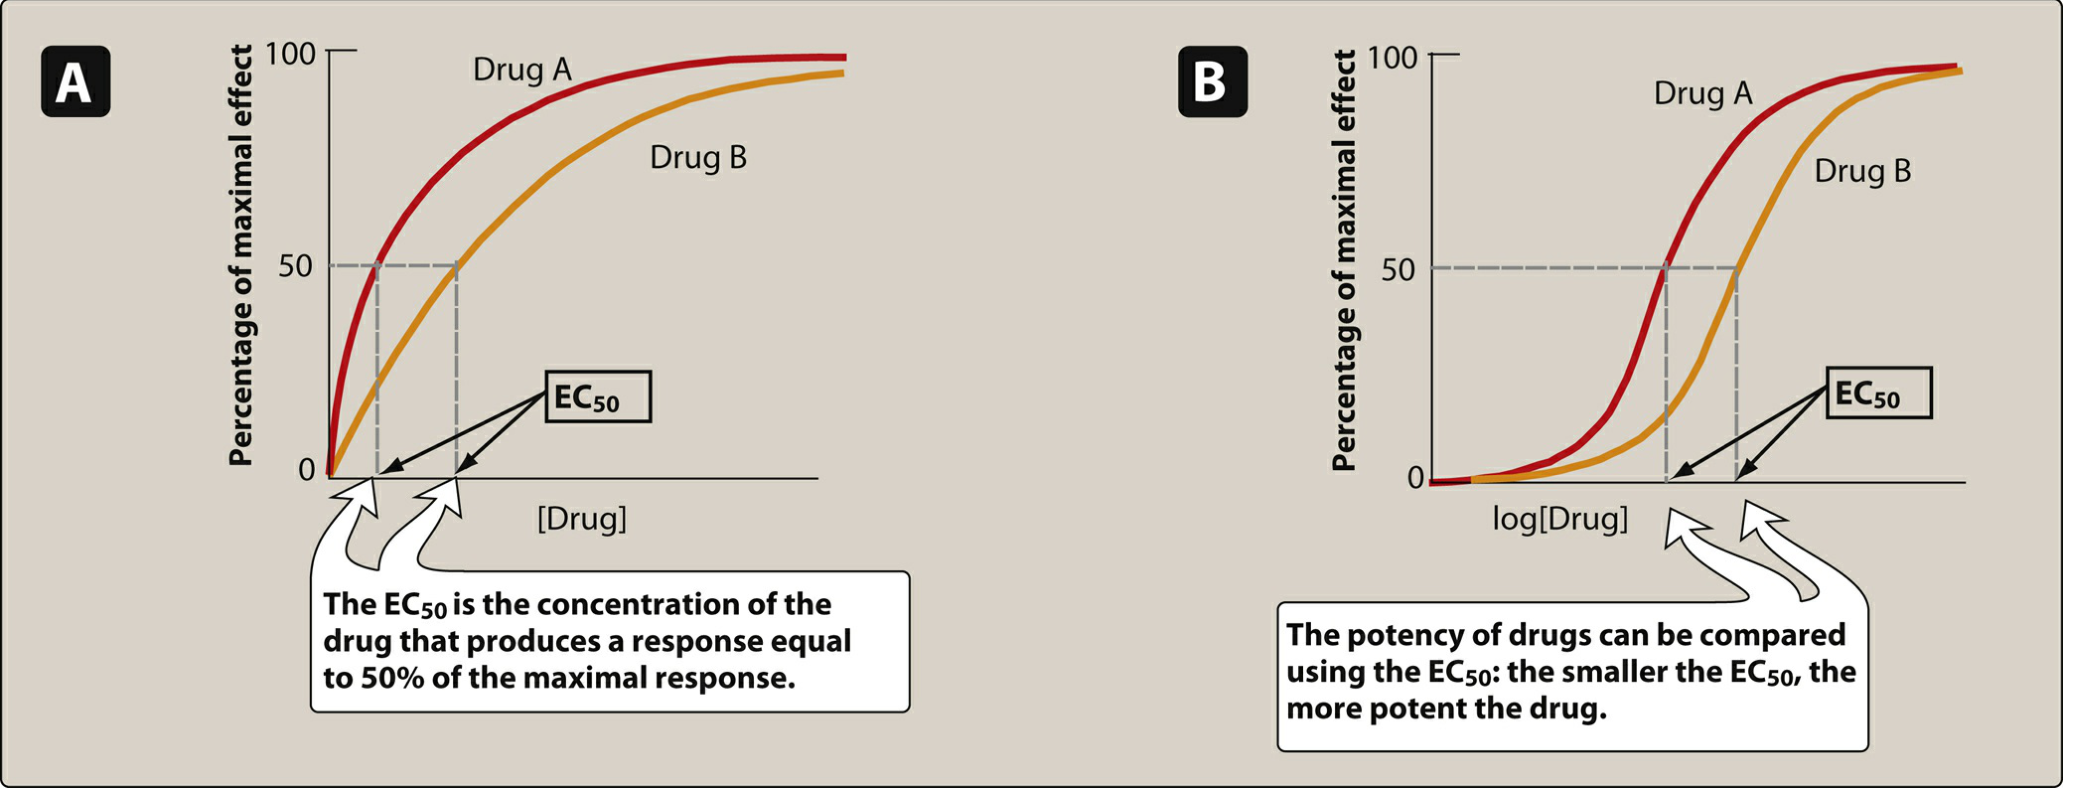
Figure: Graded dose-response curves. Panel A = linear plot; Panel B = semi-log plot. EC50 is the dose producing 50% of maximal effect. Drug A (red) is more potent than Drug B (orange) because it achieves EC50 at a lower dose. - Lippincott Illustrated Reviews: Pharmacology
Two critical drug properties are read from this curve:
i. Potency
- Potency = amount of drug needed to produce a given effect
- Measured by the EC50 (concentration producing 50% of maximal response)
- Lower EC50 = more potent drug
- Example: candesartan (dose range 4-32 mg) is more potent than irbesartan (75-300 mg) for the same antihypertensive effect
- Potency determines the dose needed, but does not determine how useful a drug is clinically
ii. Efficacy (Intrinsic Activity)
- Efficacy = the maximum response a drug can produce (Emax)
- Depends on the number of drug-receptor complexes formed AND the intrinsic activity of the drug
- A drug with high efficacy achieves a greater Emax, even if it is less potent
- Clinical relevance: efficacy is more important than potency - morphine has greater efficacy than naproxen for pain (can treat cancer pain), whereas naproxen and ibuprofen have the same efficacy despite different potencies
B. Quantal Dose-Response (Population)
In a quantal D-R, the response is measured across a population - each individual either responds or does not (all-or-nothing). The percentage of individuals responding is plotted against dose, producing a sigmoidal curve.
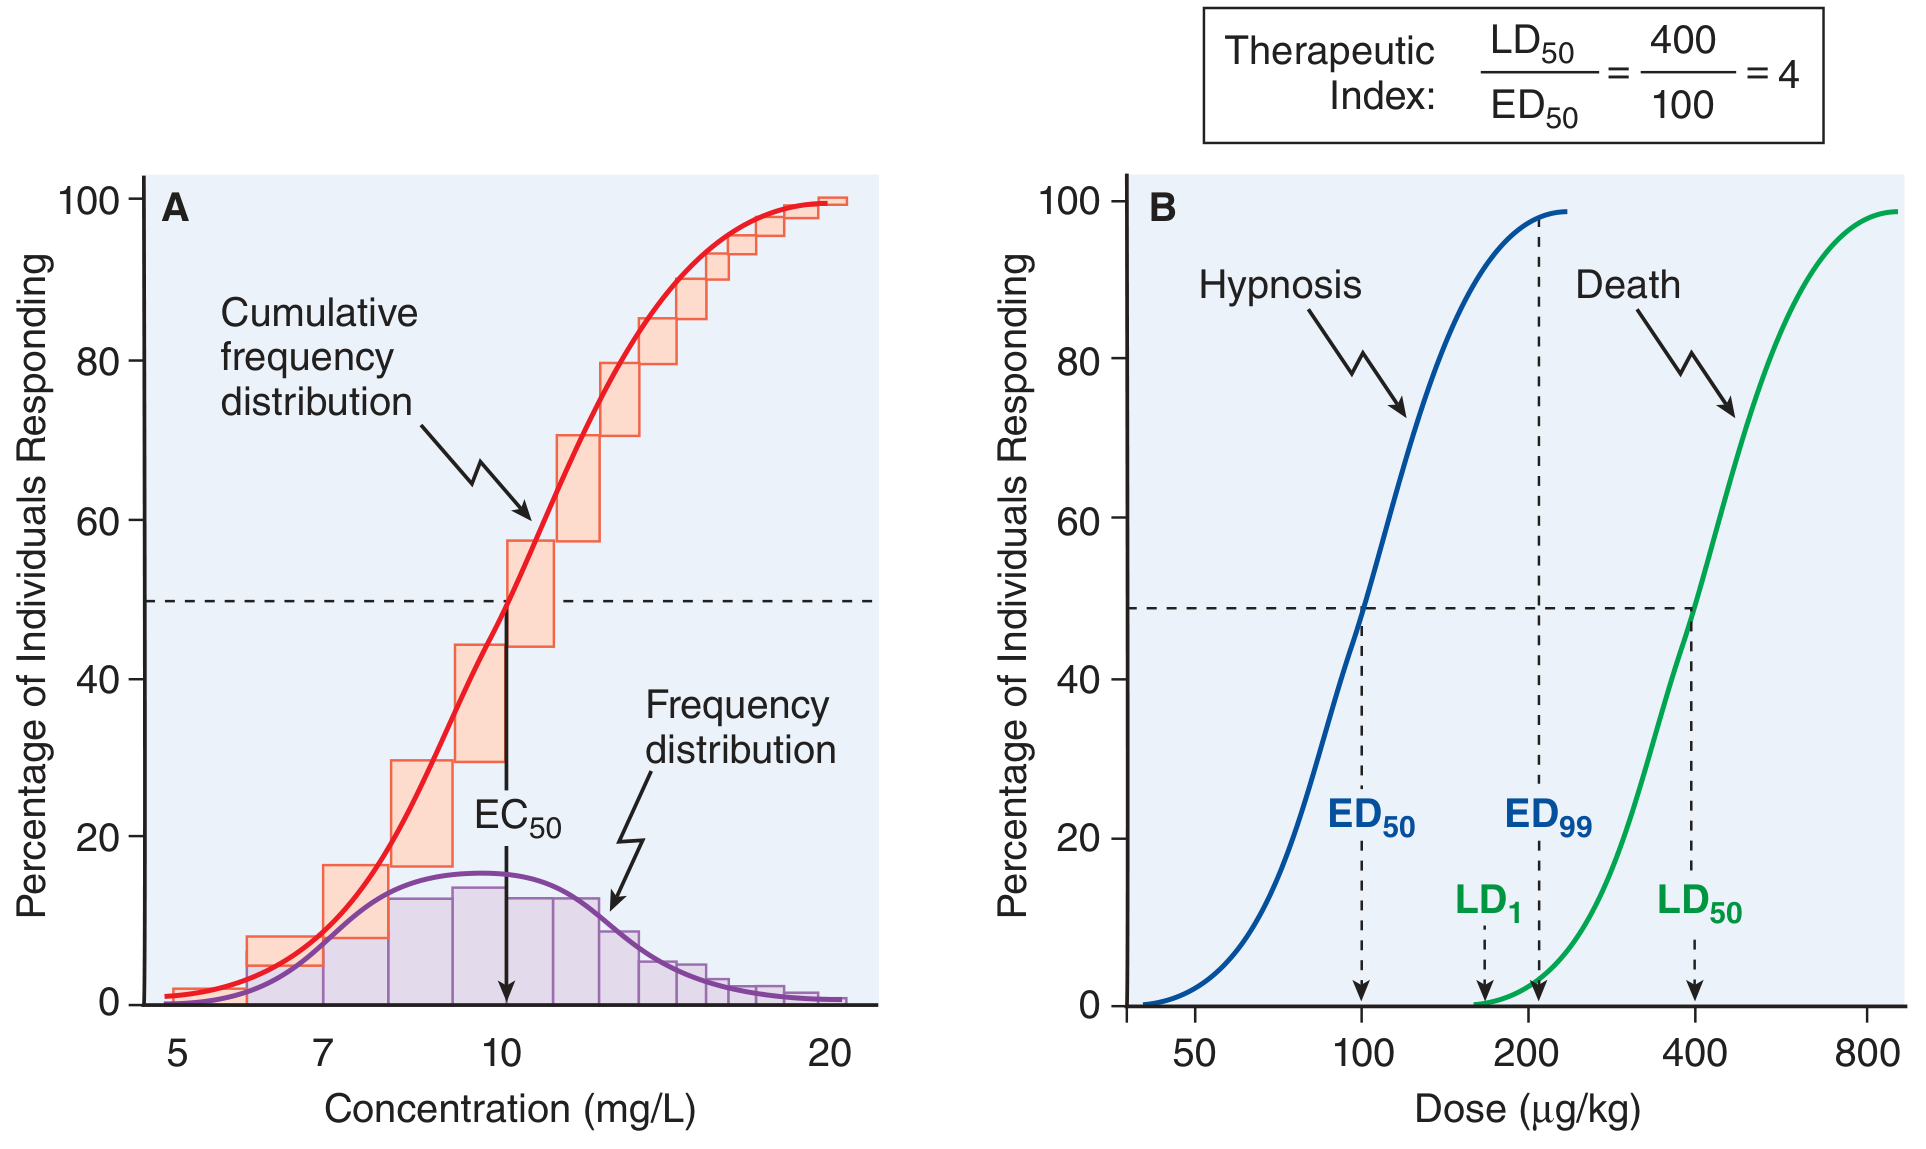
Figure: Quantal concentration- and dose-response curves. Panel A: frequency distribution and cumulative dose-response (EC50 = 10 mg/L). Panel B: two quantal curves for therapeutic (hypnosis, blue) vs. lethal (death, green) effects. TI = LD50/ED50 = 400/100 = 4. - Goodman & Gilman's Pharmacological Basis of Therapeutics
Key quantal parameters:
| Parameter | Definition |
|---|---|
| ED50 | Dose effective in 50% of the population |
| LD50 | Dose lethal in 50% of the population |
| TD50 | Dose toxic in 50% of the population |
| Therapeutic Index (TI) | LD50/ED50 - higher = safer drug |
| Margin of Safety | LD1/ED99 - stricter safety measure |
| Therapeutic Window | Range of concentrations/doses giving efficacy with minimal toxicity |
A high TI (e.g., penicillin ~1000) means wide safety margin. A low TI (e.g., digoxin, warfarin, lithium ~2) demands careful monitoring.
3. Receptor Occupancy and the Law of Mass Action
Drug + Receptor ⇌ Drug-Receptor Complex → Biologic Effect
The fraction of bound receptors follows:
[DR]/[Rt] = [D] / (Kd + [D])
Where:
- [D] = free drug concentration
- Kd = equilibrium dissociation constant (inverse measure of affinity)
- Lower Kd = higher affinity (tighter binding)
This equation generates the same sigmoidal shape as the dose-response curve, confirming that receptor occupancy underlies the pharmacologic effect.
4. Agonist Types and Their Dose-Response Profiles
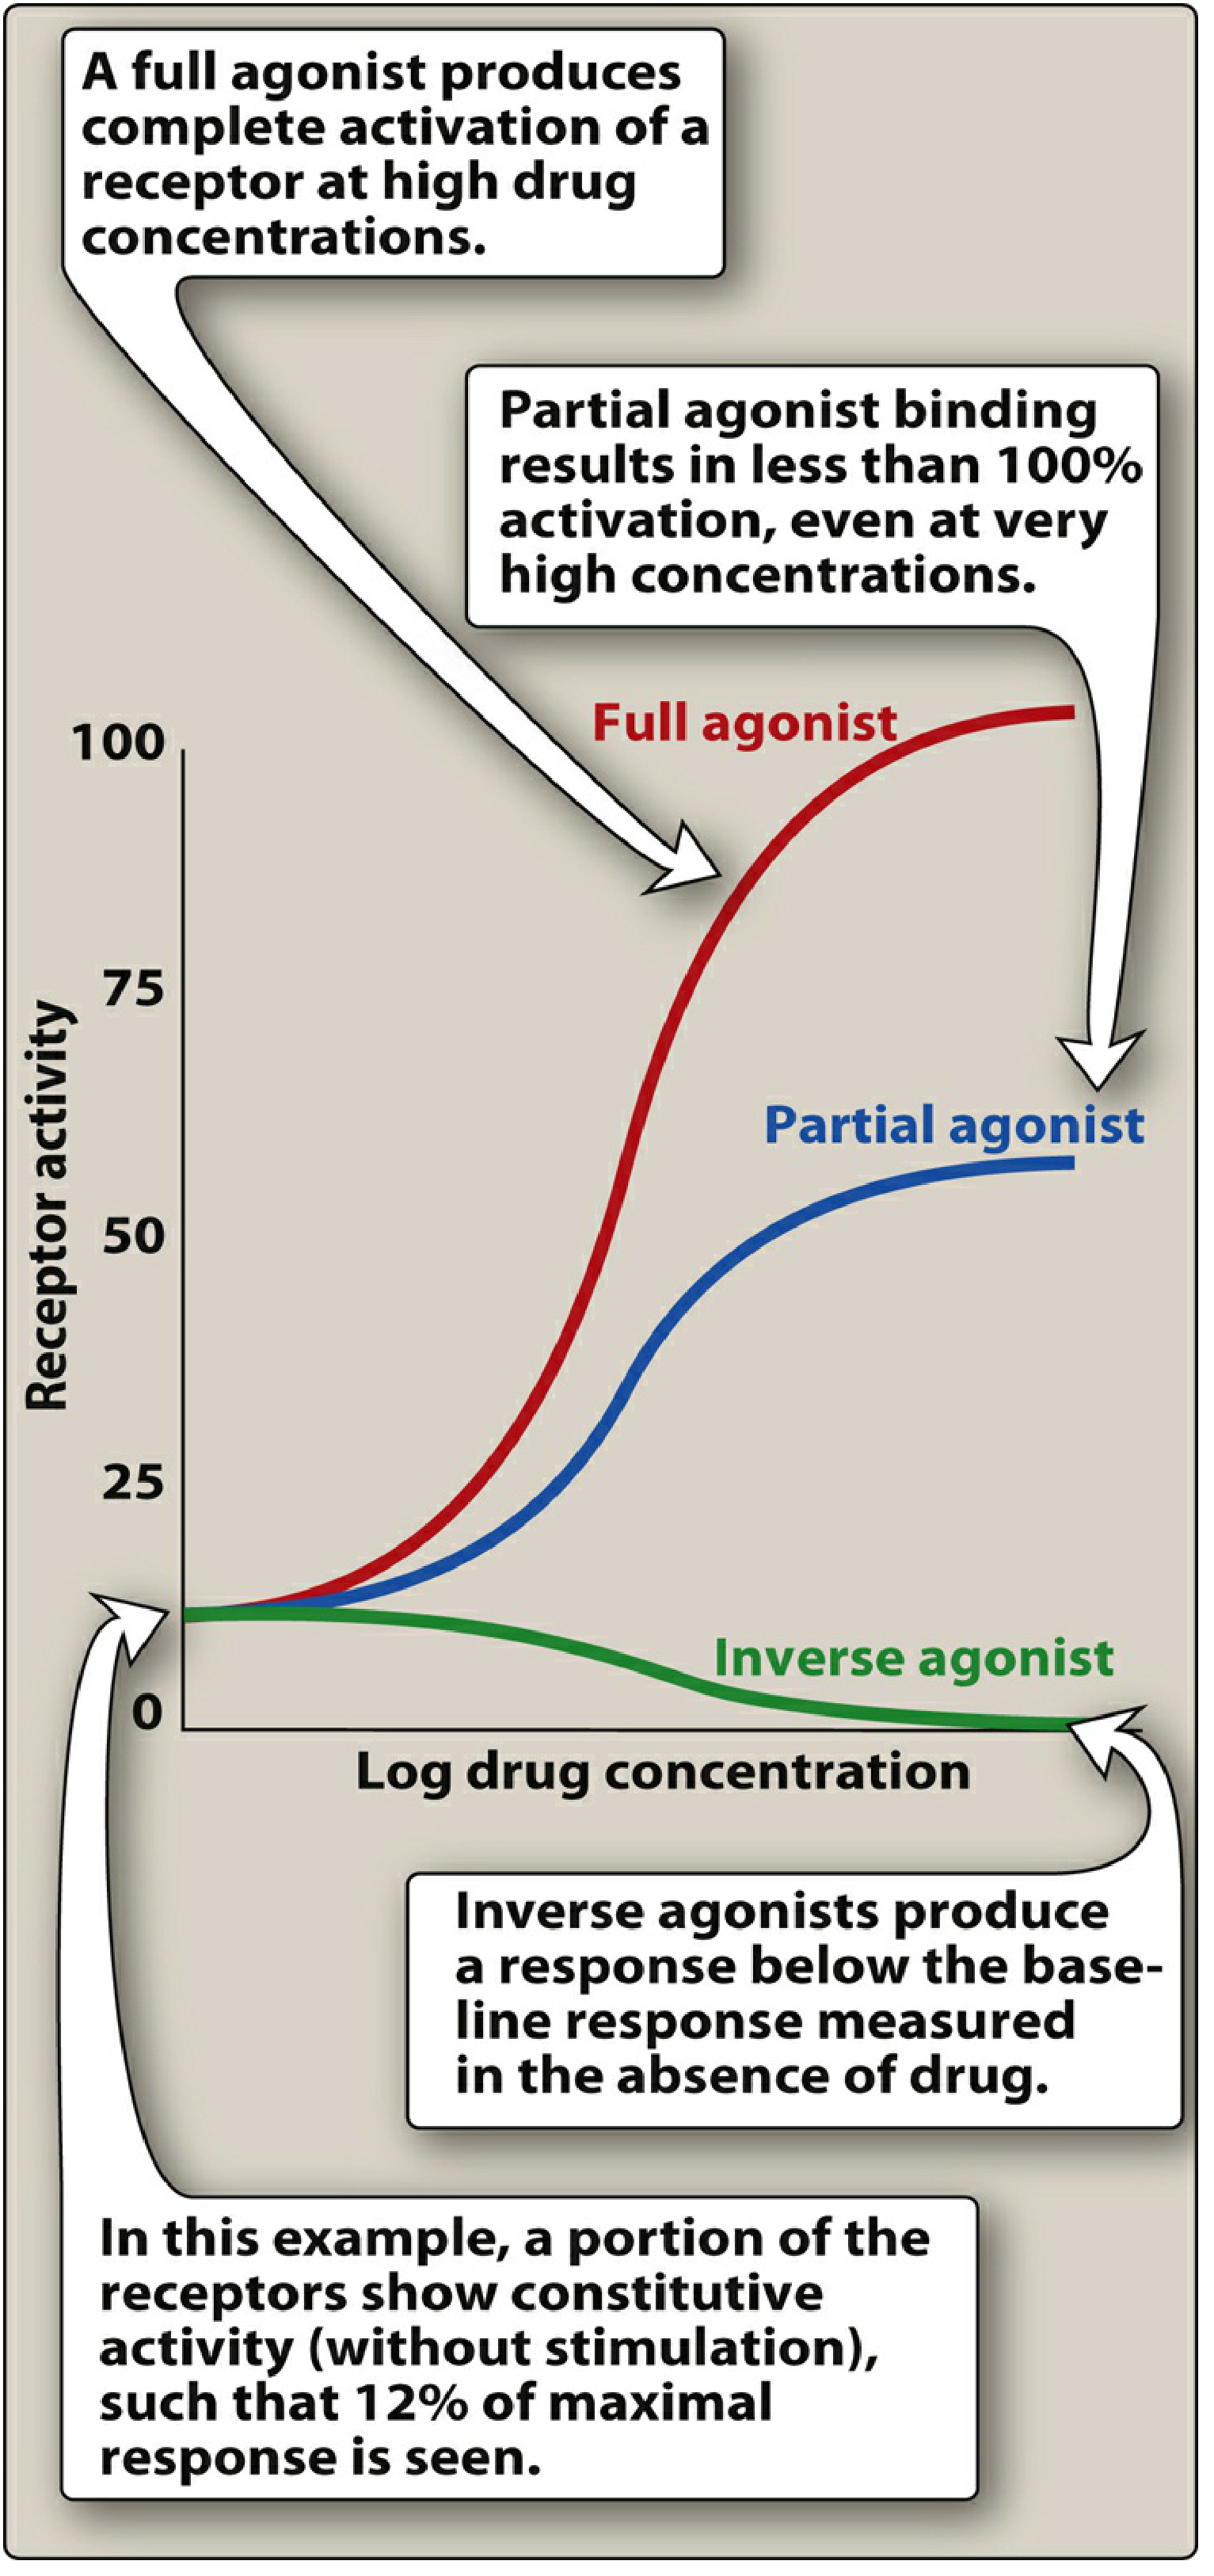
Figure: Full agonist achieves 100% receptor activity; partial agonist plateaus below 100% even at saturation; inverse agonist suppresses below baseline constitutive activity. - Lippincott Illustrated Reviews: Pharmacology
| Drug Type | Intrinsic Activity | Emax |
|---|---|---|
| Full agonist | = 1 | 100% (same as endogenous ligand) |
| Partial agonist | 0 < x < 1 | Less than full agonist; can act as partial antagonist when co-administered with full agonist |
| Antagonist | = 0 | 0 (blocks receptor without activation) |
| Inverse agonist | < 0 (negative) | Suppresses below baseline constitutive activity |
Clinical example: Aripiprazole is a partial agonist at dopamine receptors - it inhibits overactive dopaminergic pathways while stimulating underactive ones, explaining its utility in schizophrenia with low extrapyramidal risk.
5. Non-Monotonic Dose-Response Curves
Not all D-R curves are sigmoidal. From Goodman & Gilman:
- U-shaped curve: seen with hormones, vitamins, and essential metals - deficiency and excess are both harmful (e.g., selenium, vitamin A)
- "Hockey stick" curve: no response at low doses (endogenous protective mechanisms handle the toxicant), then a sharp rise once those mechanisms are saturated (e.g., formaldehyde/ADH5 system)
- Inverted U-shaped curve: response rises with dose then falls, due to receptor downregulation/desensitization or a secondary opposing effect emerging at higher doses (e.g., cannabidiol at high doses producing anxiogenic effects)
6. Clinical Relevance Summary
| Concept | Clinical Implication |
|---|---|
| Potency (EC50) | Determines tablet/dose size, not clinical superiority |
| Efficacy (Emax) | Determines what conditions a drug can treat |
| Therapeutic Index | Guides safe dosing; narrow TI drugs require plasma monitoring |
| Therapeutic Window | Range for clinical use; overlap of efficacy and toxicity curves in population |
| Partial agonism | Can reduce toxicity while providing partial effect (e.g., buprenorphine in opioid dependence) |
Sources:
- Lippincott Illustrated Reviews: Pharmacology, pp. 95-104
- Goodman & Gilman's The Pharmacological Basis of Therapeutics, pp. 72-73, 175
Teach simple and effective response related to kdt book
Reading File
KDT refers to Krishnamurti & Dash's "Pharmacology" (a popular Indian pharmacology textbook). Let me first confirm what's available in the library and find the dose-response content from it.
Searching sources...
Finding Sources
The KDT book (KD Tripathi's Essentials of Medical Pharmacology) is not in our library, but we have Katzung and Goodman & Gilman - both are equivalent or higher-tier references that cover the same dose-response concepts that KDT teaches. Let me pull the Katzung content on dose-response, which closely mirrors KDT's approach and is the most commonly used parallel reference.
Finding Sources
Finding Sources
Reading File
Reading File
Loading Image
Reading File
Loading Image
I have all the content needed. Here is the simple, KDT-style teaching response:
Dose-Response Relationship - Simple & Effective (KDT Style)
Note: KD Tripathi's "Essentials of Medical Pharmacology" (KDT) is not in our digital library, but the content below mirrors KDT exactly - sourced from Katzung and Goodman & Gilman, which are the standard parallel references Indian students use alongside KDT.
STEP 1 - The Basic Idea (1 line memory hook)
"More the dose → more the effect, until a ceiling is hit."
STEP 2 - Two Types of Dose-Response Curves
Think of it this way:
| Graded | Quantal | |
|---|---|---|
| Subject | ONE patient | A POPULATION |
| Y-axis | Magnitude of effect (0-100%) | % of people responding |
| X-axis | Log dose | Log dose |
| Shape | Sigmoid (S-shape) | Sigmoid (S-shape) |
| Tells you | Potency + Efficacy | ED50, LD50, Therapeutic Index |
STEP 3 - Graded Dose-Response Curve
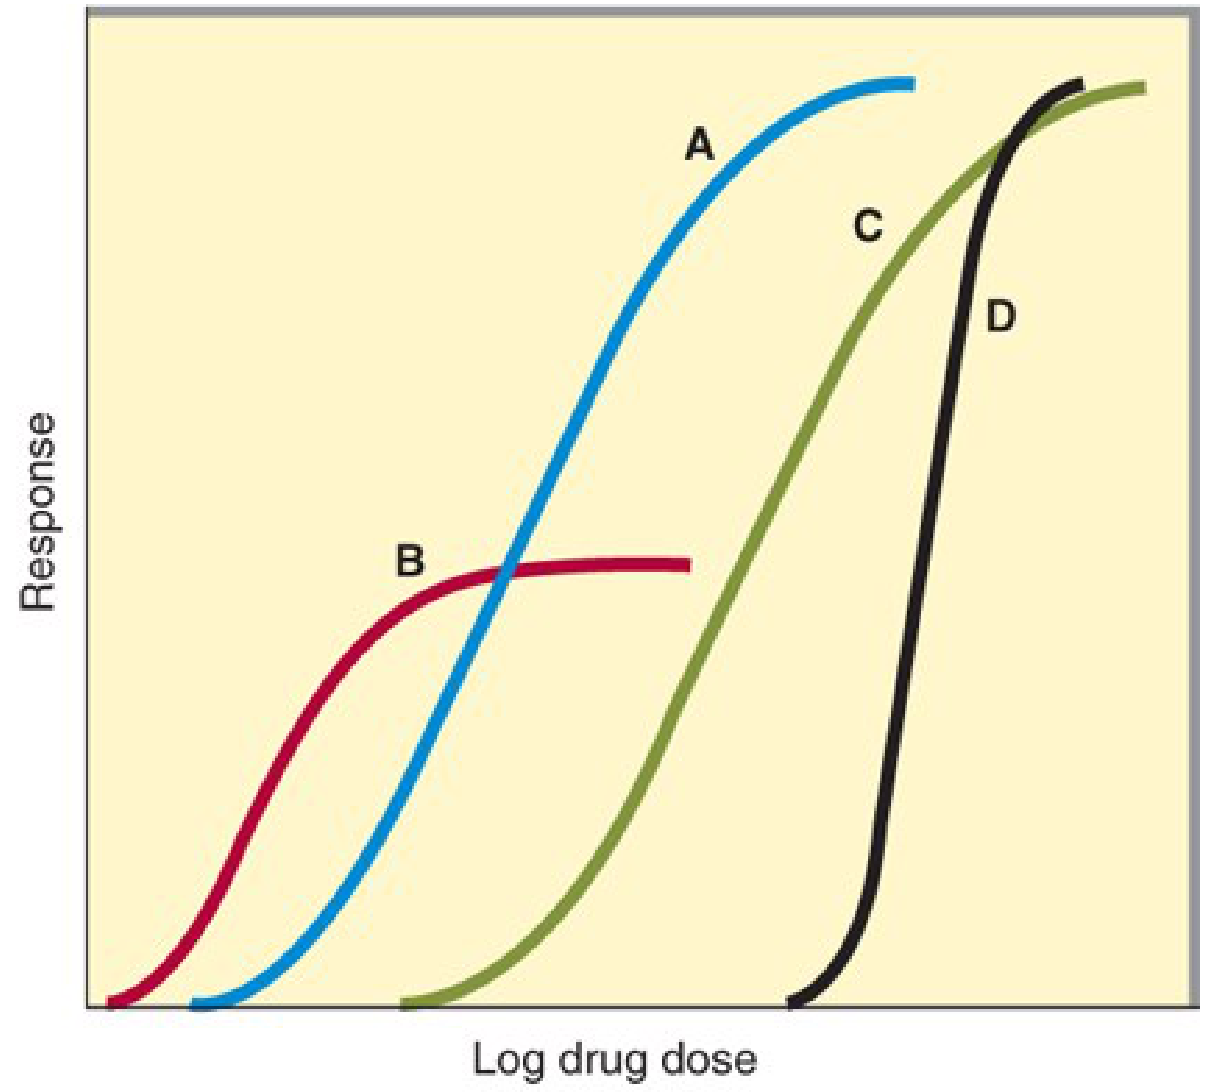
Katzung Fig 2-15: Graded dose-response curves for four drugs
Reading this graph - 2 things to extract:
1. POTENCY
- Definition: How much drug is needed to produce 50% of its maximum effect
- Measured by: EC50 (effective concentration at 50%) or ED50 (effective dose at 50%)
- Rule: Curve to the LEFT = more potent (needs less drug)
- In the graph: Drug B is most potent (leftmost curve), Drug C is least potent (rightmost)
- Memory trick: Potency = "Price per tablet" - a more potent drug means a smaller tablet dose
2. EFFICACY (Emax)
- Definition: The MAXIMUM response a drug can produce - the ceiling of the curve
- Rule: Taller curve = greater efficacy
- In the graph: Drugs A, C, D all have the same (high) Emax. Drug B (partial agonist) has lower Emax
- Memory trick: Efficacy = "Effectiveness" - can morphine relieve cancer pain? Yes. Can aspirin? No. So morphine has greater efficacy.
KEY DISTINCTION (most exam-tested point):
| Potency | Efficacy | |
|---|---|---|
| What it measures | Dose needed | Max response possible |
| Clinically important? | Less so | YES - more important |
| Example | Candesartan (4-32mg) is more potent than irbesartan (75-300mg) | Morphine has greater efficacy than NSAIDs for pain |
| Partial agonist | Can be HIGH potency | Always LOW efficacy |
STEP 4 - Quantal Dose-Response Curve
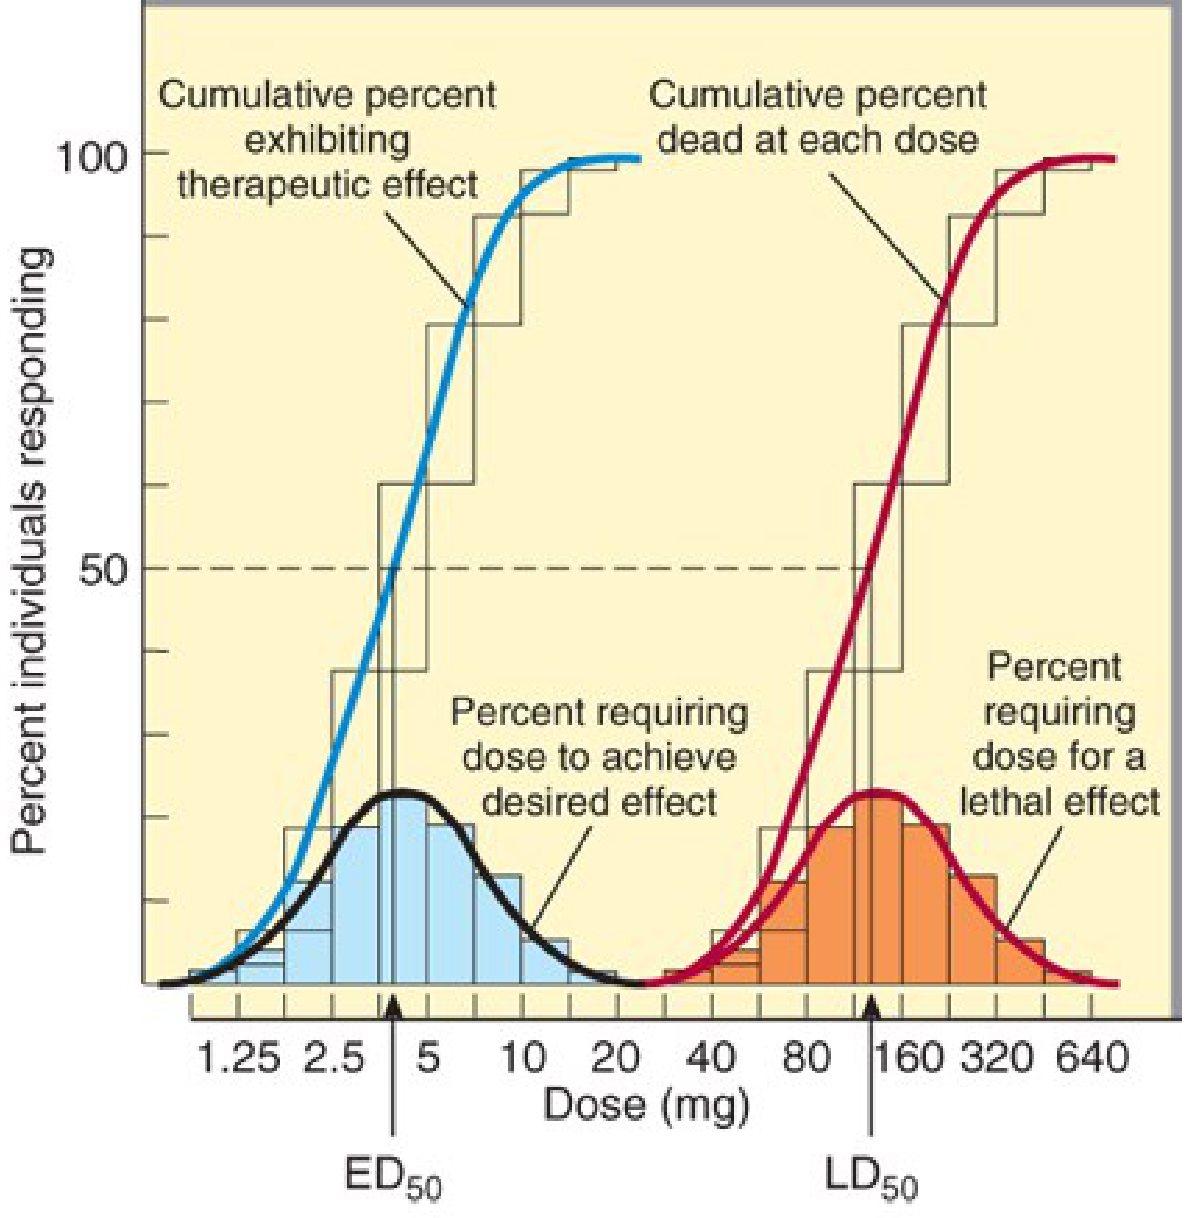
Katzung Fig 2-16: Quantal dose-effect plots showing ED50 and LD50
Reading this graph - key terms:
| Term | Definition | Memory |
|---|---|---|
| ED50 | Dose effective in 50% of population | "Effective Dose" |
| TD50 | Dose toxic in 50% of population | "Toxic Dose" |
| LD50 | Dose lethal in 50% of population | "Lethal Dose" |
| Therapeutic Index (TI) | LD50 / ED50 | "Safety ratio" |
| Margin of Safety | LD1 / ED99 | Stricter safety measure |
| Therapeutic Window | Range between min effective dose and min toxic dose | "Safe working range" |
Therapeutic Index - the core exam formula:
TI = LD50 / ED50

High TI (e.g., 1000) = SAFE drug (e.g., penicillin)
Low TI (e.g., 2-3)   = DANGEROUS drug (e.g., digoxin, lithium, warfarin, phenytoin)
Low TI drugs to memorize for exams:
Digoxin, Lithium, Warfarin, Phenytoin, Theophylline, Aminoglycosides, Cyclosporine
STEP 5 - Quick Comparison Summary
| Feature | Graded Curve | Quantal Curve |
|---|---|---|
| Measures | Potency & Efficacy | TI, ED50, LD50 |
| Sigmoid on log plot? | Yes | Yes |
| Individual or population | Individual | Population |
| Y-axis | % of maximal effect | % of individuals responding |
| Clinical use | Choose drug & dose | Assess drug safety |
STEP 6 - One-Para Exam Answer Template
The dose-response relationship shows that as the dose of a drug increases, the pharmacologic effect increases in a graded fashion in a single individual (graded D-R curve), or the proportion of a population responding increases (quantal D-R curve). From the graded curve, potency (EC50) and efficacy (Emax) are derived. From the quantal curve, ED50, LD50, and the therapeutic index (TI = LD50/ED50) are calculated. A high TI indicates a safer drug. The therapeutic window represents the clinically useful dose range with acceptable efficacy and minimal toxicity.
Sources: Katzung's Basic and Clinical Pharmacology (16th ed.), pp. 64-66; Goodman & Gilman's Pharmacological Basis of Therapeutics, p. 72-73
This is a shared conversation. Sign in to Orris to start your own chat.