
O2 dissosiation curve short notes
Reading File
Now let me search the medical library for O2 dissociation curve content and also search for relevant images in parallel.
Finding Sources
Finding Sources
Excellent results. Now let me read the primary sources - Fishman's (dedicated section), Guyton (BPG/shifts), and Lippincott Biochemistry (sigmoidal curve significance) in parallel.
Reading File
Reading File
Reading File
Now let me fetch the key images and also read the Lippincott section on 2,3-BPG effects in parallel.
Loading Image
Loading Image
Reading File
I have excellent content and two high-quality diagrams. Let me now compile the comprehensive short notes.
O₂ Dissociation Curve - Short Notes
Definition
The oxygen dissociation curve (ODC) represents the relationship between the partial pressure of oxygen (PO₂) and the percentage saturation of hemoglobin (Hb) with oxygen. It describes how readily hemoglobin picks up or releases O₂ under different physiological conditions.
Shape of the Curve
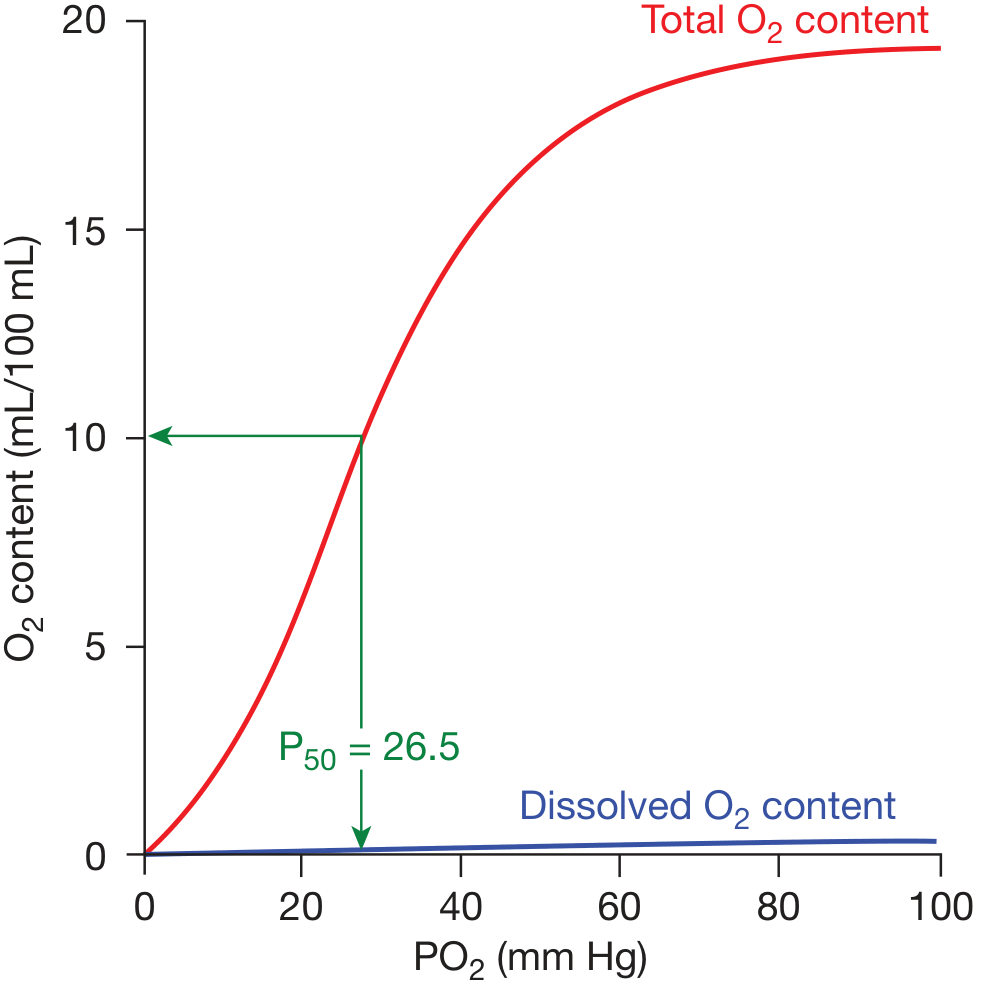
The ODC is sigmoid (S-shaped), not hyperbolic. This shape arises from the cooperative binding of O₂ to hemoglobin's four subunits:
- Binding of O₂ to one heme group causes a conformational change (T-form → R-form) that increases the affinity of the remaining heme groups for O₂.
- The net result: affinity for the last O₂ bound is ~300× greater than for the first.
- In contrast, myoglobin (monomeric) has a hyperbolic curve and maximum affinity throughout - it cannot efficiently deliver O₂ to tissues.
(Lippincott Illustrated Reviews Biochemistry, 8th ed)
Standard Conditions
The curve is plotted at: pH 7.40, temperature 37°C, atmospheric pressure 760 mmHg.
| Point on curve | PO₂ (mmHg) | SpO₂ (%) | Notes |
|---|---|---|---|
| Lung (arterial) | 95-100 | ~97% | Hb nearly fully saturated |
| Mixed venous (rest) | ~40 | ~75% | Only 25% O₂ extracted at rest |
| P₅₀ (half-saturation) | 26.5 | 50% | Standard reference point |
(Fishman's Pulmonary Diseases and Disorders)
Physiological Significance of the S-Shape
Upper flat portion (PO₂ 60-100 mmHg):
- Hb remains highly saturated even when arterial PO₂ drops (e.g., lung disease, altitude).
- As long as PO₂ ≥ 60 mmHg, O₂ content stays near-normal - this is the "safety plateau."
Steep middle portion (PO₂ 20-60 mmHg):
- Small drops in PO₂ release large amounts of O₂ to tissues.
- This facilitates efficient O₂ unloading at the tissue capillary level.
Shifts of the ODC
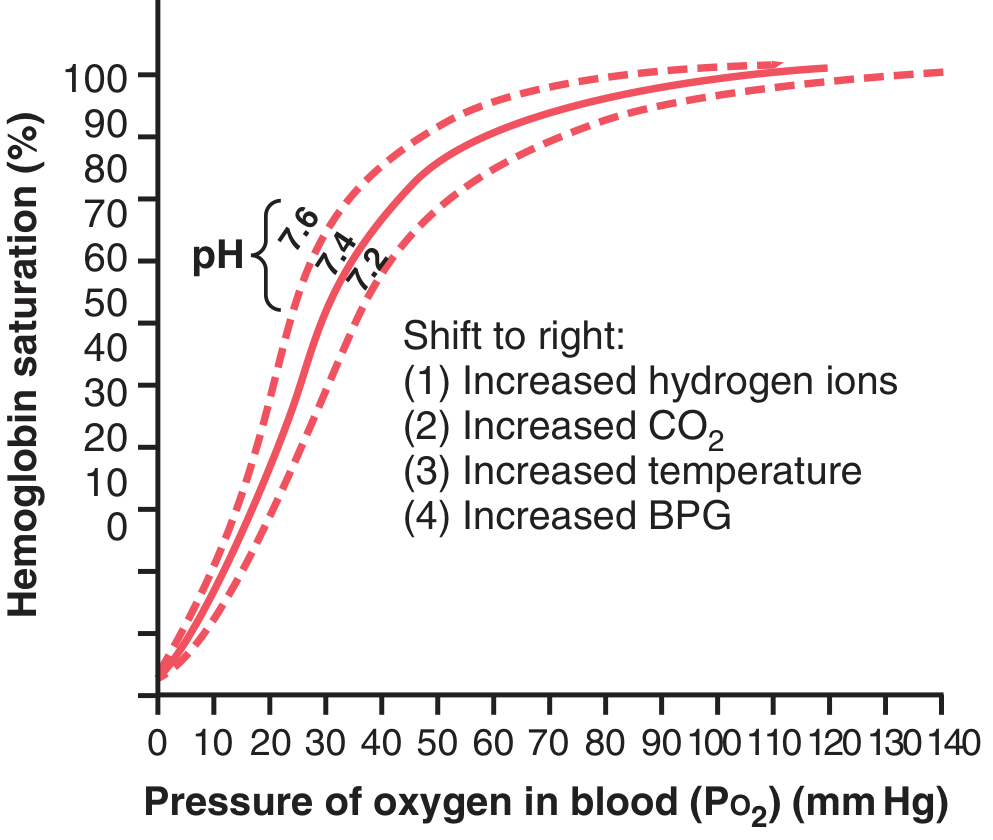
Right Shift (↑ P₅₀, decreased O₂ affinity → more O₂ released to tissues)
| Cause | Mechanism |
|---|---|
| ↑ H⁺ (↓ pH) | Bohr effect - protonation stabilizes deoxy-Hb |
| ↑ CO₂ | Direct + via H⁺ production |
| ↑ Temperature | Favors T-form (deoxy) |
| ↑ 2,3-BPG | Binds deoxy-Hb, lowers O₂ affinity |
Mnemonic: CADET - CO₂, Acidosis (↓pH), DPG (2,3-BPG), Exercise, Temperature↑
Right shift is adaptive in: exercise, fever, anemia, high altitude (chronic), hypoxia.
Left Shift (↓ P₅₀, increased O₂ affinity → Hb holds O₂ tighter, less released)
| Cause | Notes |
|---|---|
| ↓ H⁺ (↑ pH / alkalosis) | Stabilizes oxy-Hb (R-form) |
| ↓ CO₂ | e.g., hyperventilation |
| ↓ Temperature | Hypothermia |
| ↓ 2,3-BPG | Stored blood |
| Fetal Hb (HbF) | HbF binds 2,3-BPG poorly → left shift → picks up O₂ from maternal Hb |
| CO poisoning | Carboxyhemoglobin - high affinity, no O₂ release |
| Methemoglobin | Fe³⁺ form, cannot carry O₂ |
(Guyton & Hall, Lippincott Biochemistry)
The Bohr Effect
When tissues metabolize actively:
- CO₂ diffuses into blood → forms H₂CO₃ → releases H⁺
- ↑ H⁺ protonates histidine residues on Hb → forms salt bridges → stabilizes deoxy-Hb (T-form)
- Reaction: HbO₂ + H⁺ ⇌ HbH + O₂
In the lungs, the reverse occurs: CO₂ diffuses out, pH rises, curve shifts left → facilitates O₂ loading.
This differential is a key physiological mechanism for matching O₂ delivery to metabolic demand.
2,3-BPG (Bisphosphoglycerate)
- Synthesized from 3-phosphoglycerate in the Rapoport-Luebering shunt (a side pathway of glycolysis in RBCs).
- Binds to the central cavity of deoxy-Hb (between the β-subunits), stabilizing the T-form.
- Normal 2,3-BPG keeps the curve shifted slightly right (P₅₀ ~26.5 vs 19 mmHg in its absence).
- Chronic hypoxia → ↑ 2,3-BPG synthesis → further right shift → improves O₂ delivery.
- Stored blood (bank blood): 2,3-BPG depletes within days → left shift → impaired O₂ release.
(Guyton & Hall; Lippincott Biochemistry, 8th ed)
Special Situations
| Condition | Shift | Reason |
|---|---|---|
| High altitude (acute) | Right (mild) | ↑ ventilation → ↑ CO₂ expiration → left initially, but ↑ 2,3-BPG later |
| High altitude (chronic) | Right | ↑ 2,3-BPG predominates |
| Exercise | Right | ↑ CO₂, ↑ H⁺, ↑ temperature, ↑ 2,3-BPG |
| Fetal circulation | Left (HbF) | HbF has γ-chains instead of β → binds 2,3-BPG poorly |
| Carbon monoxide poisoning | Left | CO binds Hb 250× more avidly than O₂ |
| Hypothyroidism/hypothermia | Left | Reduced metabolism |
Key Values to Remember
- P₅₀ (normal): 26.5 mmHg
- At PO₂ = 100 mmHg (arterial): ~97% saturation
- At PO₂ = 40 mmHg (venous rest): ~75% saturation
- At PO₂ = 60 mmHg: ~90% saturation (the critical threshold - below this, saturation drops sharply)
- Each gram of Hb can carry 1.34 mL O₂ when fully saturated (Hüfner's constant)
Summary Table: Factors Affecting ODC
| Factor | Right Shift (↑P₅₀) | Left Shift (↓P₅₀) |
|---|---|---|
| pH | ↓ pH (acidosis) | ↑ pH (alkalosis) |
| CO₂ | ↑ PaCO₂ | ↓ PaCO₂ |
| Temperature | ↑ Temp | ↓ Temp |
| 2,3-BPG | ↑ 2,3-BPG | ↓ 2,3-BPG |
| Hb type | Adult HbA | Fetal HbF, HbH, CO-Hb |
Sources: Fishman's Pulmonary Diseases and Disorders | Guyton & Hall Medical Physiology | Lippincott Illustrated Reviews Biochemistry, 8th ed
Refered pain very short notes easy word
Finding Sources
Finding Sources
Reading File
Reading File
Reading File
Loading Image
Loading Image
I have all the content and diagrams needed. Here are the short notes:
Referred Pain - Short Notes
What is it?
Pain felt at a place far from where the actual problem is.
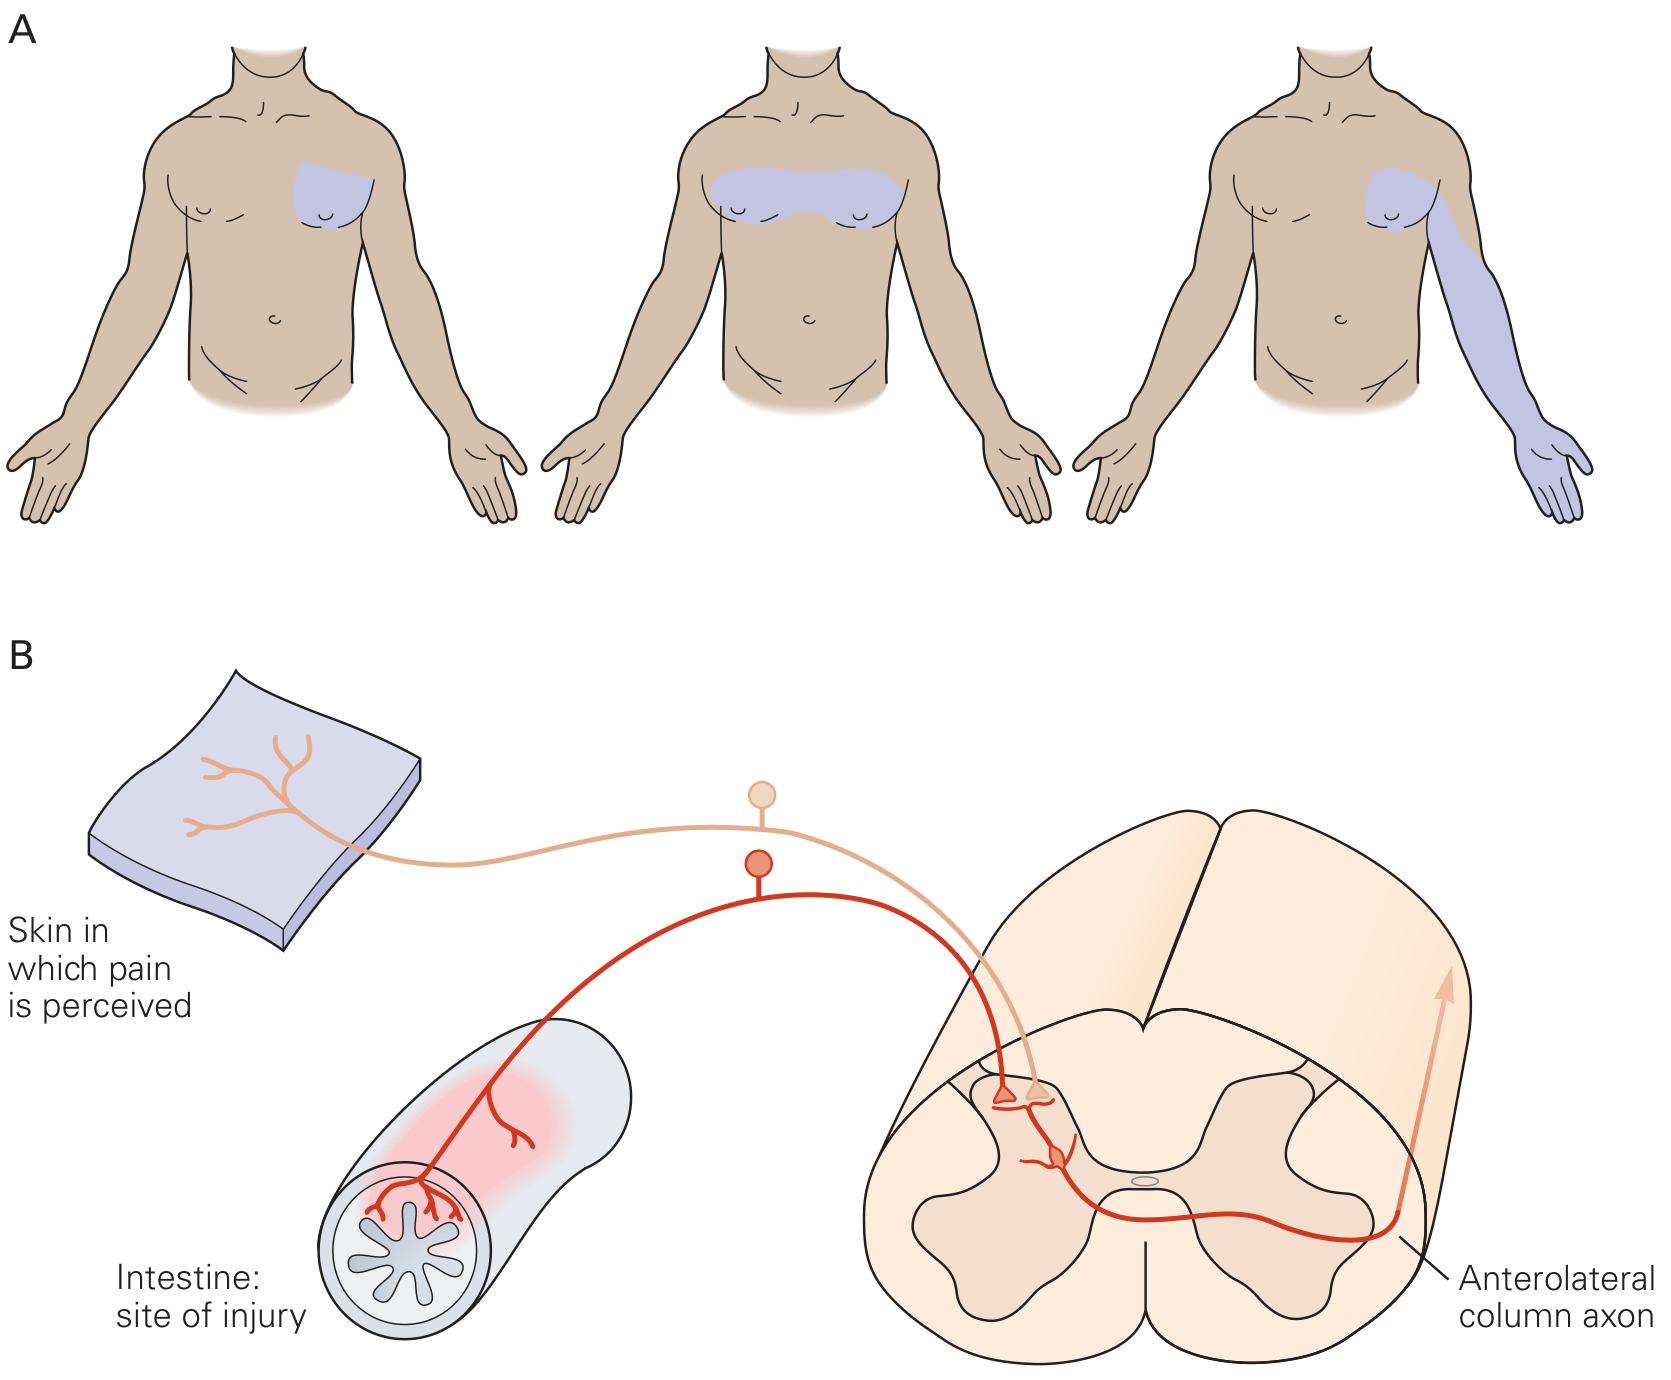
Example: Heart attack → pain felt in left arm and jaw (not just the chest).
Why does it happen? (Mechanism)
Convergence Theory - the most accepted explanation:
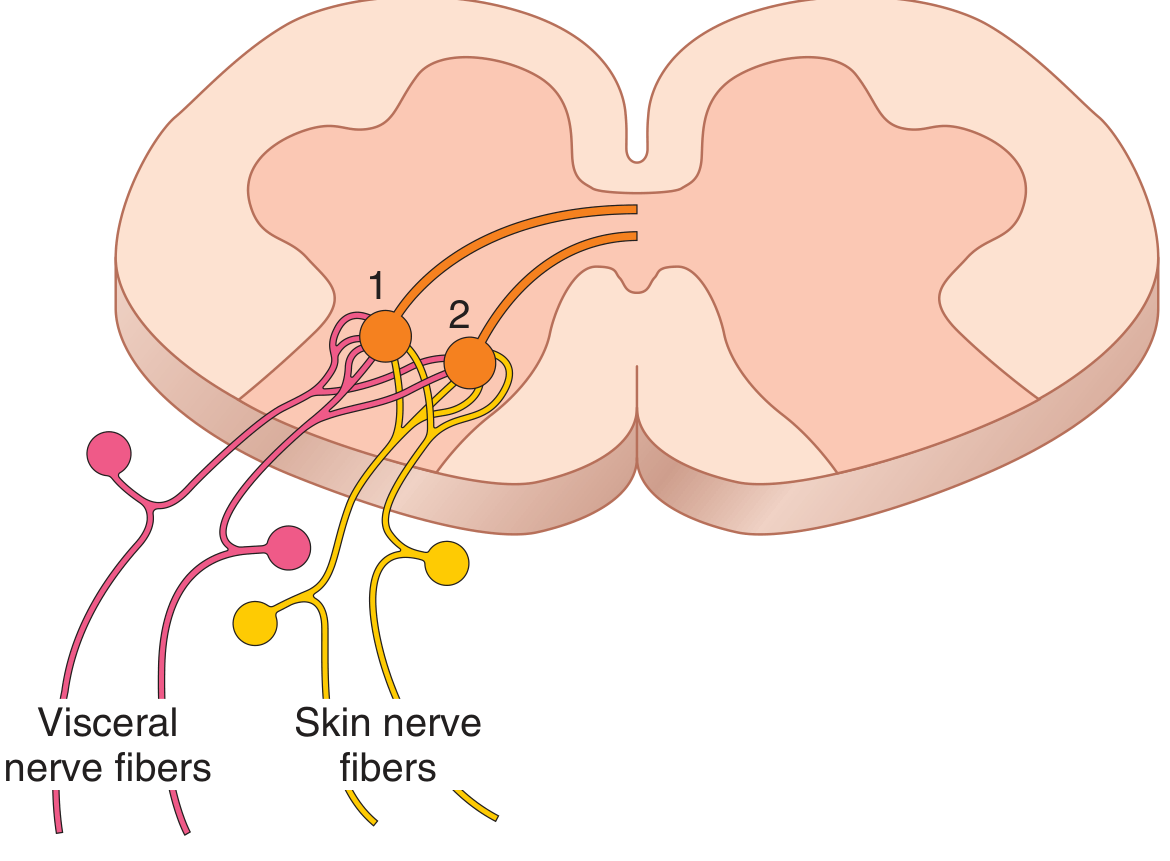
- Visceral (organ) pain fibers and skin pain fibers share the same second-order neurons in the spinal cord dorsal horn.
- The brain cannot tell where the pain really came from - it assumes the pain is from the skin (because skin sends pain signals more often than organs).
- So organ pain gets misread as skin pain at the same spinal level.
(Guyton & Hall Medical Physiology)
(Kandel - Principles of Neural Science, 6th ed)
Simple Rule
Pain is referred from organ (visceral) → to skin (somatic) at the same spinal cord level
Classic Examples (Must Know)
| Organ with Problem | Where Pain is Felt |
|---|---|
| Heart (MI / Angina) | Left arm, jaw, neck, chest |
| Diaphragm (irritation) | Tip of shoulder (C3-C5 via phrenic nerve) |
| Appendix (early) | Umbilical region (T10 dermatome) |
| Gallbladder | Right shoulder / right scapula |
| Kidney / Ureter stone | Groin / testis / inner thigh |
| Pancreas | Back (between shoulder blades) |
| Hip joint disease | Medial knee (via obturator nerve) |
Appendicitis - Classic Teaching Example
Early stage:
- Appendix inflames → visceral fibers → enter spinal cord at T10
- Pain felt at umbilicus (T10 dermatome)
- Pain is diffuse, colicky (comes and goes with peristalsis)
Late stage:
- Appendix touches parietal peritoneum in right iliac fossa
- Now somatic fibers activated → pain shifts to right lower quadrant
- Pain becomes constant and localized
(Gray's Anatomy for Students)
Key Points
- Referred pain is clinically very important - in many organ diseases, it may be the only sign
- Pain travels via slow C fibers (dull, aching type)
- The brain has no "map" for visceral pain, so it uses the skin map instead
- Hyperalgesia (extra sensitivity) can also be referred to the same skin area
Memory Aid
"GALL-HEART-APP-DIA-KID"
| Letter | Organ | Pain felt at |
|---|---|---|
| G | Gallbladder | Right shoulder |
| H | Heart | Left arm/jaw |
| A | Appendix (early) | Umbilicus |
| D | Diaphragm | Shoulder tip |
| K | Kidney/Ureter | Groin/testis |
Sources: Guyton & Hall Medical Physiology | Gray's Anatomy for Students | Kandel Principles of Neural Science, 6th ed
This is a shared conversation. Sign in to Orris to start your own chat.