Explain about confounders
Reading File
Searching the Web
confounders in epidemiology research methods explained
Finding Sources
Finding Sources
Reading File
Reading File
Finding Sources
Reading File
Here is a thorough explanation of confounders, drawn from multiple medical textbooks and epidemiology sources:
Confounders in Research & Epidemiology
Definition
A confounder (confounding variable) is a variable that is associated with both the exposure (risk factor) and the outcome (disease), and is unequally distributed between the groups being compared. It can either create a false apparent association, or mask a true one.
"A confounder is a factor that is associated with the outcome (e.g., disease) and the exposure. The confounder may account for the apparent effect of the exposure on the disease or mask a true association."
- Berek & Novak's Gynecology
The 3 Criteria for a Confounder
For a variable to qualify as a confounder, it must meet all three of the following conditions:
| Criterion | Description |
|---|---|
| 1. Associated with the exposure | The variable must be linked to the exposure being studied |
| 2. Associated with the outcome | The variable must independently affect (or predict) the disease/outcome |
| 3. Not on the causal pathway | The variable must NOT be an intermediate step between exposure and outcome - it should be an external factor |
If a variable is on the causal pathway (a mediator), it is NOT a confounder - adjusting for it would actually remove the true effect you are trying to measure.
Classic Examples
Example 1: Obesity and Heart Disease
- Exposure: Obesity
- Outcome: Heart disease
- Confounder: Age
- Age is related to both obesity (older people tend to be more obese) and heart disease (older people have more heart disease). If the obese group is older, the observed association between obesity and heart disease may partly reflect the effect of age, not obesity alone.
- Goldman-Cecil Medicine
Example 2: Ice Cream Sales and Violence (famous teaching example)
- Exposure: Ice cream sales
- Outcome: Violence/crime rates
- Confounder: Hot weather
- Hot weather causes both increased ice cream sales AND increased outdoor activity/irritability leading to more violent incidents. Ice cream does not cause violence - hot weather is the confounder.
- The Harriet Lane Handbook
Example 3: Foot Size and Reading Ability (in children)
- Exposure: Large foot size
- Outcome: Better reading ability
- Confounder: Age/grade level
- Older children have bigger feet AND better reading skills. Grade level confounds the apparent relationship.
Types of Confounding
| Type | Description |
|---|---|
| Positive confounding | Confounder inflates the apparent association (makes it look stronger than it is) |
| Negative confounding | Confounder suppresses the true association (makes it look weaker or non-existent) |
| Residual confounding | Confounding that remains even after adjustment, due to imprecise measurement or unmeasured variables |
Confounders vs. Effect Modifiers
These two are often confused but are fundamentally different:
| Feature | Confounder | Effect Modifier (Interaction) |
|---|---|---|
| Role | Distorts the exposure-outcome association | Changes the magnitude of the association in different subgroups |
| Goal | Should be controlled/removed | Should be reported and described |
| Example | Age in obesity-heart disease study | Sex in a drug trial (drug works in females but not males) |
| Management | Adjustment, stratification, randomization | Stratification to present separate estimates |
- The Harriet Lane Handbook: "An effect modifier is a variable that modifies the observed effect of an exposure on disease. Can be controlled for by stratification."
How to Control for Confounding
At the Design Stage
- Randomization - The best method. Random assignment of subjects to exposure groups ensures known AND unknown confounders are equally distributed between groups. This is why RCTs are the gold standard.
- Restriction - Limit the study to a narrow range of the confounder (e.g., only study men aged 40-50). Eliminates confounding but limits generalizability.
- Matching - Match each case to a control with the same value of the potential confounder (e.g., match by age and sex). Common in case-control studies.
At the Analysis Stage
- Stratification - Analyze the exposure-outcome relationship separately within each stratum (subgroup) of the confounder. Produces stratum-specific estimates.
- Multivariable analysis (regression) - Simultaneously adjust for multiple confounders using logistic regression, Cox regression, etc. Produces an adjusted odds ratio (OR) or relative risk (RR) that reflects the exposure-outcome association after accounting for the confounders included in the model.
- Propensity score analysis - The probability of receiving the exposure is calculated based on subject characteristics. Used to balance groups in observational studies.
"A propensity score is the probability that a study subject would receive the exposure or treatment of interest, based on the subject's characteristics and the clinical environment. Using the propensity score, it is possible to adjust for the effect of known confounding variables."
- Goldman-Cecil Medicine
Important limitation: "All techniques to reduce confounding depend entirely on data about relevant covariates. If such data are missing, statistical adjustment cannot produce an accurate result." Statistical methods can only control for known and measured confounders. Unknown or unmeasured confounders remain a persistent threat in observational studies.
Directed Acyclic Graphs (DAGs)
DAGs are visual tools used to map the relationships between exposure, outcome, and potential confounders. They help researchers:
-
Identify which variables are true confounders
-
Distinguish confounders from mediators and colliders
-
Decide which variables to adjust for in analysis
-
The Harriet Lane Handbook: "Directed acyclic graphs (DAGs) can be drawn to help assessment for confounders, effect modifiers, colliders, and other biases."
Colliders: A Special Case
A collider is a variable caused by both the exposure and the outcome. Unlike confounders, adjusting for a collider actually introduces bias rather than removing it - this is called collider bias or Berkson's bias.
Why Confounding Matters
- Confounding is the primary reason why observational studies (cohort, case-control, cross-sectional) can be misleading
- It is why an RCT result is considered stronger evidence than an observational study
- Failure to account for confounders can lead to incorrect clinical conclusions, flawed drug approvals, or misguided public health policies
- In observational studies, it is seldom safe to assume that pre-exposure factors are equally distributed between exposure groups - NCBI Bookshelf on confounding bias
Quick Summary
Confounder = associated with BOTH exposure AND outcome + NOT on causal pathway

Control methods:
  Design stage  → Randomization > Restriction > Matching
  Analysis stage → Stratification > Multivariable regression > Propensity score

Remember: You can only adjust for confounders you KNOW about and MEASURE.
Sources: Goldman-Cecil Medicine | Berek & Novak's Gynecology | The Harriet Lane Handbook | NCBI Bookshelf (Statistical Methods in Cancer Research)
Meta analysis
Finding Sources
Searching the Web
meta-analysis methodology forest plot heterogeneity explained
Reading File
Reading File
Reading File
Reading File
Reading File
Loading Image
Here is a thorough explanation of meta-analysis, drawing from Harrison's, Goldman-Cecil, Creasy & Resnik's, and Tietz Laboratory Medicine:
Meta-Analysis
Definition
A meta-analysis is a statistical method for combining and quantitatively summarizing the results of multiple independent studies that address the same clinical question. It produces a single pooled estimate (with confidence interval) that is more precise than any individual study alone.
"Meta-analysis is a statistical method for drawing inferences from a sample of studies to derive a summary estimate and confidence interval for a parameter measured by the included studies. It allows for a formal combination of results while estimating and accommodating both the within-study and between-study variations."
- Goldman-Cecil Medicine
Systematic Review vs. Meta-Analysis
These two terms are related but distinct - this distinction is frequently tested:
| Feature | Systematic Review | Meta-Analysis |
|---|---|---|
| Nature | Qualitative/quantitative synthesis of literature | Statistical procedure (quantitative only) |
| Question | "What does the evidence show?" | "What is the pooled effect size?" |
| Includes | Identifies, selects, and critically appraises studies | Mathematically combines study results |
| Relationship | Does NOT always include a meta-analysis | ALWAYS includes a systematic review |
"A systematic review is a scientific investigation that focuses on a specific question and uses explicit, planned methods to identify, select, assess, and summarize the findings of similar but separate studies. A meta-analysis is the process of using statistical methods to quantitatively combine the results of similar studies... Thus a meta-analysis includes a systematic review, but a systematic review does not necessarily include a meta-analysis."
- Creasy & Resnik's Maternal-Fetal Medicine
Defining Features of a Systematic Review (the foundation)
Per Tietz Textbook of Laboratory Medicine, a systematic review must have:
- A clear clinical question to be addressed
- An extensive, explicit search strategy to find all eligible studies (published and unpublished)
- Explicit inclusion/exclusion criteria for studies
- A mechanism to assess risk of bias in each study
- (Sometimes) statistical synthesis via meta-analysis
Why Meta-Analysis is Valuable
- Increases statistical power - by pooling data from many small studies, it can detect effects that no single trial could find on its own
- Improves precision - the pooled confidence interval is narrower than individual study CIs
- Resolves conflicting results - when individual trials disagree, meta-analysis provides an overall estimate
- Detects subgroup effects - stratified analyses can reveal who benefits most
"Meta-analysis can especially help detect benefits when individual trials are inadequately powered. For example, the benefits of streptokinase thrombolytic therapy in acute MI demonstrated by ISIS-2 in 1988 were evident by the early 1970s through meta-analysis."
- Harrison's Principles of Internal Medicine (22e)
The Forest Plot - Reading It
The forest plot is the signature visual output of a meta-analysis. Here is a real example from the Cochrane Database, showing the effect of antibiotics on neonatal infection in preterm premature rupture of membranes:
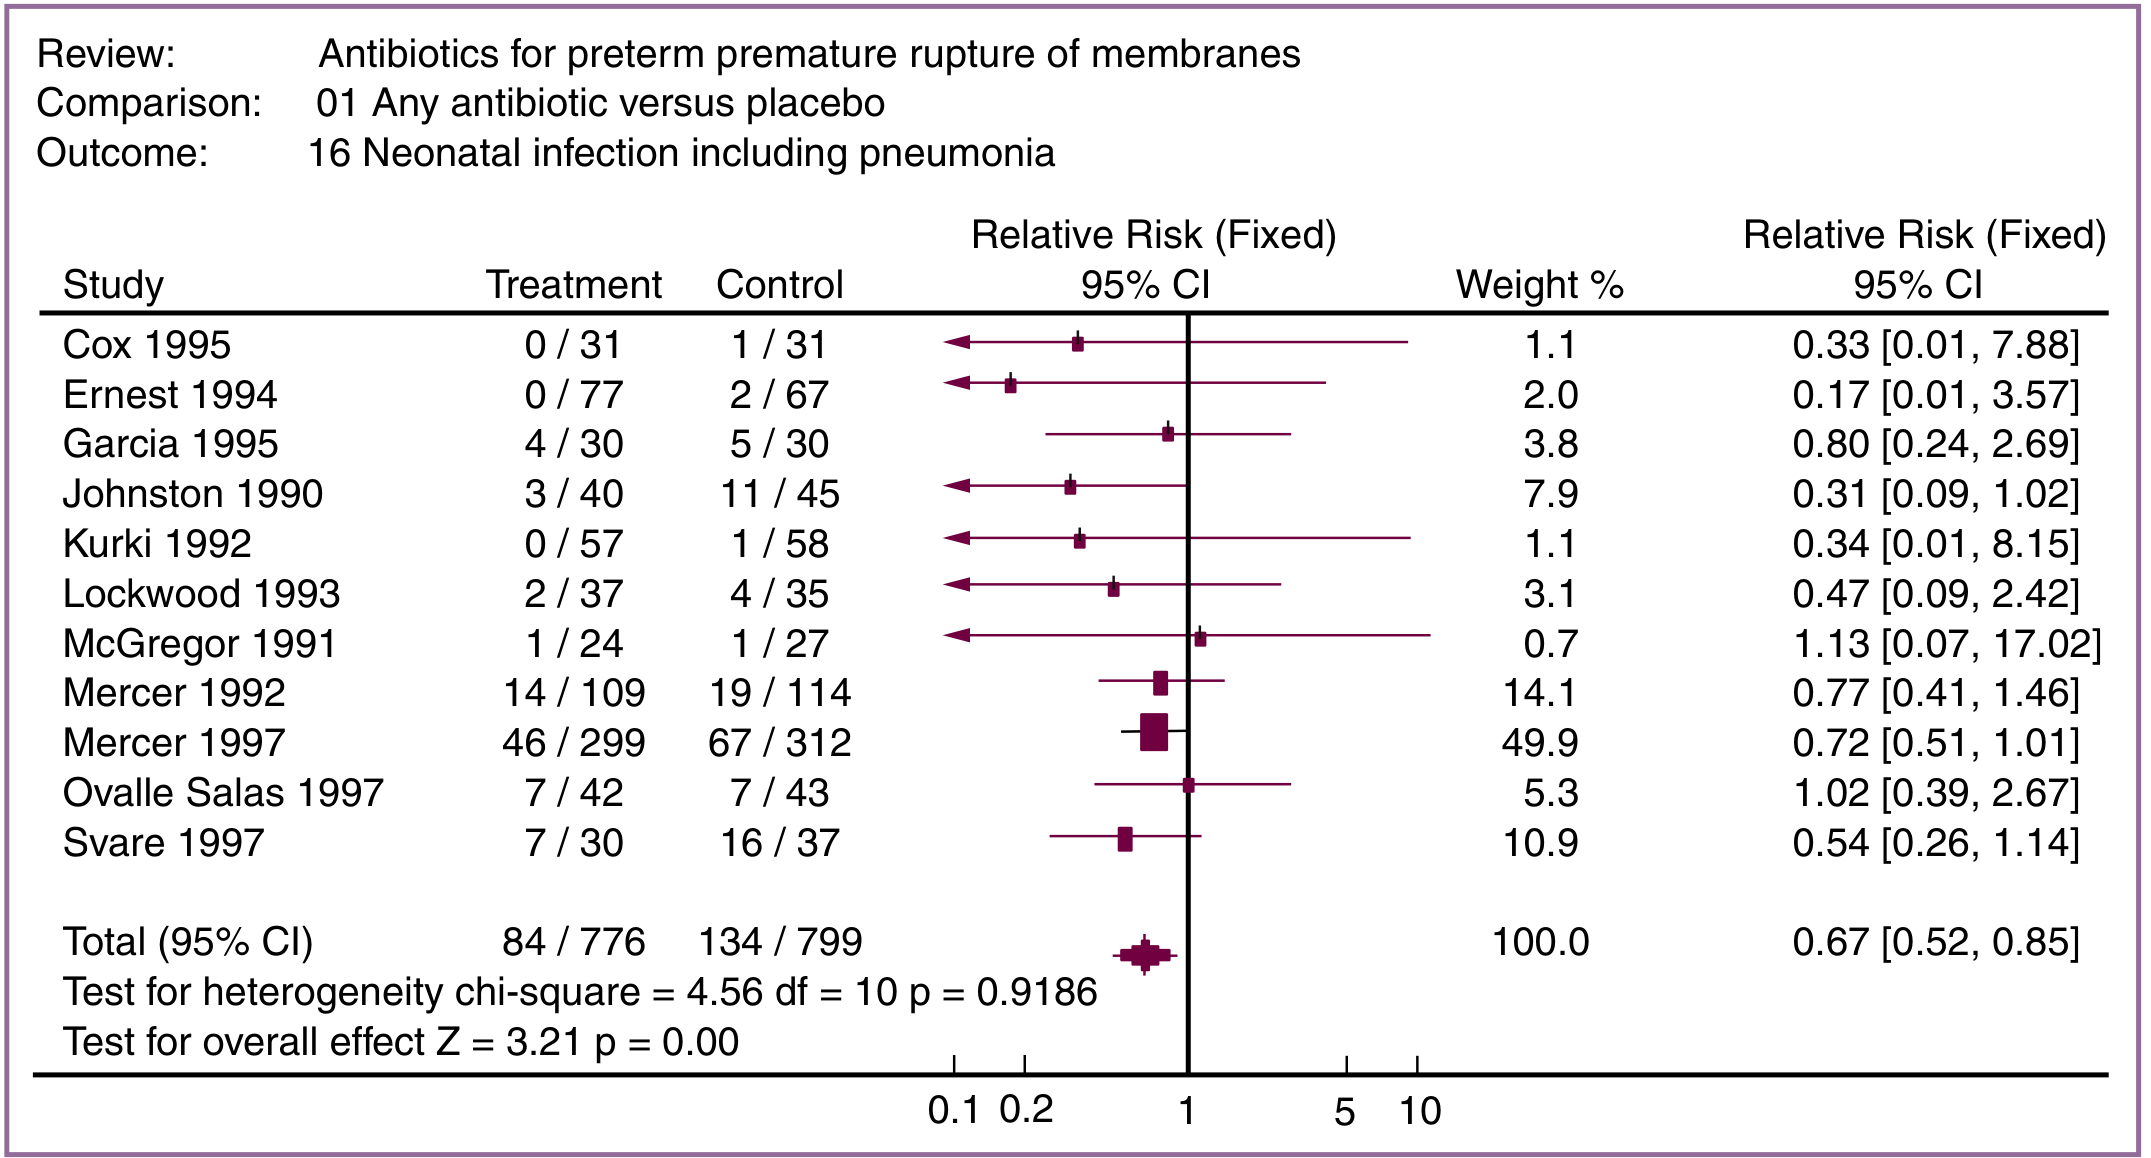
How to read a forest plot:
| Element | Meaning |
|---|---|
| Each horizontal line | One individual study; the line = 95% confidence interval |
| Square/box on each line | Point estimate (odds ratio, relative risk) for that study |
| Size of the square | Proportional to the study's weight in the analysis |
| Vertical line at 1.0 | The "line of no effect" (for RR/OR) or zero (for mean difference) |
| Diamond at the bottom | The pooled estimate across all studies; its width = 95% CI |
| CI crosses the line of no effect | Result is NOT statistically significant |
| CI does not cross the line of no effect | Result IS statistically significant |
In the example above:
- Each of 11 small trials showed a non-significant trend toward benefit for antibiotics
- Pooled RR = 0.67 (95% CI: 0.52 to 0.85) - meaning antibiotics reduced neonatal infection by 33%, and the CI does not cross 1.0, so this IS statistically significant
Statistical Models: Fixed vs. Random Effects
| Model | Assumption | When to Use |
|---|---|---|
| Fixed effect | All studies are estimating the exact same underlying effect; variation is only due to random sampling error | Studies are highly similar (homogeneous); low heterogeneity |
| Random effects | Studies may differ slightly in their true effects due to clinical or methodological variation | Studies are heterogeneous; more conservative (wider CIs) |
"Fixed effect meta-analysis assumes that all available studies have estimated the same statistic... Random effects meta-analysis assumes that there may be many small differences between the different studies, and that it is not justified to assume that the effect is the same in every study."
- Tietz Textbook of Laboratory Medicine
Heterogeneity - The Key Challenge
Heterogeneity refers to variability in results across included studies. It is the central challenge of meta-analysis - "mixing apples and oranges."
Types:
- Clinical heterogeneity: Differences in patient populations, interventions, or outcome definitions
- Methodological heterogeneity: Differences in study design or risk of bias
- Statistical heterogeneity: Variation in results greater than expected by chance alone
Measuring heterogeneity:
| Statistic | How to Interpret |
|---|---|
| Cochran's Q test | Chi-square test for heterogeneity; p < 0.10 suggests significant heterogeneity |
| I² statistic | Percentage of variability due to true heterogeneity (not chance): 0-25% = low, 25-50% = moderate, >75% = high |
"Although there are statistical tools for taking heterogeneity into account (i.e., random effects models), it is incumbent on the reader to make such a determination."
- Creasy & Resnik's Maternal-Fetal Medicine
Publication Bias
Publication bias occurs when studies with positive (significant) results are more likely to be published than those with null or negative results. This inflates the apparent treatment benefit in a meta-analysis.
- Detection: The funnel plot - a scatter plot of effect size vs. study precision. If asymmetrical (missing studies in one corner), publication bias is likely.
- Prevention: Meta-analyses should actively seek unpublished "negative" trials (grey literature, trial registries)
"Ideally, unpublished trials should be identified and included to avoid publication bias (i.e., missing 'negative' trials that may not be published)."
- Harrison's Principles of Internal Medicine
Summary Measures Reported
Meta-analyses typically report:
- Pooled Relative Risk (RR) or Odds Ratio (OR) with 95% CI
- Absolute Risk Reduction (ARR)
- Number Needed to Treat (NNT) = 1/ARR - how many patients need treatment to prevent one outcome event
Limitations of Meta-Analysis
| Limitation | Explanation |
|---|---|
| Garbage in, garbage out | Pooling small, poorly-done trials does not yield reliable evidence |
| Heterogeneity | Combining dissimilar studies can be misleading |
| Publication bias | Selective publication skews pooled estimates |
| Single large RCT may be stronger | A well-performed single large RCT in a generalizable population can outrank a meta-analysis of heterogeneous smaller studies |
| Individual patient data (IPD) not always available | Best meta-analyses use IPD, but most rely only on published summary statistics |
Quality Reporting Standards
- PRISMA (Preferred Reporting Items for Systematic Reviews and Meta-Analyses) - the guideline for transparently reporting meta-analyses, subscribed to by NEJM, Lancet, JAMA
- CONSORT - equivalent standard for individual RCTs
- Cochrane Library - produces high-quality systematic reviews and meta-analyses across medical topics
Position in the Evidence Hierarchy
Systematic Reviews & Meta-Analyses (highest level of evidence)
         ↑
Randomized Controlled Trials (RCTs)
         ↑
Cohort Studies
         ↑
Case-Control Studies
         ↑
Case Series / Expert Opinion (lowest)
Sources: Harrison's Principles of Internal Medicine (22e) | Goldman-Cecil Medicine | Creasy & Resnik's Maternal-Fetal Medicine | Tietz Textbook of Laboratory Medicine (7e)
This is a shared conversation. Sign in to Orris to start your own chat.