
Hypersensitivity from basics to clinical
Gell and Coombs hypersensitivity types classification diagram
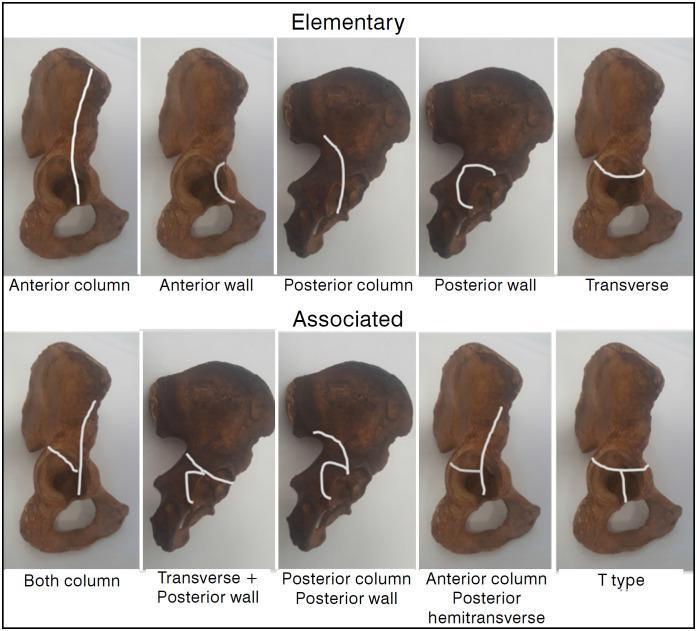
Educational diagram illustrating the Judet-Letournel classification of acetabular fractures using anatomical specimens of the hemipelvis. The visual is divided into two rows: 'Elementary' and 'Associated' fracture types. White lines superimposed on the specimens delineate specific fracture patterns. The 'Elementary' row features five simple patterns: Anterior column (vertical line through the pelvic brim), Anterior wall (localized articular segment), Posterior column (ischiadic notch through obturator foramen), Posterior wall (localized posterior rim), and Transverse (horizontal line bisecting the acetabulum). The 'Associated' row demonstrates complex configurations: Both column, Transverse plus posterior wall, Posterior column plus posterior wall, Anterior column with posterior hemitransverse (a vertical anterior column line joined by a horizontal posterior component), and T-type (a transverse fracture with an additional vertical stem extending through the obturator foramen). This orthopedic diagram serves as a clinical reference for orthopedic surgeons and medical students to understand pelvic trauma morphology and surgical planning.
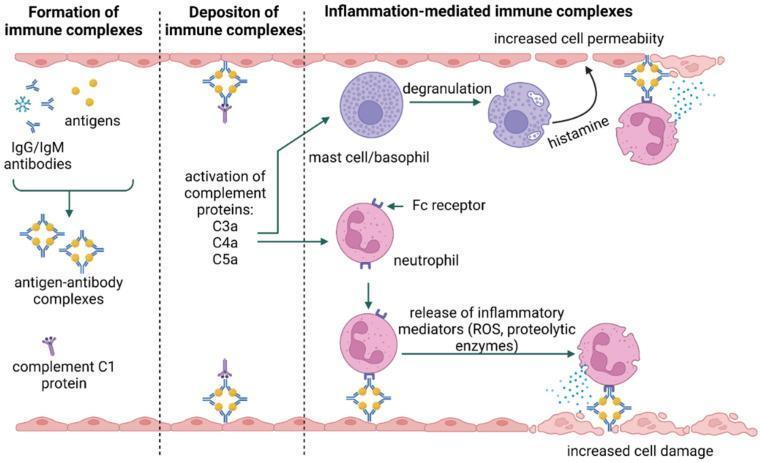
A pathophysiology diagram illustrating the three-stage process of Type III hypersensitivity. The diagram is divided into three vertical panels: 1) Formation of immune complexes, showing soluble antigens and IgG/IgM antibodies combining with complement C1 protein to form antigen-antibody complexes. 2) Deposition of immune complexes, depicting these complexes settling onto the vascular endothelium (basement membrane). 3) Inflammation-mediated immune complexes, detailing the effector phase. This phase shows the activation of anaphylatoxins (C3a, C4a, C5a) which trigger mast cell/basophil degranulation and the release of histamine, leading to increased vascular permeability. Simultaneously, neutrophils are recruited and bind to the deposited complexes via Fc receptors. This binding induces the release of inflammatory mediators, including reactive oxygen species (ROS) and proteolytic enzymes, ultimately causing localized tissue damage and increased cell permeability in the affected area. The illustration uses standardized BioRender icons to represent cells, receptors, and soluble molecules within a clinical immunology context.
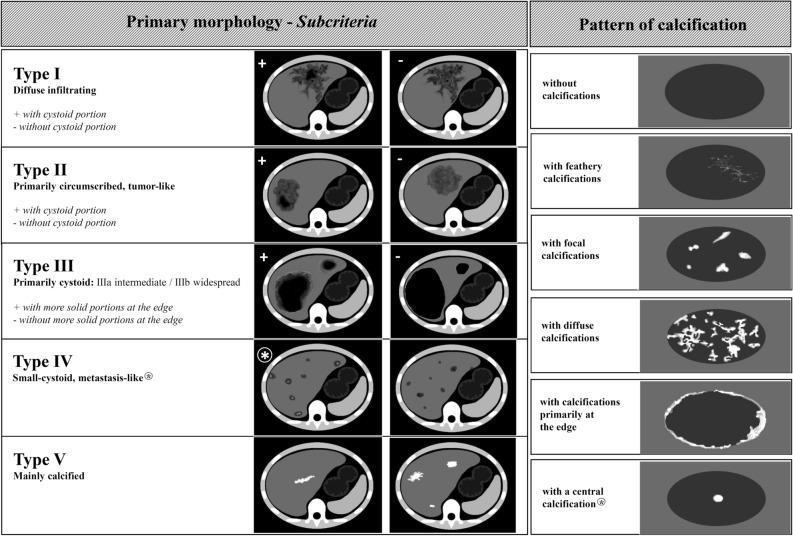
This educational infographic details the Echinococcus multilocularis Ulm Classification for Computed Tomography (EMUC-CT), a standardized system for evaluating hepatic Alveolar Echinococcosis (AE). The diagram is divided into two sections: Primary Morphology and Patterns of Calcification. The left section illustrates five morphological types (I-V) using axial CT cross-sections of the liver. Type I (diffuse infiltrating) and Type II (primarily circumscribed, tumor-like) are sub-categorized by the presence or absence of a cystoid portion. Type III (primarily cystoid) distinguishes between intermediate and widespread involvement, further categorized by solid peripheral portions. Type IV displays small-cystoid, metastasis-like lesions, while Type V represents mainly calcified, inactive lesions. The right panel illustrates six distinct calcification patterns within hepatic lesions: feathery (branching), focal (isolated spots), diffuse (widespread), edge-weighted (peripheral), and central. The classification system is designed to improve diagnostic accuracy and clinical assessment of disease activity in patients with Alveolar Echinococcosis.
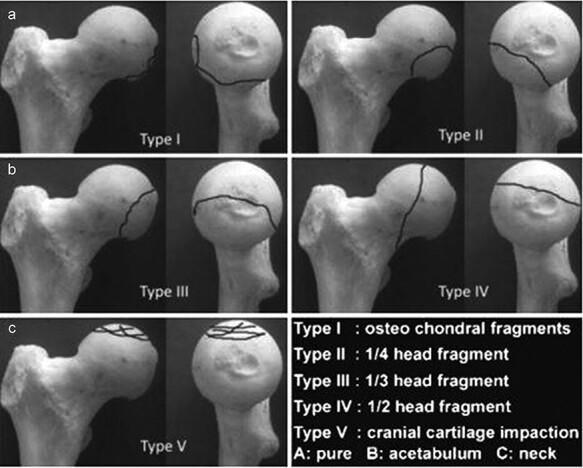
This orthopaedic anatomical diagram illustrates the Chiron classification (2004) for femoral head fractures, shown across five categorized types (Type I to Type V). Each type is presented using a dry bone model of the proximal femur from two perspectives: a lateral/oblique view and a frontal view of the femoral head. Fracture lines are demarcated by solid black lines to indicate the morphology and size of the fracture fragments. Type I displays small osteochondral fragments at the superior-lateral aspect. Type II shows a 1/4 head fragment on the anterior-superior surface. Type III demonstrates a 1/3 head fragment extending from superior to posterior. Type IV depicts a vertical fracture dividing approximately 1/2 of the femoral head. Type V illustrates cranial cartilage impaction with multiple intersecting lines across the superior articular surface. The classification is clinically relevant for orthopedic surgeons and residents for determining the severity of femoral head trauma and informing surgical decisions, such as fragment fixation versus excision based on size and location.
Type I hypersensitivity IgE mast cell degranulation mechanism anaphylaxis
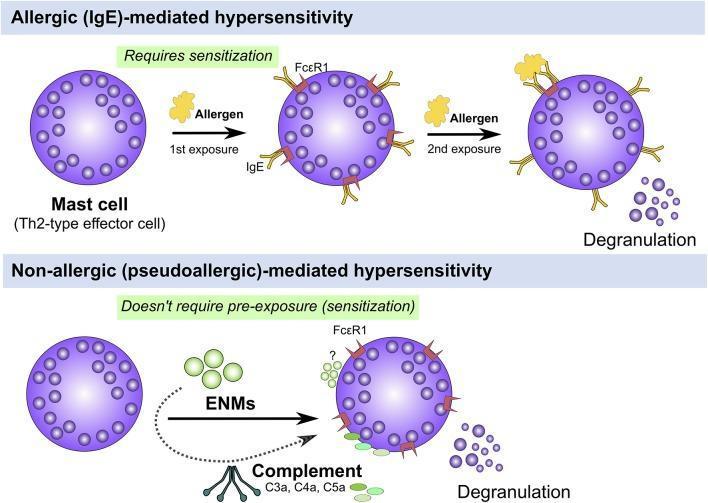
A comparative pathophysiology diagram illustrating two mechanisms of mast cell activation and degranulation in hypersensitivity. The top panel depicts 'Allergic (IgE)-mediated hypersensitivity,' showing a multi-step process: initial sensitization where an allergen exposure leads to IgE antibodies binding to Fć̵R1 receptors on a Th2-type effector mast cell, followed by a second exposure where allergen cross-linking of the IgE-Fć̵R1 complex triggers degranulation. The bottom panel depicts 'Non-allergic (pseudoallergic)-mediated hypersensitivity,' highlighting that this pathway does not require prior sensitization. Instead, activation is triggered by direct interaction with Engineered Nanomaterials (ENMs) or anaphylatoxins from the complement system (C3a, C4a, C5a), leading directly to the release of intracellular granules. Visually, mast cells are shown as spherical purple cells with dense internal granules that are expelled into the extracellular space upon activation. The diagram serves as an educational tool to distinguish classic Type I hypersensitivity from direct mast cell triggers relevant to toxicology and immunology.
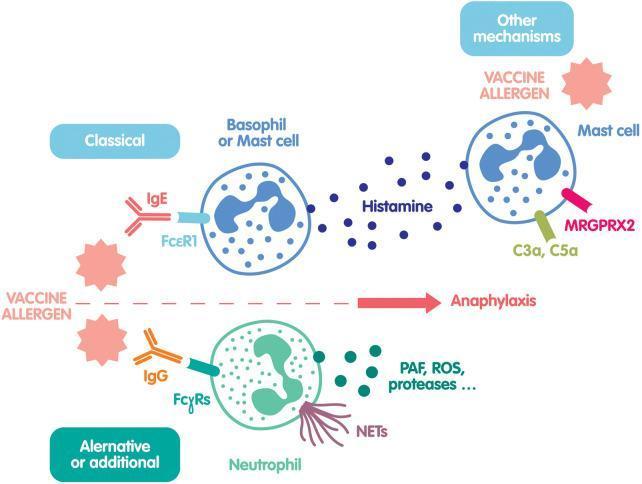
This pathophysiology diagram illustrates three main mechanisms of vaccine-induced anaphylaxis. The 'Classical' pathway (top left) depicts a Vaccine Allergen cross-linking IgE antibodies bound to FcεR1 receptors on a Basophil or Mast cell, triggering degranulation and the release of Histamine. The 'Alternative or additional' pathway (bottom) shows the Vaccine Allergen interacting with IgG antibodies bound to FcγRs on a Neutrophil, resulting in the release of PAF (Platelet-Activating Factor), ROS (Reactive Oxygen Species), proteases, and the formation of NETs (Neutrophil Extracellular Traps). The third section, 'Other mechanisms' (top right), describes non-IgE-mediated Mast cell activation through complement components C3a and C5a receptors, or direct activation of the MRGPRX2 receptor by the vaccine allergen, also leading to histamine release. All three pathways converge on a central axis culminating in Anaphylaxis. The diagram is designed for clinical immunology education, highlighting the diverse cellular and molecular drivers of hypersensitivity reactions.
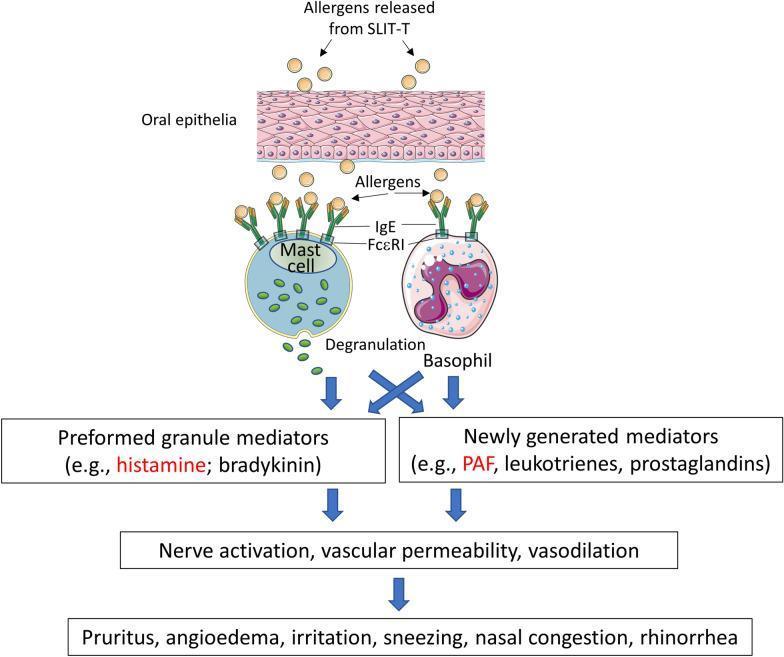
This pathophysiology diagram illustrates the biological mechanism of local allergic reactions induced by sublingual immunotherapy tablets (SLIT-T). The process begins with the release of allergens from SLIT-T into the oral epithelia. These allergens cross the epithelial barrier and bind to IgE antibodies complexed with FcεRI receptors on the surface of mast cells and basophils. This cross-linking triggers mast cell degranulation, releasing preformed granule mediators such as histamine and bradykinin. Simultaneously, it stimulates basophils to produce newly generated mediators, including platelet-activating factor (PAF), leukotrienes, and prostaglandins. The flowchart then maps these inflammatory mediators to their downstream physiological effects: nerve activation, increased vascular permeability, and vasodilation. Finally, the diagram lists the resulting clinical symptoms, such as pruritus, angioedema, irritation, sneezing, nasal congestion, and rhinorrhea. This educational resource summarizes the Type I hypersensitivity response specific to the sublingual route of allergen administration.
Type IV delayed hypersensitivity T cell contact dermatitis tuberculin test
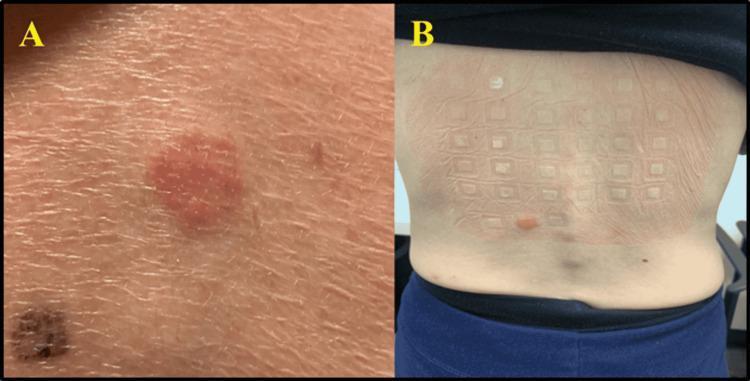
This composite clinical photograph displays the results of dermatological patch testing for Type IV delayed hypersensitivity reactions. Image A is a close-up of a positive nickel patch test, showing a well-demarcated, erythematous, and slightly edematous circular plaque on the skin, characteristic of allergic contact dermatitis. Image B provides a posterior view of a patient's back, illustrating a comprehensive patch test series arranged in a standardized grid-like pattern. Most test sites show only faint rectangular impressions from the adhesive chambers; however, a prominent positive reaction is visible in the lower left quadrant of the grid, appearing as a localized, raised erythematous patch. These images demonstrate the clinical manifestation of cell-mediated immune responses to specific allergens, such as gold and nickel, which are used to diagnose systemic or contact-related allergic reactions in patients presenting with drug exanthems or nonspecific urticaria.
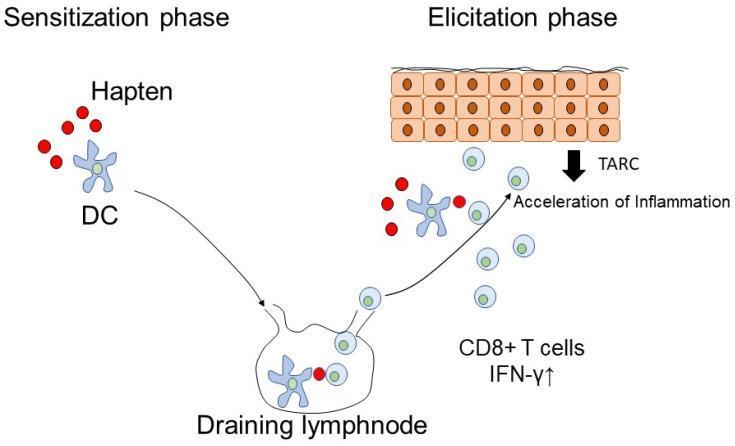
This pathophysiology diagram illustrates the two phases of a Type IV delayed hypersensitivity reaction in the skin: sensitization and elicitation. On the left, the 'Sensitization phase' shows haptens (small red circles) being captured by a cutaneous dendritic cell (DC), represented as a blue star-shaped cell. An arrow indicates the migration of this DC into a draining lymph node, where it presents the antigen to induce specific effector cells. On the right, the 'Elicitation phase' depicts a subsequent exposure under the epidermis (shown as cuboidal cells). Re-exposure triggers dendritic cell activation and the recruitment of CD8+ T cells and lymphocytes. Key molecular markers involved in the acceleration of inflammation are highlighted, including TARC (thymus and activation-regulated chemokine) and elevated IFN-γ (interferon-gamma). The diagram serves as an educational model for understanding the immune mechanisms behind allergic drug eruptions and contact dermatitis, emphasizing the progression from initial antigen recognition in lymph nodes to the localized cytotoxic inflammatory response in peripheral tissues.
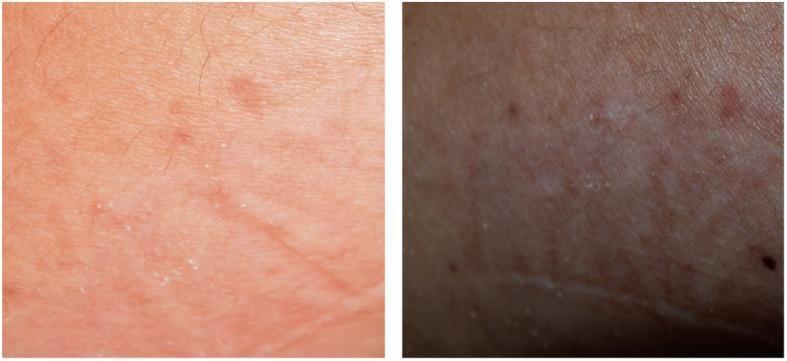
This clinical photograph consists of a side-by-side comparison of two skin sections demonstrating a Type IV delayed hypersensitivity reaction following a patch test with acrylic resin. The left image shows an acute-to-subacute phase characterized by diffuse erythema (redness) and fine desquamation (scaling/peeling). Small, scattered inflammatory papules are visible across the surface. The right image depicts a later or more chronic stage of the reaction, where the skin exhibits post-inflammatory hyperpigmentation, appearing darker and brownish. Persistent desquamation and small flakes of skin are evident in both panels, indicating surface texture abnormalities associated with allergic contact dermatitis. The image serves as an educational tool for identifying clinical signs of positive patch test results, specifically in the context of oral lichenoid reactions (OLR) triggered by dental materials like acrylic resin.
Hypersensitivity: From Basics to Clinical
What Is Hypersensitivity?
| Type | Name | Mediator | Onset |
|---|---|---|---|
| I | Immediate / Anaphylactic | IgE | Seconds to minutes |
| II | Cytotoxic / Antibody-mediated | IgG / IgM | Minutes to hours |
| III | Immune complex | IgG / IgM complexes | Hours (6-12 h) |
| IV | Delayed / Cell-mediated | T cells | 48-72 hours |
Type I: Immediate (IgE-Mediated) Hypersensitivity
Mechanism
- Sensitization phase: First antigen exposure induces formation of IgE antibodies by B cells (class-switched via IL-4/IL-13 from Th2 cells).
- IgE binds firmly by its Fc portion to high-affinity IgE receptors (FcεRI) on mast cells, basophils, and eosinophils - these cells are now "armed."
- Elicitation phase: Second antigen exposure leads to cross-linking of cell-bound IgE molecules on mast cells/basophils.
- Cross-linking triggers degranulation - release of preformed and newly synthesized mediators.
Mediators
- Histamine - causes vasodilation, increased capillary permeability, bronchospasm
- Heparin, tryptase
- Prostaglandins - edema, bronchoconstriction (via cyclooxygenase pathway)
- Leukotriene B4 - chemoattractant for leukocytes
- Leukotrienes C4/D4 - vasodilation, vascular permeability (10-100x more potent than histamine)
- TNF-α and IL-4
- Platelet-activating factor (PAF)
Clinical Manifestations
- Hay fever (allergic rhinitis to pollens, ragweed, house dust)
- Asthma (bronchospasm)
- Eczema / Atopic dermatitis
- Urticaria (hives)
- Food allergies (shellfish, nuts, etc.)
Treatment
- Epinephrine (first line for anaphylaxis - reverses bronchospasm and vasodilation)
- Antihistamines (block H1/H2 receptors; relatively effective in rhinitis)
- Corticosteroids (reduce late-phase inflammation)
- Avoidance of the identified antigen (identified by skin test or IgE serology)
- Immunotherapy (desensitization/tolerance induction)
Type II: Cytotoxic (Antibody-Mediated) Hypersensitivity
Mechanism
- IgG (or IgM) antibodies bind to antigens on cell surfaces or extracellular matrix.
- This triggers:
- Complement activation → lysis (MAC), opsonization, inflammation
- ADCC (antibody-dependent cell-mediated cytotoxicity) via NK cells/macrophages
- Receptor dysfunction - antibodies alter receptor function without cell destruction
Clinical Examples
| Disease | Target Antigen | Mechanism |
|---|---|---|
| ABO transfusion reaction | RBC surface antigens | Complement-mediated lysis |
| Hemolytic disease of newborn (Rh incompatibility) | Rh antigen on fetal RBCs | Maternal IgG crosses placenta → hemolysis |
| Autoimmune hemolytic anemia | RBC surface proteins | Complement lysis |
| Drug-induced hemolysis (e.g., penicillin) | Drug-coated RBC surface | Antibody + complement → hemolysis |
| Goodpasture syndrome | Basement membrane (kidney + lung) | Complement activation → severe membrane damage → nephritis + pulmonary hemorrhage |
| Graves disease | TSH receptor | Stimulatory antibody → hyperthyroidism (no cell death) |
| Myasthenia gravis | Acetylcholine receptor | Blocking antibody → muscle weakness |
| Bullous pemphigoid | Hemidesmosome proteins | IgG + C3 at basement membrane → subepidermal blistering |
| Pemphigus vulgaris | Desmoglein (desmosome) | IgG → intraepidermal blistering |
Type III: Immune Complex Hypersensitivity
Mechanism
- Antibody (IgG/IgM) combines with antigen → forms immune complexes.
- Normally these are promptly cleared by the reticuloendothelial system.
- If they persist (chronic infection, autoimmunity, persistent antigen load) they deposit in tissues - especially kidneys, joints, and blood vessels.
- Deposited complexes activate complement → C3a/C5a (anaphylatoxins) → mast cell degranulation, neutrophil recruitment → tissue damage.
Two Major Forms
- Low-dose antigen injected into skin in a pre-immunized individual
- Local IgG-antigen complex formation → complement activation → neutrophil recruitment → necrosis
- Occurs within 12 hours
- Example: Hypersensitivity pneumonitis (farmer's lung)
- Large antigen excess → complexes deposited systemically
- Classic example: Serum sickness after foreign serum/drug administration
- Features: fever, rash, arthralgia, glomerulonephritis, vasculitis
Clinical Examples
| Disease | Source of Antigen |
|---|---|
| Post-streptococcal glomerulonephritis | Streptococcal antigens (group A β-hemolytic) |
| Serum sickness | Foreign proteins (heterologous serum, some drugs) |
| SLE (lupus) | Self-antigens (DNA, histone) |
| Rheumatoid arthritis | IgM anti-IgG (rheumatoid factor) |
| Hypersensitivity pneumonitis | Inhaled fungal spores, bird proteins |
| Polyarteritis nodosa | Hepatitis B antigen |
| Cryoglobulinemic vasculitis | Hepatitis C antigens |
Type IV: Delayed-Type (Cell-Mediated) Hypersensitivity
Mechanism
- This is a T-cell mediated response - no antibody involved.
- Sensitization: Antigen-presenting cells (dendritic cells, macrophages) present antigen to CD4+ T helper cells (via MHC II) or CD8+ cytotoxic T cells (via MHC I).
- Elicitation (2-3 days later): Re-exposure → T-cell proliferation → release of inflammatory cytokines:
- IFN-γ - activates macrophages
- IL-2 - T-cell proliferation
- TNF-β - tissue damage
- Activated macrophages release lysosomal enzymes → tissue injury.
- Reaction begins 2-3 days after antigen contact and lasts several days.
Subtypes
- Sensitization with simple chemicals: nickel, formaldehyde, poison ivy/oak, topical sulfonamides, latex
- The hapten binds skin proteins → becomes a full antigen → CD8+ T cell response
- Clinically: erythema, vesicles, pruritus at the contact site
- Diagnosed by patch testing
- Classic example: Mantoux/PPD tuberculin skin test
- Intradermal injection of tuberculin antigen → if previously sensitized (TB-exposed), CD4+ T cells recognize antigen → macrophage activation → induration at 48-72 hours
- Used diagnostically for TB, leprosy, histoplasmosis
- Represents the most clinically significant subtype
- Occurs when the immune system cannot eliminate an antigen → persistent macrophage activation
- Macrophages transform into epithelioid cells and fuse into giant cells → granuloma formation
- Examples: Tuberculosis, sarcoidosis, Crohn's disease, leprosy, schistosomiasis, berylliosis
Clinical Examples of Type IV
| Disease | Antigen | T-cell subtype |
|---|---|---|
| Contact dermatitis | Nickel, poison ivy | CD8+ / CD4+ |
| Tuberculin skin test | PPD (tuberculoprotein) | CD4+ (Th1) |
| TB granuloma | M. tuberculosis | CD4+ Th1 + macrophages |
| Sarcoidosis | Unknown (possibly mycobacterial) | CD4+ Th1 |
| Graft rejection (cell-mediated) | Allogeneic MHC | CD4+ + CD8+ |
| Multiple sclerosis | Myelin basic protein | CD4+ Th1 |
| Type 1 diabetes | Islet cell antigens | CD8+ cytotoxic |
Comparison Summary
| Feature | Type I | Type II | Type III | Type IV |
|---|---|---|---|---|
| Mediator | IgE | IgG, IgM | IgG, IgM complexes | T cells (CD4+, CD8+) |
| Antigen | Environmental allergens | Cell surface / matrix | Soluble antigens | Intracellular / haptens |
| Onset | Seconds-minutes | Minutes-hours | 6-12 hours | 48-72 hours |
| Effectors | Mast cells, basophils, eosinophils | Complement, ADCC | Complement, neutrophils | Macrophages, T cells |
| Key mediators | Histamine, leukotrienes | Complement (MAC), FcR | C3a, C5a, neutrophil enzymes | IFN-γ, IL-2, TNF-β |
| Transferred by | Serum (IgE) | Serum (IgG) | Serum | Cells (not serum) |
| Complement | No | Yes | Yes (low serum C3/C4) | No |
| Classic example | Anaphylaxis, asthma | Transfusion reaction | Post-strep GN, SLE | TB skin test, contact dermatitis |
| Immunofluorescence | - | Linear deposits | Granular deposits | - |
Key Clinical Pearls
-
Anaphylaxis = systemic Type I; give epinephrine IM (thigh) immediately. Biphasic reaction can occur up to 12 hours later.
-
Serum sickness (Type III) vs. anaphylaxis (Type I) - serum sickness has delayed onset (days after exposure) with joint pain + low complement; anaphylaxis is immediate.
-
Goodpasture syndrome (Type II) shows linear IgG deposits on immunofluorescence; post-strep GN (Type III) shows granular deposits. This distinction is clinically tested.
-
Mantoux test positivity does NOT mean active TB - it indicates sensitization (prior exposure or BCG vaccination). Read at 48-72 hours; ≥10 mm induration is typically positive.
-
Type V hypersensitivity is sometimes described as a subtype of Type II - stimulatory antibodies (Graves' anti-TSH-R) where the antibody activates rather than destroys.
-
Atopic triad: eczema + allergic rhinitis + asthma - all Type I, with strong genetic basis and elevated total IgE.
-
In SLE: anti-dsDNA and anti-Smith antibodies form immune complexes deposited in kidneys (Type III) but also cause cytopenia via direct coating of blood cells (Type II). Multiple types can coexist.