give me ultrasound picture of complete muscle tear of upper or lower limb

Reading File
Finding Sources
Finding Sources
Finding Sources
Finding Sources
Reading File
Reading File
Finding Sources
Finding Sources
Finding Sources
Finding Sources
Reading File
Reading File
Reading File
Reading File
Reading File
Loading Image
Loading Image
Loading Image
Reading File
I now have all the information and images needed. Here is the comprehensive answer:

Ultrasound of Complete Muscle/Tendon Tear - Lower Limb

Below are textbook ultrasound images illustrating complete tears, with interpretation notes.

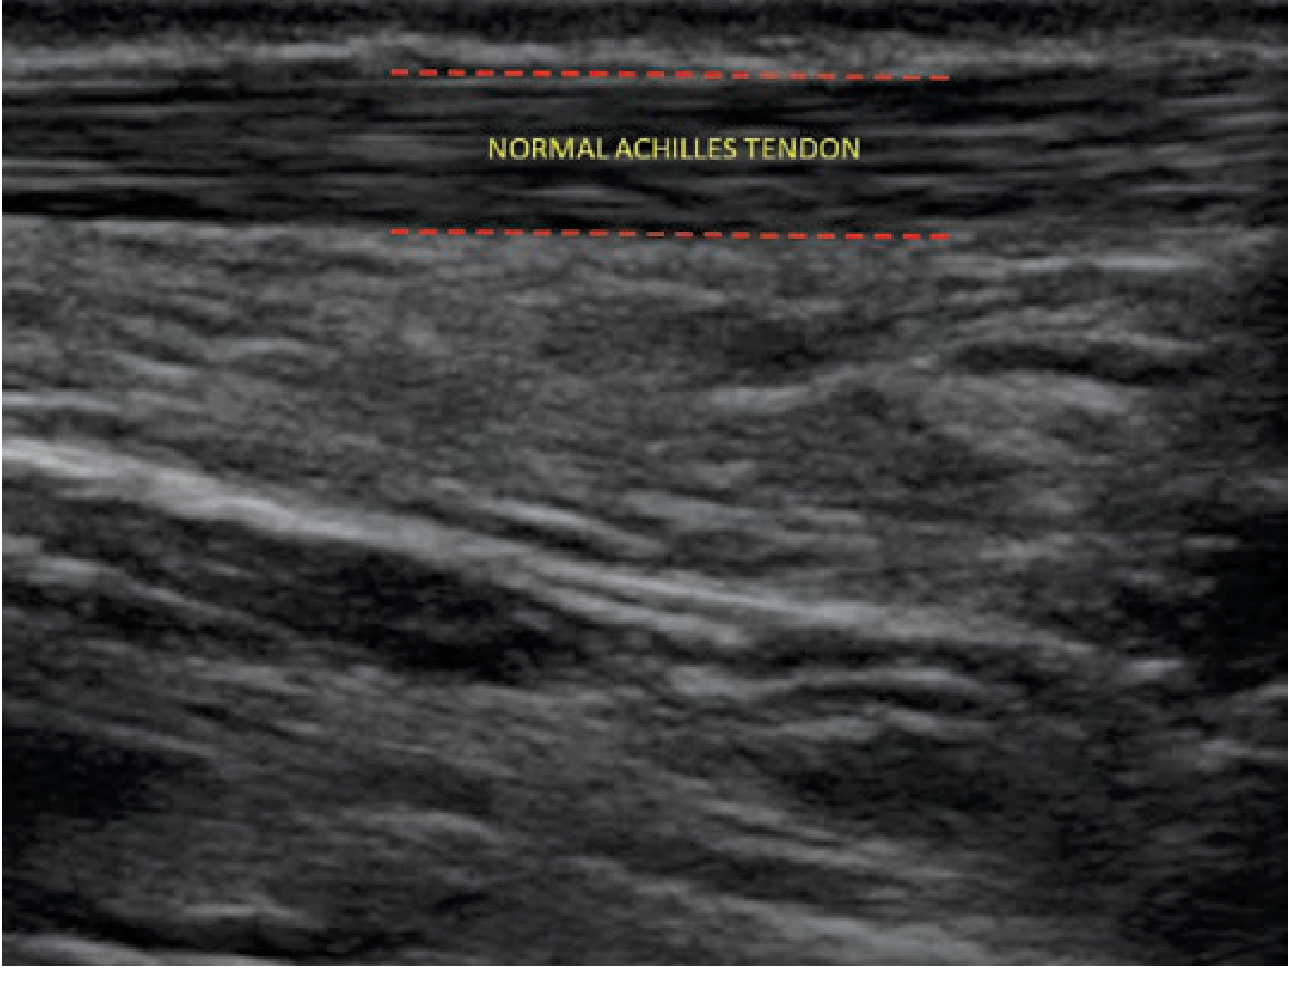
1. Normal Achilles Tendon (for comparison)

Normal Achilles Tendon - longitudinal ultrasound showing intact parallel fibrillar echotexture between red dashed lines
Fig. 276-9A - Normal Achilles tendon on longitudinal ultrasound. Note the continuous parallel echogenic fibrillar pattern (the "fibrillary" or "bundle of cables" appearance) bounded by the red dashed lines. This is what an intact tendon looks like. (Tintinalli's Emergency Medicine)

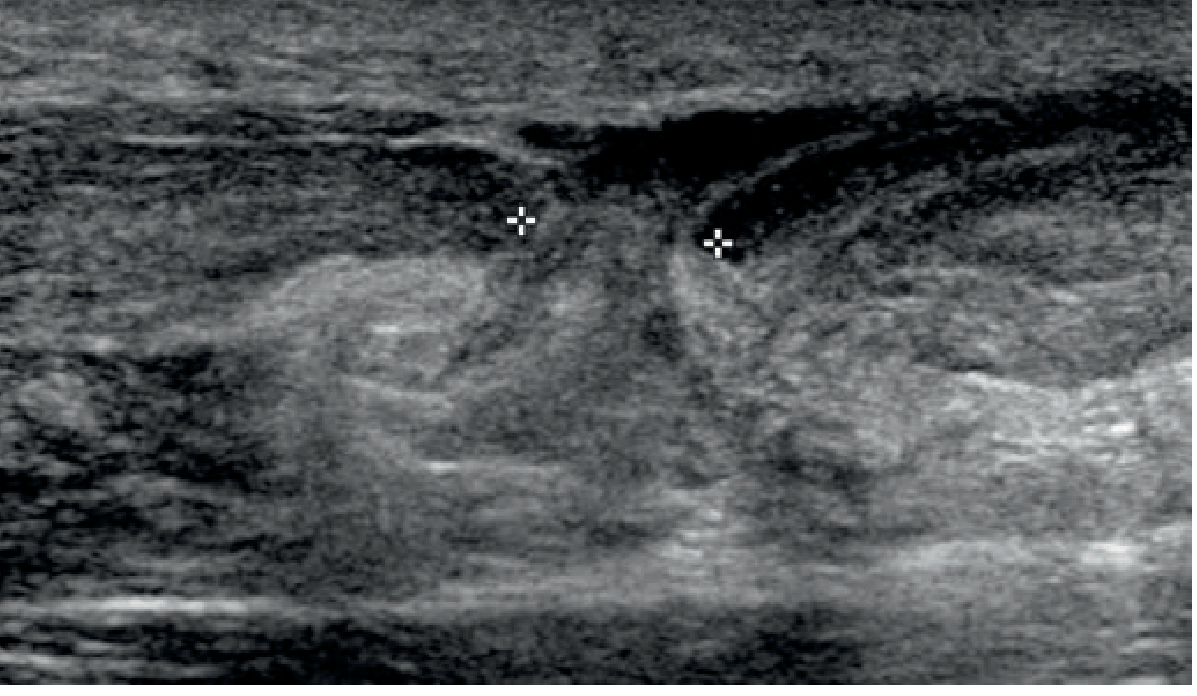
2. Complete Achilles Tendon Rupture

Complete Achilles Tendon Rupture - sagittal ultrasound showing 8mm gap between torn tendon ends marked by crosshairs
Fig. 39.69 - Complete Achilles tendon rupture. Sagittal (longitudinal) ultrasound showing a mid-substance tendon rupture with an 8 mm gap in the neutral position. The cross-hairs (+) mark the torn ends. The gap between the ends is filled with hypoechoic hematoma/fluid. Note the complete loss of the normal fibrillar pattern at the rupture site. (Grainger & Allison's Diagnostic Radiology)

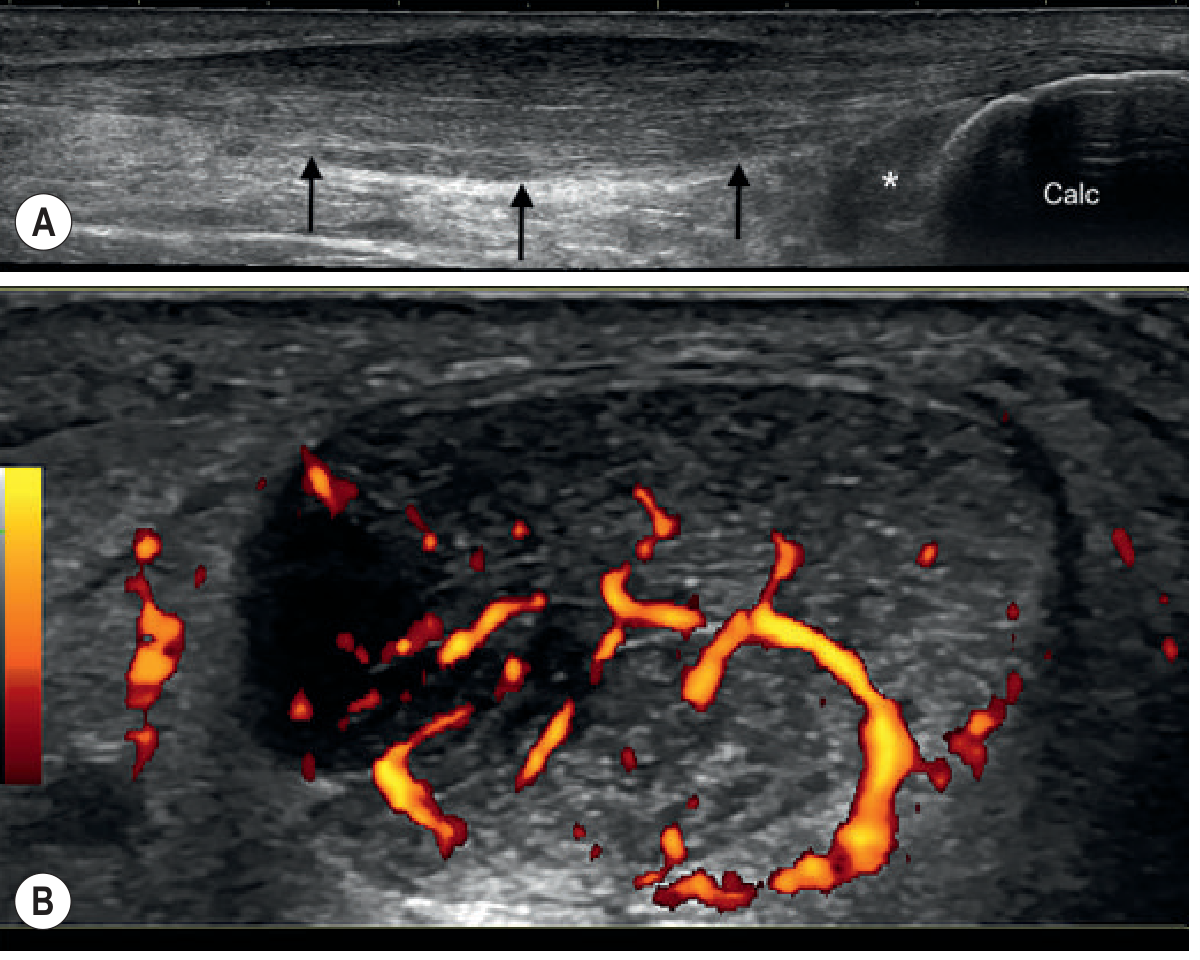
3. Achilles Tendinopathy with Power Doppler (pre-rupture stage for context)

Achilles Tendinopathy - (A) sagittal ultrasound showing fusiform thickening with mixed echogenicity; (B) power Doppler showing neovascularization
Fig. 39.67 - (A) Sagittal ultrasound: fusiform thickening and mixed echogenicity of the mid-portion of the tendon (arrows), with retrocalcaneal bursitis (*). Calc = calcaneus. (B) Transverse view with power Doppler showing neovascularization (orange signal) within the normally avascular tendon - a hallmark of tendinopathy that often precedes full rupture. (Grainger & Allison's Diagnostic Radiology)

How to Recognize a Complete Tear on Ultrasound

FeatureNormalComplete Tear
Fibrillar patternContinuous parallel echogenic fibersCompletely disrupted / absent
Tendon continuityIntact end-to-endGap between retracted ends
Gap contentsNoneHypoechoic hematoma or echogenic fat (Kager's fat in Achilles)
Dynamic testTendon moves synchronouslyNo movement at tear site; ends move apart
Tendon thicknessUniformProximal end may appear bulbous (retraction)
Key sonographic findings in complete muscle/tendon tear:
  • Discontinuity - complete loss of fibrillar echotexture across the full thickness
  • Retraction - proximal tendon stump retracts, often visible as a curled-up echogenic mass
  • Hematoma - anechoic or hypoechoic collection filling the gap
  • Herniated fat - in Achilles tears, echogenic Kager's fat is seen interposed between the torn ends
  • Quadriceps/patellar tendon: complete rupture shows hypoechogenicity over the entire length and thickness of the tendon, with a wedge-shaped separation
For the quadriceps tendon rupture specifically, the textbook notes that dynamic ultrasound demonstrates the separated tendon ends moving away from each other with intervening echogenic or echolucent fluid during knee flexion/extension.
Probe of choice: High-frequency linear array transducer (7.5-15 MHz). Always scan in two orthogonal planes and compare with the contralateral side.

Sources: Grainger & Allison's Diagnostic Radiology; Roberts and Hedges' Clinical Procedures in Emergency Medicine; Tintinalli's Emergency Medicine

give me usg images of infective myositis

Finding Sources
Finding Sources
Finding Sources
Finding Sources
Reading File
Reading File
Reading File
Reading File
Finding Sources
Finding Sources
Reading File
Reading File
Reading File
Reading File
Reading File
Finding Sources
Searching the Web

pyomyositis ultrasound sonography images muscle abscess findings

Loading Image
Loading Image
Loading Image
Reading Web Page

pyomyositis ultrasound sonography images muscle abscess

Loading Image
Searching the Web

pyomyositis ultrasound intramuscular abscess hypoechoic collection site:radiopaedia.org OR site:pmc.ncbi.nlm.nih.gov

Loading Image
Loading Image
Loading Image
I now have excellent ultrasound images of infective myositis/pyomyositis across multiple stages. Let me compile the comprehensive answer.

Ultrasound of Infective Myositis (Pyomyositis)

Pyomyositis is a primary bacterial infection of skeletal muscle, most commonly caused by Staphylococcus aureus, progressing through three clinical stages. Ultrasound is the first-line screening tool - rapid, portable, and capable of guiding aspiration/drainage.

Stage 1 - Invasive Stage: Early Muscle Edema

At this stage, ultrasound may look nearly normal or show subtle changes:
  • Diffuse muscle swelling and enlargement
  • Loss of normal striated muscle architecture (the usual parallel echogenic fibrillar pattern is disrupted)
  • Mildly hypoechoic or heterogeneous muscle echotexture
  • No discrete fluid collection yet

Stage 2 - Suppurative Stage: Intramuscular Abscess Formation

This is the classic presentation with the most characteristic ultrasound findings:
Image 1 - Intramuscular abscess with surrounding muscle edema (thigh pyomyositis):
Ultrasound of pyomyositis: intramuscular hypoechoic fluid collection (asterisk) within muscle (M) on left vs normal contralateral muscle (M) on right
(A) - Affected thigh: a well-defined hypoechoic/anechoic intramuscular fluid collection (asterisk *) surrounded by echogenic, edematous muscle tissue (M). Posterior acoustic enhancement bracket indicates fluid. (B) - Contralateral normal thigh muscle (M) showing intact normal striated architecture for comparison. The loss of the normal fibrillar pattern and the discrete fluid pocket are the hallmarks. (Journal of Emergency Medicine, Elsevier)

Image 2 - Pyomyositis with subcutaneous extension (lateral thigh):
Ultrasound of pyomyositis showing irregular hypoechoic intramuscular abscess with arrow pointing to collection, star marking overlying subcutaneous tissue
A large, irregular hypoechoic intramuscular fluid collection (arrow) deep to the subcutaneous tissue (star). The overlying skin/subcutaneous layer is thickened. The collection is at 4.5 cm depth, emphasizing why clinical examination alone misses deep pyomyositis. Note the heterogeneous echotexture of the surrounding muscle indicating associated myositis/edema. (Journal of Emergency Medicine, Elsevier)

Image 3 - Pyomyositis abscess with heterogeneous internal echoes:
Ultrasound showing large complex intramuscular abscess in pyomyositis with mixed hypoechoic and hyperechoic internal echoes
A large intramuscular collection with mixed echogenicity (predominantly anechoic/hypoechoic with scattered internal echoes representing debris/pus). Note the irregular, poorly defined border - this is typical of a pyomyositis abscess (versus a clean cyst which would have sharp walls and purely anechoic content). (Taming the SRU / Emergency Ultrasound)

Image 4 - Large, irregular deep pyomyositis abscess (iliopsoas/large muscle group):
Ultrasound of large deep pyomyositis abscess showing large anechoic to heterogeneous collection with crosshair measurements
A large, irregularly bordered complex hypoechoic-to-anechoic collection spanning a major muscle group, with crosshair calipers for sizing. The heterogeneous interior (mix of dark fluid and internal echoes/debris) distinguishes an infected abscess from a simple hematoma or cyst. Surrounding muscle edema is visible at the periphery.

Ultrasound Features Summary by Stage

StageUltrasound Finding
Stage 1 (Invasive)Diffuse muscle enlargement; loss of normal striated echo pattern; mild hypoechogenicity; no fluid pocket; hyperemia on Doppler
Stage 2 (Suppurative)Discrete intramuscular hypoechoic/anechoic fluid collection; internal echoes/debris; posterior acoustic enhancement; surrounding echogenic edematous muscle; peripheral Doppler flow (hyperemia)
Stage 3 (Late/Septic)Extension beyond single muscle; multi-compartment spread; gas echoes (bright foci with dirty shadowing) if gas-forming organisms

Key Technical Points

  • Probe: High-frequency linear array (7.5-15 MHz) for superficial muscles; lower frequency curvilinear (3-5 MHz) for deep muscles (iliopsoas, gluteus)
  • Doppler: Power Doppler shows peripheral hyperemia around the abscess wall - distinguishes active infection from old hematoma
  • Sonopalpation: Gentle probe compression over the collection reveals movement of pus/debris - confirms liquefaction
  • Always compare with the contralateral normal side
  • Limitation: Stage 1 (invasive) may be missed on ultrasound; MRI is the gold standard when clinical suspicion is high despite normal/equivocal ultrasound

Sources: Grainger & Allison's Diagnostic Radiology; Rheumatology 2-Volume Set (Elsevier 2022); Roberts and Hedges' Clinical Procedures in Emergency Medicine; Journal of Emergency Medicine (PMC7990081)

myositis ossificans usg images

Finding Sources
Finding Sources
Reading File
Reading File
Reading File
Finding Sources
Finding Sources
Finding Sources
Reading File
Finding Sources
Finding Sources
Searching the Web

myositis ossificans ultrasound sonography images acoustic shadowing eggshell calcification

Loading Image
Loading Image
Loading Image
Loading Image
Loading Image
Searching the Web

myositis ossificans ultrasound stages early late peripheral calcification acoustic shadow PMC site:pmc.ncbi.nlm.nih.gov

Loading Image
Loading Image
Loading Image
Loading Image
I now have excellent images covering multiple stages of myositis ossificans on ultrasound. Let me compile the comprehensive answer.

Ultrasound of Myositis Ossificans

Myositis ossificans (MO) is post-traumatic heterotopic bone formation within muscle, most commonly in the anterior thigh (quadriceps), upper arm (brachialis), and hip muscles after a direct blow or contusion. Ultrasound is highly sensitive to calcific changes and is the ideal modality to follow disease progression.

Stage-by-Stage Ultrasound Appearances


Stage 1 (Early / Acute: 0-3 weeks) - Hematoma, No Calcification Yet

Image 1 - Early stage hematoma vs. developing calcification (quadriceps):
Myositis ossificans serial ultrasound: top-left shows anechoic/hypoechoic intramuscular hematoma above femur; top-right shows developing echogenic calcification appearing; bottom-left MRI axial; bottom-right X-ray showing ossification (arrows) in vastus intermedius/lateralis
Top-left (Early): An anechoic/hypoechoic ovoid intramuscular hematoma sitting above the echogenic femoral cortex. No calcification. This is the non-specific acute phase - hard to diagnose as MO at this point.
Top-right (Intermediate - calcification appears): The same region now shows scattered hyperechoic foci (calcification) developing within the previously hypoechoic hematoma. This transition is the key early USG clue.
Bottom-left (MRI): Corresponding axial MRI confirms the mass in vastus medialis oblique (VMO), vastus intermedius (VI), and vastus lateralis (VL).
Bottom-right (X-ray): Developing peripheral ossification (green arrows), separate from the femoral cortex. (London Bridge Sports Medicine)

Stage 2 (Intermediate / Subacute: 3-8 weeks) - Peripheral Calcification

Image 2 - Myositis ossificans with developing peripheral hyperechoic rim (with X-ray and MRI correlation):
Multi-panel: (A) X-ray shows soft tissue mass with arrow; (B) ultrasound shows hyperechoic calcification rim (arrow) with posterior acoustic shadowing (star); (C-D) X-rays at different timepoints; (E-G) MRI and CT of myositis ossificans
Panel (B) is the key ultrasound image: A hyperechoic (bright white) irregular peripheral calcified rim (arrow) with posterior acoustic shadowing (star *) beneath it - this is the pathognomonic "eggshell" or "zone phenomenon" on ultrasound. The central area behind the rim is acoustically shadowed (dark), obscuring deeper detail. This peripheral-to-central calcification pattern distinguishes benign MO from malignant tumors (which calcify centrally first). (Indian Journal of Radiology and Imaging, PMC3354355)

Stage 3 (Late / Mature: >8 weeks) - Complete "Eggshell" Calcification

Image 3 - Mature myositis ossificans: complete peripheral ossification with dense acoustic shadowing:
Two-panel ultrasound of mature myositis ossificans: top panel shows heterogeneous mass with irregular hyperechoic surface; bottom panel shows the mass with prominent posterior acoustic shadowing
Top panel: The heterogeneous intramuscular mass with an increasingly echogenic (hyperechoic) irregular surface - the peripheral ossification is now well-formed. The interior shows mixed echogenicity.
Bottom panel: Same lesion in a different plane showing a dense, completely calcified periphery with a dark posterior acoustic shadow extending deep - the mature MO "eggshell" sign. The lesion is well-defined and encapsulated. No soft-tissue vascularity is seen on Doppler at this stage (distinguishing it from active tumor). (Journal of Belgian Society of Radiology, PMC10870937)

Ultrasound Findings Summary by Stage

StageTimingUltrasound Appearance
Acute0-3 weeksHypoechoic/anechoic intramuscular hematoma; muscle swelling; no calcification; hyperemia on Doppler
Intermediate3-8 weeksHeterogeneous mass; peripheral hyperechoic foci begin to appear; partial posterior acoustic shadowing developing
Mature>8 weeksComplete hyperechoic peripheral "eggshell" rim; dense posterior acoustic shadowing; central area acoustically obscured; no Doppler flow

Key Diagnostic Points on Ultrasound

  1. Zone phenomenon - peripheral calcification with a relatively lucent center is the hallmark; calcification always starts at the rim and moves inward (opposite to osteosarcoma)
  2. Posterior acoustic shadowing increases progressively as ossification matures - in late stages it can be so dense that the lesion interior is completely obscured
  3. No bone continuity - the lesion is separate from the adjacent cortex (important to confirm with orthogonal views); absence of a cleavage plane from bone suggests malignancy
  4. Doppler: Active hyperemia in early/intermediate stages; absent flow in mature calcified rim
  5. Probe: High-frequency linear 7.5-15 MHz; standoff pad may help for very superficial lesions
  6. US is very sensitive to calcific changes - it can detect ossification earlier than plain radiography in some cases

Differential on ultrasound: Soft tissue osteosarcoma (centrally calcified, bone involvement, Doppler-positive), calcific tendinopathy (within tendon), hematoma (no calcification), abscess (no calcification, Doppler at margins).

Sources: Rheumatology 2-Volume Set (Elsevier 2022) - "US is very sensitive to calcific changes in tissues such as those that occur with myositis ossificans"; Campbell's Operative Orthopaedics 15th Ed 2026; ROSEN's Emergency Medicine; Indian Journal of Radiology and Imaging (PMC3354355); Journal of Belgian Society of Radiology (PMC10870937)

muscle sarcoma

Asking for Preferences
Finding Sources
Finding Sources
Searching the Web

soft tissue sarcoma muscle ultrasound sonography imaging findings

Finding Sources
Finding Sources
Loading Image
Finding Sources
Loading Image
Loading Image
Finding Sources
Searching the Web

rhabdomyosarcoma synovial sarcoma undifferentiated pleomorphic sarcoma ultrasound images intramuscular

Reading File
Loading Image
Loading Image
Reading Web Page

soft tissue sarcoma ultrasound images heterogeneous Doppler vascularity

Loading Image
Searching the Web

soft tissue sarcoma ultrasound heterogeneous mass intramuscular thigh Doppler PMC open access image

Loading Image
Loading Image
Loading Image
I now have an excellent collection of ultrasound images covering different aspects of muscle sarcoma. Let me compile the full answer.

Ultrasound Imaging of Muscle Sarcoma (Soft Tissue Sarcoma)

Ultrasound is the first-line imaging modality for any soft tissue lump. It confirms the lesion, assesses depth/size, differentiates solid from cystic, and evaluates vascularity. Sensitivity for malignancy is 94% and specificity 99.7% for superficial lesions. MRI follows for staging and surgical planning.

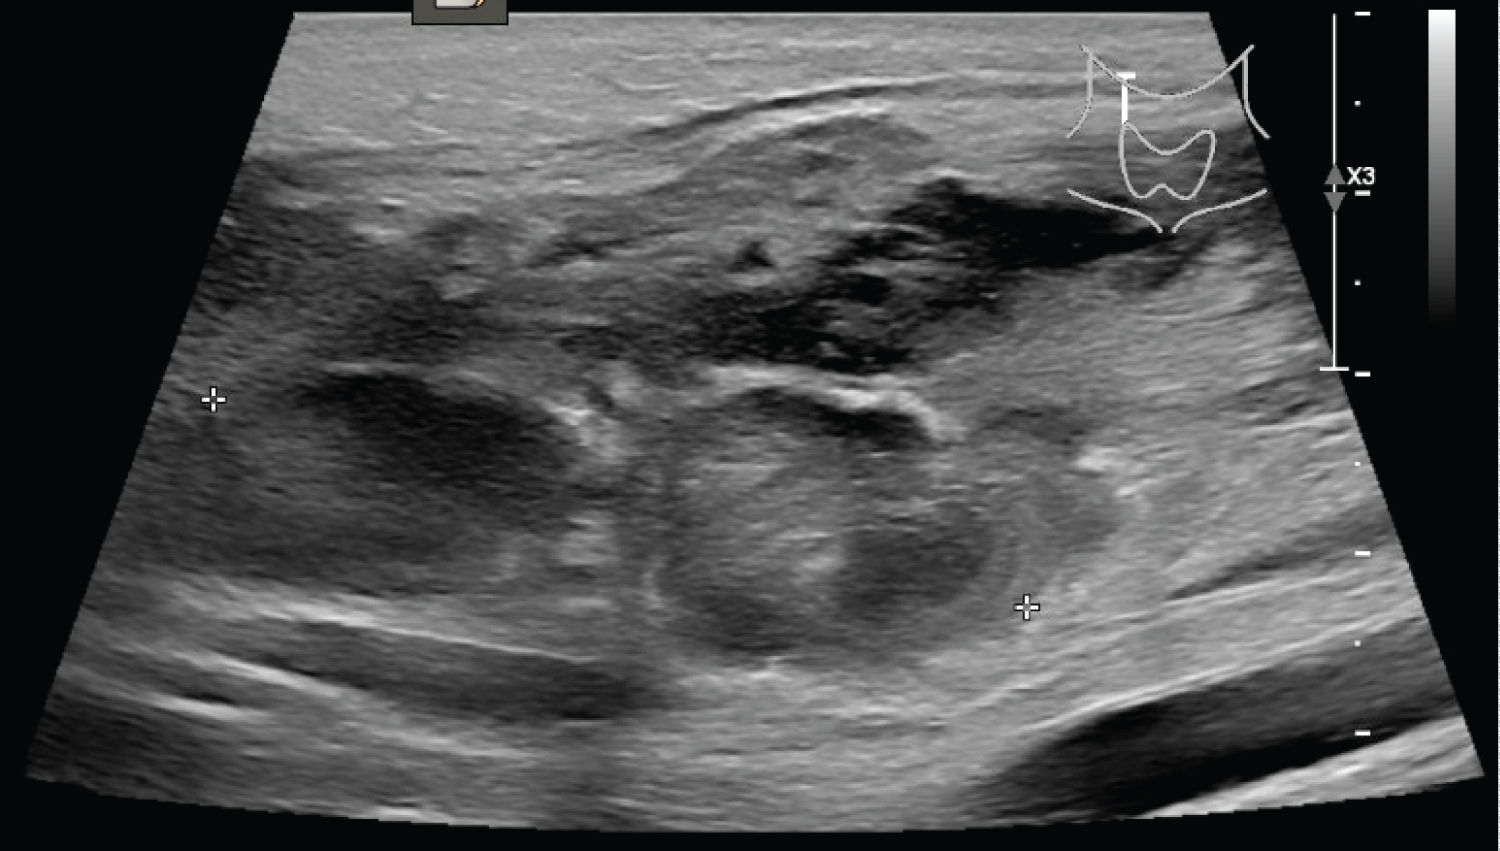
Image 1 - Undifferentiated Pleomorphic Sarcoma (UPS) / MFH - Thigh

Annotated ultrasound of heterogeneous deep thigh sarcoma mass below fascia with subcutaneous tissue labeled, extending 4-6 cm deep
A large (>5 cm) deeply situated intramuscular mass below the fascia (labeled green). The mass is markedly heterogeneous - mixed hypoechoic and echogenic regions corresponding to solid tumor, hemorrhage, and necrosis. It spans from 2 to 6 cm depth. The deep location (below fascia), large size, and heterogeneous texture are all red-flag features for malignancy. This was proven sarcoma on biopsy. (JETem Emergency Radiology)

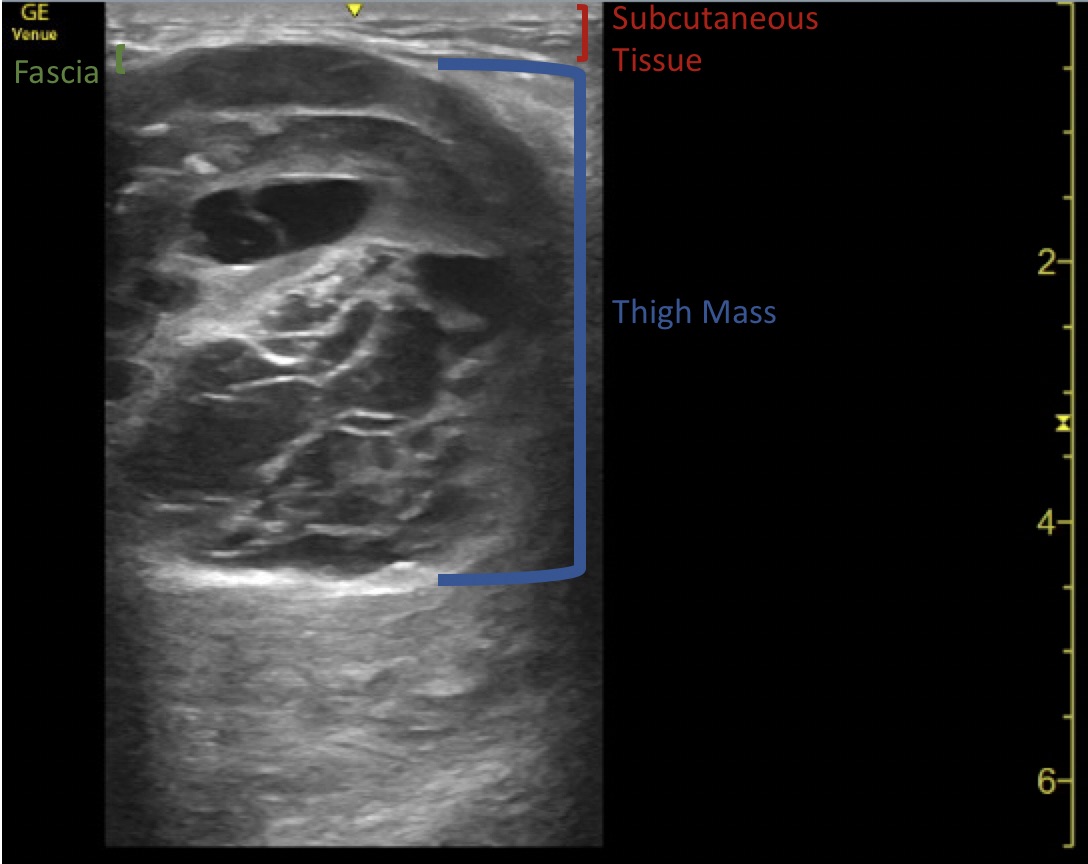
Image 2 - Soft Tissue Sarcoma, Forearm - Heterogeneous Mass with Marked Doppler Vascularity

Soft tissue sarcoma ultrasound: (a) heterogeneous hypoechoic-to-mixed echogenicity mass gray-scale; (b) color Doppler showing marked internal vascularity red/orange; (c) longitudinal view showing mass infiltrating tissue planes
(A) Gray-scale: Heterogeneous soft tissue mass with mixed hypoechoic and hyperechoic areas - no clear organized tissue architecture. Compare this to normal striated muscle which should show parallel echogenic septa.
(B) Color Doppler: Marked, chaotic internal vascularity - a major red flag for malignancy. Sarcoma vessels are anatomically abnormal (lack a muscular wall), resulting in an irregular, disorganized branching pattern. This "anarchic" vascular pattern (trifurcations, irregular caliber, random distribution) distinguishes sarcoma from benign tumors which tend to have organized radial or peripheral flow.
(C) Longitudinal: The mass infiltrates along tissue planes without a clean capsule - ill-defined margins indicating invasive behavior. (European Journal of Radiology, Elsevier)

Image 3 - Large Deep Sarcoma (Abdominal/Retroperitoneal Leiomyosarcoma) with Doppler

Two-panel ultrasound: (a) gray scale showing large 7x6cm heterogeneous mass; (b) color Doppler showing prominent vascularity within the mass
(a) Gray-scale: A large (7.22 × 6.38 cm) heterogeneous solid mass with mixed echogenicity - areas of high cellularity appear isoechoic/hyperechoic, while central necrotic zones appear hypoechoic/anechoic.
(b) Color Doppler: Prominent internal and peripheral vascularity with chaotic vessel distribution - classic for high-grade sarcoma. The combination of large size (>5 cm) + deep location + heterogeneity + marked vascularity = high suspicion for malignancy. (Frontiers in Oncology)

Image 4 - Synovial Sarcoma with Abnormal Doppler Flow

Soft tissue sarcoma heterogeneous mass (a) gray scale with irregular texture and arrowheads marking borders; (b) color Doppler shows marked internal vascularization in red/blue
(a) Gray-scale: The mass (arrowheads) shows heterogeneous echogenicity with irregular internal texture. The double arrows indicate a central hypoechoic zone (likely necrosis). Borders are partly ill-defined.
(b) Color Doppler: Dense, disordered internal and peripheral vascularity - both arterial (red) and venous (blue) signals are present within the tumor in an unorganized pattern. This neovascularization reflects rapid tumor growth and angiogenesis. (Scientific Reports, Springer Nature)

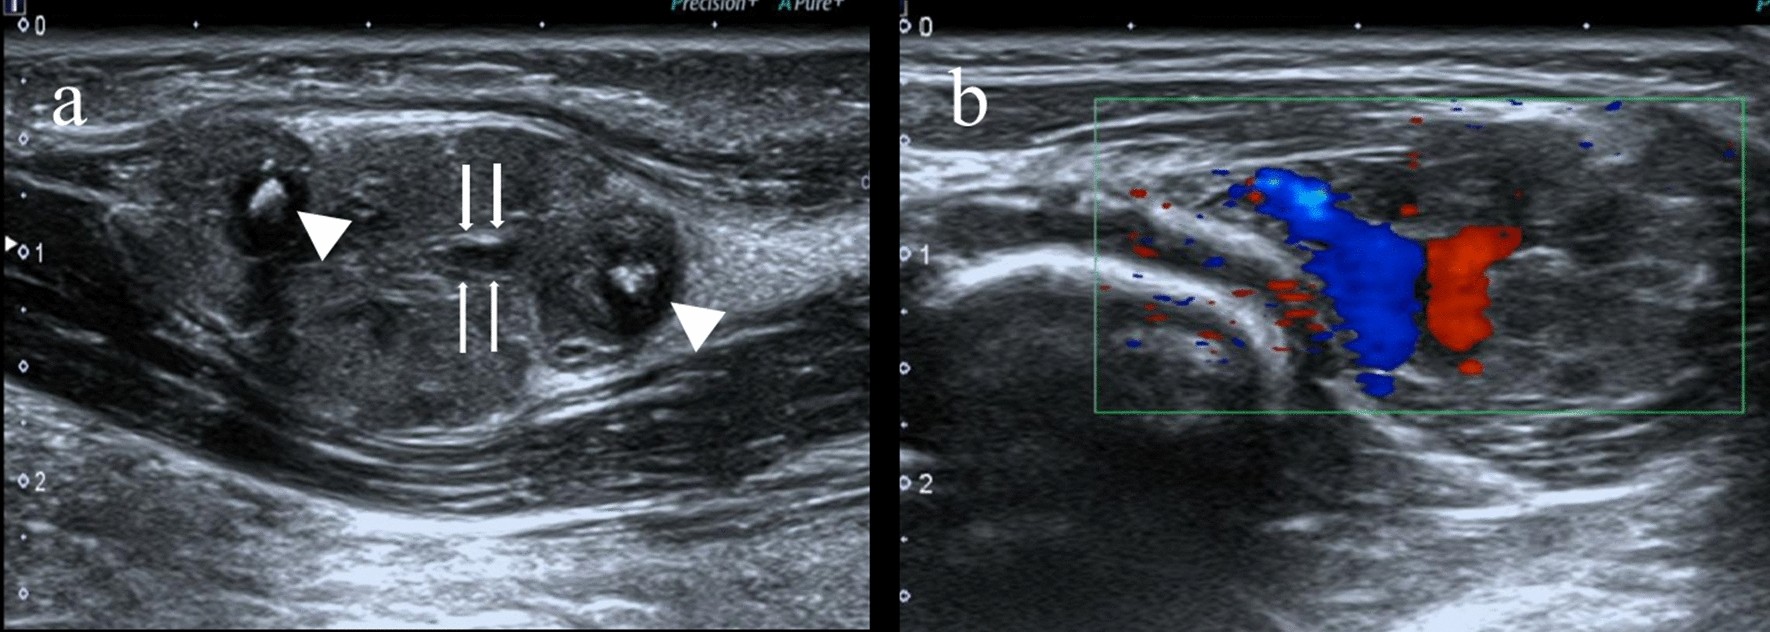
Image 5 - Radiopaedia Case: Intramuscular Sarcoma, Right Upper Thigh

Ultrasound right upper thigh: large well-circumscribed hypoechoic intramuscular solid mass measuring 5.68 x 3.76 cm with internal echoes
A large (5.68 × 3.76 cm), well-circumscribed but deeply intramuscular hypoechoic solid mass in the right upper thigh. Despite appearing relatively well-defined here (which can occur in some sarcoma subtypes like synovial sarcoma), the size >5 cm + deep to fascia + solid combination mandates urgent MRI and biopsy. Note: a well-defined margin on ultrasound does NOT exclude malignancy - up to 30% of sarcomas can appear well-defined. (Radiopaedia)

Ultrasound Features: Benign vs. Sarcoma

FeatureBenignSarcoma (Red Flags)
Size<46 mm>46 mm (>5 cm)
LocationSubcutaneousDeep to fascia / intramuscular
MarginsWell-definedIll-defined, infiltrative
EchotextureHomogeneousHeterogeneous (mixed hypo/hyperechoic)
NecrosisAbsentAnechoic areas (central necrosis)
VascularityAvascular or peripheral onlyMarked internal, chaotic, disorganised Doppler
Vessel patternOrganised/hierarchicalAnarchic - trifurcations, irregular calibre
CompressionMay compress (lipoma)Incompressible
GrowthStableIncreasing in size

Key Sarcoma Subtypes and USG Characteristics

SubtypeTypical USG Appearance
Undifferentiated Pleomorphic Sarcoma (UPS/MFH)Large, deep, markedly heterogeneous; mixed hypo/hyperechoic; necrosis common; high vascularity
Synovial SarcomaMay appear deceptively well-defined and homogeneous; periarticular; calcifications in 30%; "triple sign" on MRI
LiposarcomaVariable - myxoid type appears hypoechoic/pseudocystic; well-differentiated type echogenic like lipoma but large and deep
RhabdomyosarcomaPoorly defined, deeply invasive; heterogeneous; most common in children
LeiomyosarcomaHypoechoic mass, often with necrosis; high vascularity; retroperitoneal or extremity
MyxofibrosarcomaHypoechoic/pseudocystic due to myxoid matrix; may have "tail sign" infiltrating along fascia

Role of Ultrasound in Sarcoma - Practical Points

  1. First-line triage: Ultrasound can definitively diagnose benign lesions (lipoma, ganglion, haematoma) and refer suspicious ones urgently
  2. Biopsy guidance: USG-guided core needle biopsy is the standard method - along the shortest path, avoiding neurovascular structures, with care to keep the biopsy tract within the eventual surgical resection field
  3. Always use Doppler: Vascularity pattern is the most discriminating feature
  4. Pitfall - myxoid tumors: Can mimic cysts on greyscale - increase the gain to reveal internal echoes indicating solid content (myxoid liposarcoma, intramuscular myxoma)
  5. If any doubt: Any mass >5 cm, deep to fascia, or with internal vascularity requires urgent MRI - do not attempt excisional biopsy without imaging staging

Sources: Grainger & Allison's Diagnostic Radiology (Elsevier) - "An organised vascular pattern in 77% of benign vs. disorganised in 80% of malignant soft tissue tumors"; Journal of Clinical Orthopaedics and Trauma (PMC8449057); European Journal of Radiology (Elsevier)

tennis leg usg images

Finding Sources
Finding Sources
Searching the Web

tennis leg ultrasound sonography gastrocnemius medial head tear plantaris images

Reading Web Page

tennis leg ultrasound images gastrocnemius medial head tear hematoma

Finding Sources
Finding Sources
Searching the Web

tennis leg ultrasound images PMC3060433 gastrocnemius soleus hematoma tear site:pmc.ncbi.nlm.nih.gov

Reading File
Searching the Web

tennis leg ultrasound gastrocnemius medial head tear hematoma fluid between gastrocnemius soleus image open access

Loading Image
Loading Image
Loading Image
Reading Web Page

tennis leg ultrasound images gastrocnemius soleus fluid hematoma figures

Searching the Web

"tennis leg" ultrasound "gastrocnemius" "soleus" fluid collection hematoma image cdn.ncbi.nlm.nih.gov OR radiopaedia

Loading Image
Loading Image
Loading Image
Loading Image
Loading Image
Finding Sources
I have everything needed for a comprehensive answer. Let me compile it now.

Ultrasound of Tennis Leg

Tennis leg = acute mid-calf pain from rupture of the medial head of the gastrocnemius (MHG) at its distal musculotendinous junction with the soleus. Occurs classically with sudden forceful plantar flexion + knee extension (e.g. sprinting, jumping). Ultrasound is the primary imaging tool - cheap, dynamic, and highly accurate.

Anatomy Relevant to USG

On ultrasound, from superficial to deep at the posterior calf:
  1. Skin / subcutaneous fat
  2. Gastrocnemius (hypoechoic with pennate fibrillar pattern)
  3. Echogenic fascia / aponeurosis (the triceps surae junction - the key interface)
  4. Soleus (deeper, also pennate)
Tennis leg tears occur at the deep surface of the MHG aponeurosis - so fluid collects between gastrocnemius and soleus.

Image 1 - Classic Tennis Leg: Fluid Between Gastrocnemius and Soleus (Labeled)

Labeled longitudinal ultrasound showing GASTROCNEMIUS above and SOLEUS below with hypoechoic fluid (arrows) at the interface between them - classic tennis leg finding
The pathognomonic finding: A hypoechoic/anechoic fluid collection (arrows) between the GASTROCNEMIUS and SOLEUS, most prominent at the level of the musculotendinous junction. Left panel (affected side) shows the dark fluid stripe separating the two muscles. Right panel (comparison) shows the normal close apposition of these layers. This fluid = hematoma/hemorrhage from the torn aponeurosis.
Sensitivity of this finding: 90.9% (Kwak et al., KJR 2006) (Radiopaedia)

Image 2 - Extended Field-of-View: Aponeurotic Tear with Hematoma

Extended field of view longitudinal ultrasound of right posterior calf showing hypoechoic hematoma collection deep to gastrocnemius at the level of the right aponeurosis
Extended field-of-view (panoramic) longitudinal scan of the right calf aponeurosis. A large hypoechoic hematoma is seen pooling deep to the medial gastrocnemius at the aponeurotic level. The collection is fusiform and tracks along the fascial plane. This panoramic view allows assessment of the full extent of the hematoma and any proximal retraction of the torn muscle. (Radiopaedia - Tennis Leg Case)

Image 3 - Focal Disruption at the Musculotendinous Junction

Ultrasound showing disruption at the right aponeurosis level with focal hypoechoic fluid collection and retracted muscle fibers
Close-up longitudinal view at the right aponeurosis level. A well-defined hypoechoic fluid collection is visible at the deep surface of the gastrocnemius aponeurosis. The overlying muscle fibers show disruption - the normal parallel pennate pattern of the gastrocnemius is replaced by hypoechoic edematous tissue. The soleus lies deep, also with reactive hyperechogenicity at the injury margin. (Radiopaedia - Tennis Leg Case)

Image 4 - Bilateral Comparison (Affected vs. Normal)

Bilateral longitudinal posterior calf ultrasound comparison: Right posterior mid-calf (affected) vs Left posterior calf (normal). Right side shows loss of pennate pattern and subtle deep fluid; left side shows normal striated muscle architecture
RT POST MID CALF LONG (left panel - affected): Disrupted muscle architecture, loss of normal echogenic pennate septae, and subtle hypoechoic area at the deep gastrocnemius margin.
LT POST CALF LONG (right panel - normal): Well-defined parallel echogenic fibrillar lines of normal striated muscle for comparison. Always scan the contralateral limb when assessing calf injuries. (Radiopaedia)

Image 5 - Large Hematoma Between Layers

Longitudinal ultrasound showing large anechoic to hypoechoic hematoma pool deep to gastrocnemius superficial to soleus at 2-8cm depth
A large anechoic-to-hypoechoic pool occupying the space between gastrocnemius and soleus from ~2-8 cm depth. In complete tears, the hematoma (mean 9.7 mm thick) is significantly larger than in partial tears (mean 6.8 mm). Dynamic assessment with probe compression shows swirling internal echoes confirming fluid nature. (Radiopaedia)

USG Findings by Injury Grade

GradeInjuryUltrasound Appearance
Grade 1 (Mild strain)Microscopic tears; no macroscopic disruptionNear-normal; mild hypoechoic edema within MHG fibers; no fluid collection
Grade 2 (Partial tear)Partial aponeurotic disruptionDisruption of pennate pattern; thin fluid collection (4-8 mm) between MHG and soleus; focal hypoechoic hematoma
Grade 3 (Complete tear)Full-thickness aponeurotic ruptureLarge fusiform hematoma (6-16 mm) filling gastrocnemius-soleus space; retraction of MHG; complete loss of fibrillar pattern at MTJ

Classic USG Checklist for Tennis Leg

  1. Fluid between MHG and soleus - the hallmark sign; seen in 90.9% of cases
  2. Disruption of the pennate/fibrillar pattern of the distal MHG - loss of the normal echogenic septae
  3. Hematoma size - measure thickness; predicts severity and recovery time
  4. MHG retraction - retracted proximal stump visible as a hypoechoic bulge
  5. Fluid tracking distally along fascial planes - indicates large tear
  6. Always check for DVT - coexists in up to 10% of tennis leg cases; DVT appears as a non-compressible thrombosed vein
  7. Plantaris tendon - look for it as a separate thin echogenic line between MHG and soleus; discontinuity = plantaris tear (only 1.4% of tennis leg cases)
  8. Doppler - hyperemia at the tear margins; helps guide aspiration
Probe: High-frequency linear (7.5-15 MHz); patient prone; scan longitudinally and transversely from popliteal fossa to Achilles.

Sources: ROSEN's Emergency Medicine (Elsevier); Pictorial Essay - Ultrasonography in Tennis Leg (PMC3060433); KJR - Diagnosis and Follow-up US Evaluation of Tennis Leg (PMC2667601); Radiopaedia

baker' cyst and ruptured baker's cyst usg images

Finding Sources
Finding Sources
Searching the Web

Baker's cyst ruptured popliteal cyst ultrasound sonography images findings

Reading File
Loading Image
Loading Image
Loading Image
Loading Image
Loading Image
Loading Image
Searching the Web

Baker's cyst ultrasound "neck sign" communication knee joint anechoic posterior acoustic enhancement radiopaedia open access

Loading Image
Loading Image
Loading Image
Outstanding images! I now have a complete set covering: simple Baker's cyst, complex cyst, anatomical position (semimembranosus + MHG labeled), neck communication, and ruptured/leaking cyst. Let me now compile the comprehensive answer.

Ultrasound of Baker's Cyst and Ruptured Baker's Cyst

A Baker's cyst (popliteal cyst) is a fluid-filled bursal swelling in the popliteal fossa arising from the gastrocnemio-semimembranosus (G-SM) bursa, communicating with the knee joint via a one-way valve mechanism. It is secondary to any cause of joint effusion (OA, RA, meniscal tears). Ultrasound is the first-line imaging tool with near 100% sensitivity.

PART 1: Intact Baker's Cyst


Image 1 - Classic Simple Baker's Cyst: Transverse View with Measurements

Transverse ultrasound (TRV) of popliteal fossa showing a large anechoic Baker's cyst measuring 3.21 x 1.62 x 1.92 cm with posterior acoustic enhancement between muscle planes
Transverse view (TRV) of Baker's cyst measuring 3.21 × 1.62 × 1.92 cm. Features of a simple cyst:
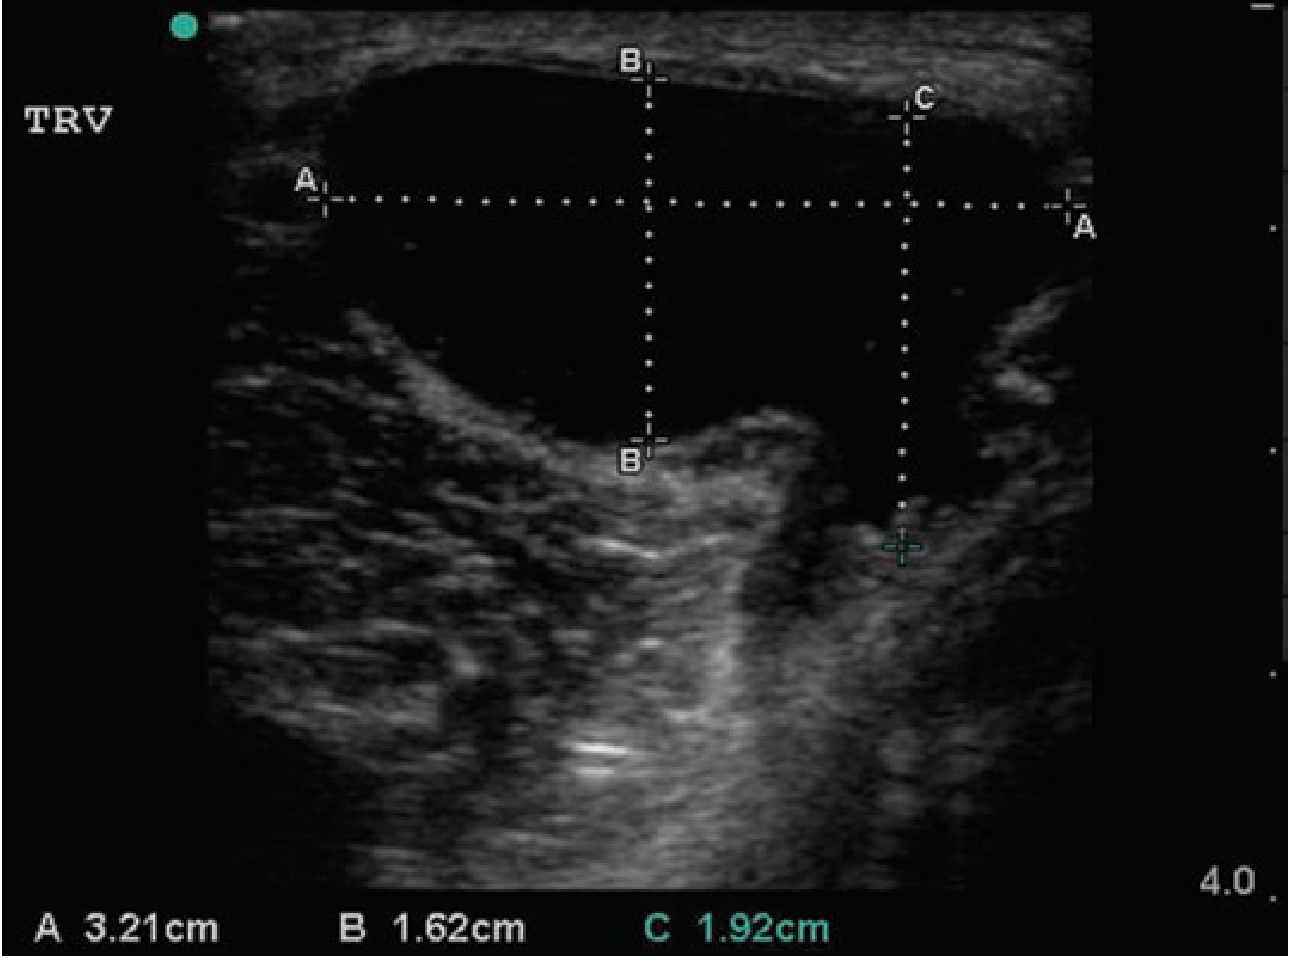
  • Large anechoic (completely black/dark) fluid-filled cavity
  • Sharply defined walls
  • Posterior acoustic enhancement (the area deep to the cyst appears brighter than surrounding tissue - confirms fluid content)
  • Well-encapsulated, oval/teardrop shape
(Tintinalli's Emergency Medicine)

Image 2 - Anatomical Position: Baker's Cyst between Semimembranosus and Medial Gastrocnemius (Labeled)

Labeled ultrasound showing Baker's cyst anechoic body nestled between SEMIMEMBRANOSUS above and MEDIAL HEAD OF GASTROCNEMIUS MUSCLE below in the right popliteal fossa
This labeled image shows the key anatomical relationship - the cyst sits between the semimembranosus (SM) tendon (above) and the medial head of gastrocnemius muscle (MG) (below). This is the pathognomonic location. The anechoic cyst body is clearly delineated between these two structures. Always check this "between SM and MHG" position to confidently diagnose a Baker's cyst vs. other popliteal masses.
(Radiopaedia)

Image 3 - Baker's Cyst with Neck Communication to Knee Joint

Transverse posterior knee ultrasound showing three panels: (A) large Baker's cyst between SM and MG with yellow arrows indicating neck communication; (B) medium cyst with neck; (C) small cyst - all POST KNEE TR views with SM and MG labeled
Three-panel transverse series showing Baker's cysts of varying sizes at the posterior knee (POST KNEE TR), all between the semimembranosus (SM) and medial gastrocnemius (MG):
  • Panel A: Large cyst - yellow arrows show the "neck" communication connecting the cyst to the knee joint; white arrows show the cyst walls
  • Panel B: Medium-sized cyst with clear neck visible between SM and MG
  • Panel C: Small early cyst - subtle anechoic collection with the characteristic neck
The neck/communication sign between SM and MHG is pathognomonic of a Baker's cyst. Without this communication, consider ganglion cyst or other popliteal mass. (Journal of Ultrasound in Medicine, Elsevier)

Image 4 - Complex Baker's Cyst with Internal Debris (Thick-Walled)

Longitudinal sonogram right popliteal fossa showing thick-walled Baker's cyst with white arrow pointing to internal echogenic debris/loose bodies within the predominantly anechoic fluid
A thick-walled Baker's cyst (arrow) - this is a complex cyst because it has:
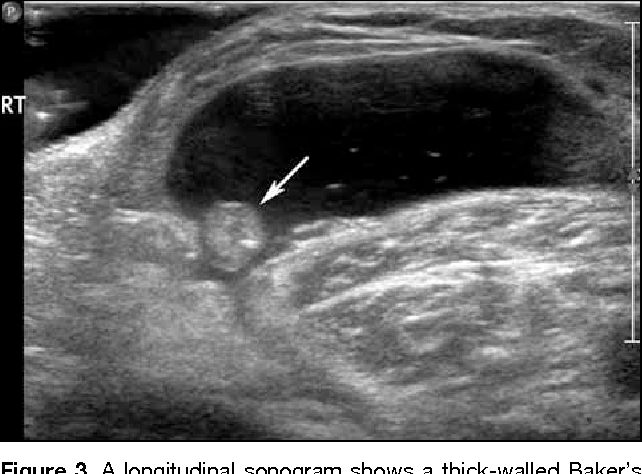
  • Internal echoes / debris (hyperechoic foci within the anechoic fluid)
  • Wall thickening and irregularity
  • Loss of clean posterior wall definition
Complex Baker's cysts occur with inflammatory arthritis (RA, gout), previous hemorrhage, or infection. Detached cartilage fragments (loose bodies) may appear as bright hyperechoic foci with acoustic shadowing.

Image 5 - Intact Baker's Cyst, Right Popliteal Fossa

Popliteal cyst with detached hyperechoic debris floating within - Siemens Healthineers case showing complex Baker's cyst containing particulate matter within anechoic fluid
Complex Baker's cyst with detached hyperechoic debris floating within the anechoic fluid. Hyperechoic particles (bright foci) representing synovial debris, rice bodies (in RA), or cartilaginous loose bodies. These settle dependently and may shift with position - a useful dynamic finding on real-time scanning. Note the well-defined cyst wall. (Siemens Healthineers)

PART 2: Ruptured Baker's Cyst


Image 6 - Ruptured Baker's Cyst: Pointed "Beak" Sign + Leaking Fluid Tracking into Calf

Longitudinal sonogram showing ruptured Baker's cyst: cyst above with pointed inferior "beak" appearance (arrow) and fluid tracking distally into calf muscles below
Complicated Baker's cyst: leakage. A longitudinal sonogram shows:
  • The Baker's cyst body (dark anechoic area upper left)
  • A pointed/beaked inferior margin (arrow) - this is the "beak sign" indicating the cyst has ruptured inferiorly
  • Fluid tracking distally into the calf (dark hypoechoic fluid extending to the right along fascial planes)
This is the classic appearance of rupture - the cyst loses its rounded shape, develops a pointed inferior pole, and fluid dissects into the calf between the gastrocnemius and soleus planes. This is what mimics DVT clinically.

Image 7 - Ruptured Baker's Cyst: Extended Field of View, Popliteal to Mid-Calf

Extended field panoramic ultrasound of right posterior knee showing ruptured Baker's cyst with markedly heterogeneous collapsed cyst body and surrounding fluid tracking along calf
An extended-field-of-view panoramic scan (right posterior knee/calf) showing a ruptured Baker's cyst. The previously well-encapsulated cyst has collapsed with loss of its smooth round contour. The fluid is now heterogeneous (mixed echogenicity from hemorrhage and inflammatory debris) and spreads irregularly through the fascial planes. The surrounding soft tissue shows edematous thickening - explaining the "pseudothrombophlebitis" clinical picture. (LITFL - Life in the Fast Lane)

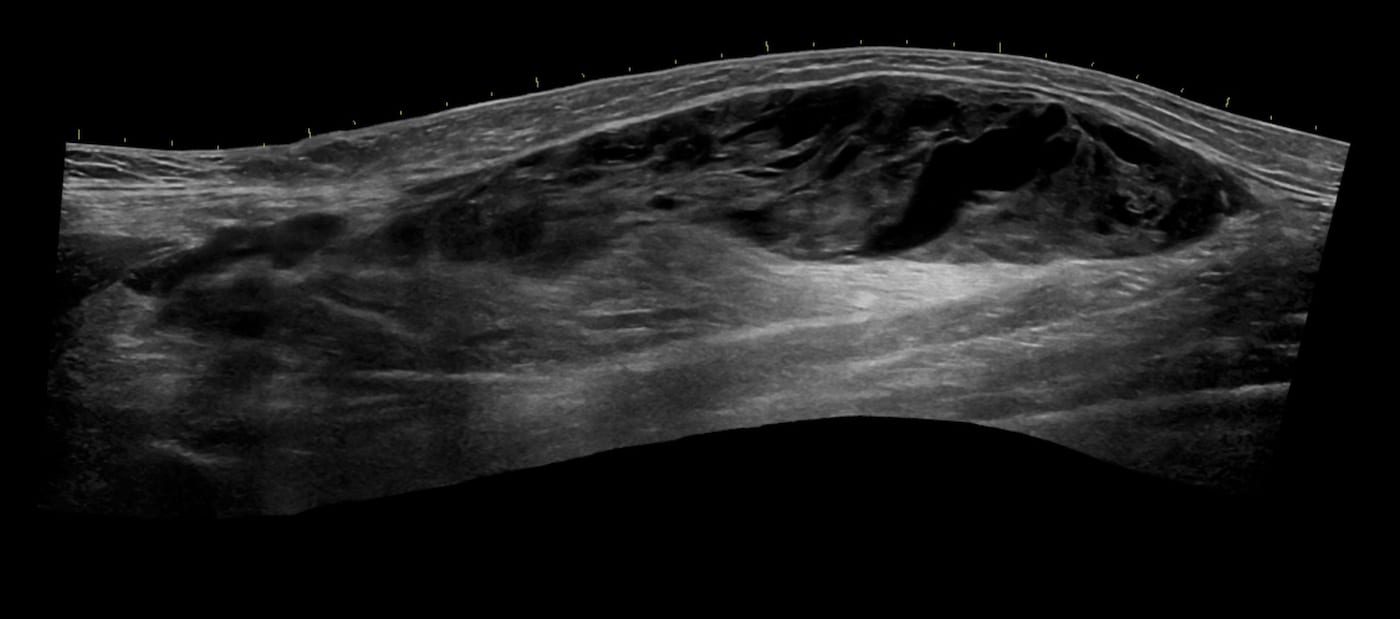
Image 8 - Right Popliteal Fossa: Intact Cyst at Popliteal Level

Right popliteal fossa (RT POP FOSSA) longitudinal ultrasound showing well-defined anechoic oval Baker's cyst with posterior acoustic enhancement and well-defined posterior wall
A classic intact Baker's cyst in the RT POP FOSSA - longitudinal view showing a perfectly defined oval anechoic structure with clean posterior wall and posterior acoustic enhancement. No internal debris. This is the "simple" appearance associated with non-inflammatory effusion (e.g. OA). (Radiopaedia)

Image 9 - Complex Cyst: Bilateral Comparison, Right Knee

Right knee complex Baker's cyst - transverse ultrasound showing anechoic cyst with multiple internal echoes/septa in right posterior knee at approximately 2-4 cm depth
A complex Baker's cyst (RT KNEE) on transverse view with multiple internal septa and heterogeneous content. Internal septations indicate chronic or inflammatory change and thicker fluid (seen in RA, gout, previous hemorrhage). Such septations also predict a higher likelihood of incomplete aspiration and recurrence. (Radiopaedia)

USG Comparison: Intact vs. Ruptured Baker's Cyst

FeatureIntact CystRuptured Cyst
ShapeRound / oval, smooth wallsIrregular, pointed "beak" at inferior pole
MarginsWell-defined, sharpIndistinct, collapsed, irregular
Fluid contentAnechoic (simple) or echogenic (complex)Heterogeneous, mixed echogenicity
LocationConfined to popliteal fossaFluid tracks distally into calf between gastrocnemius and soleus
Posterior enhancementPresent (confirms cystic)Variable - may be lost
Surrounding tissueNormalEdematous, hyperechoic subcutaneous fat
DVT exclusionAdd Doppler of popliteal veinAlways perform - DVT coexists in 10%

Practical USG Protocol

  • Probe: High-frequency linear (10-15 MHz)
  • Position: Patient prone, knee extended; or lateral decubitus
  • Start at: Popliteal fossa in transverse plane - look for cyst between SM tendon and MHG
  • Identify the neck - trace the connection to the knee joint (goes anterosuperiorly)
  • Scan distally if rupture suspected - follow fluid down the calf to the level of the soleus
  • Always add Doppler of the popliteal and proximal calf veins to exclude DVT
  • Dynamic compression - a simple cyst is compressible; a solid mass is not

Sources: Tintinalli's Emergency Medicine; Roberts and Hedges' Clinical Procedures in Emergency Medicine; Firestein & Kelley's Textbook of Rheumatology; Goldman-Cecil Medicine; Radiopaedia; LITFL; Journal of Ultrasound in Medicine

KNEE JOINT EFFUSION,PREPATELLAR AND INFRAPATELLAR BURSITIS USG IMAGES

Finding Sources
Finding Sources
Searching the Web

knee joint effusion prepatellar infrapatellar bursitis ultrasound sonography images suprapatellar recess

Reading File
Reading File
Reading File
Loading Image
Loading Image
Loading Image
Loading Image
!

An error occurred (ValidationException) when calling the ConverseStream operation: The model returned the following errors: messages.13.content.19.image.source.base64.data: At least one of the image dimensions exceed max allowed size for many-image requests: 2000 pixels

We encountered an error while processing your request. Please try again or reach out to us for help.

KNEE JOINT EFFUSION,PREPATELLAR AND INFRAPATELLAR BURSITIS USG IMAGES

!

An error occurred (ValidationException) when calling the ConverseStream operation: The model returned the following errors: messages.13.content.19.image.source.base64.data: At least one of the image dimensions exceed max allowed size for many-image requests: 2000 pixels

We encountered an error while processing your request. Please try again or reach out to us for help.

pre and infrapatellar bursitis usg images

!

An error occurred (ValidationException) when calling the ConverseStream operation: The model returned the following errors: messages.13.content.19.image.source.base64.data: At least one of the image dimensions exceed max allowed size for many-image requests: 2000 pixels

We encountered an error while processing your request. Please try again or reach out to us for help.

This is a shared conversation. Sign in to Orris to start your own chat.