
PCOD medicine
"polycystic ovary syndrome" AND treatment
PCOS polycystic ovary syndrome management treatment diagram
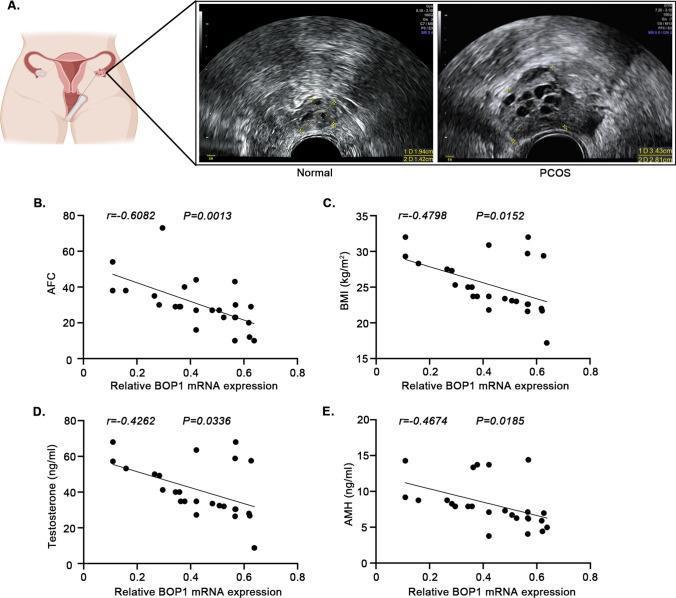
This composite educational graphic illustrates the relationship between BOP1 expression and polycystic ovary syndrome (PCOS). Panel A presents an anatomical diagram of a transvaginal ultrasound procedure alongside two actual ultrasound images comparing a 'Normal' ovary to a 'PCOS' ovary. The PCOS ovary demonstrates classic diagnostic features including enlargement and a 'string of pearls' appearance with multiple peripherally located, small, hypoechoic antral follicles. Panels B through E are scatter plots with linear regression lines showing clinical correlations in PCOS patients. These graphs demonstrate that relative BOP1 mRNA expression in granulosa cells is negatively correlated with four key clinical indicators: Antral Follicle Count (AFC) (r = -0.6082), Body Mass Index (BMI) (r = -0.4798), Serum Testosterone levels (r = -0.4262), and Anti-Müllerian Hormone (AMH) levels (r = -0.4674). All correlations are statistically significant (p < 0.05). This visual data suggests that downregulation of the BOP1 gene is associated with increased severity of PCOS phenotypic markers and hormonal imbalances.
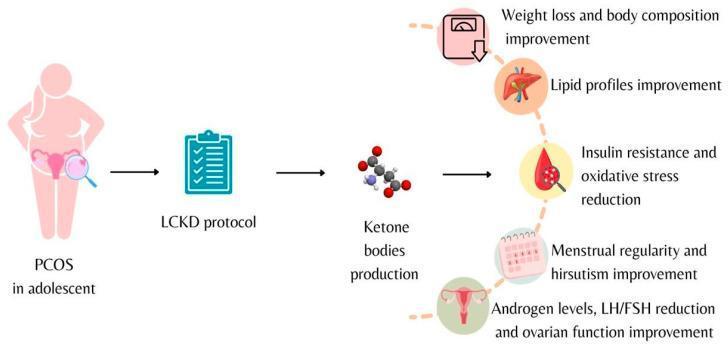
A pathophysiology diagram illustrating the clinical impact of a Low-Calorie Ketogenic Diet (LCKD) protocol on adolescents with Polycystic Ovary Syndrome (PCOS). The schematic follows a linear progression from left to right. It begins with an adolescent figure representing a PCOS diagnosis, highlighting the pelvic region. The next stage depicts the 'LCKD protocol' intervention, which leads to the biochemical phase of 'Ketone bodies production,' represented by a molecular model. The final section branches into multiple physiological benefits, categorized by icons: a scale indicating weight loss and body composition improvement; a liver icon for lipid profile improvement; a blood drop for reduction in insulin resistance and oxidative stress; a calendar for menstrual regularity and hirsutism improvement; and a reproductive system icon for the reduction of androgen levels and LH/FSH ratios, alongside improved ovarian function. This infographic summarizes the multi-systemic metabolic and endocrine benefits of nutritional ketosis in managing PCOS symptoms.
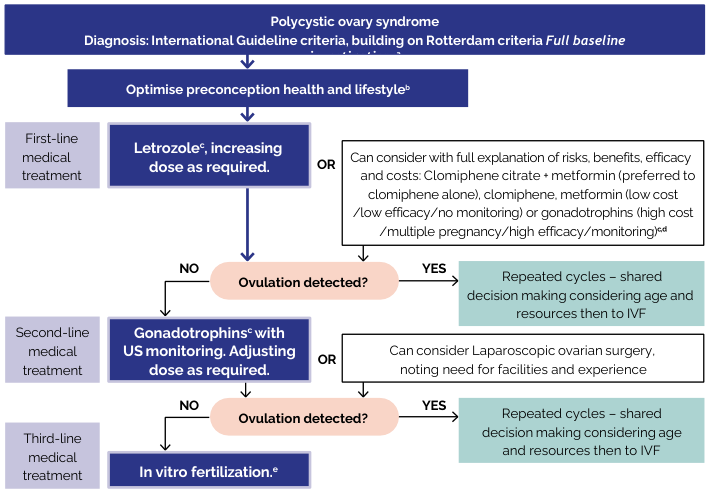
Summary : This flowchart outlines the stepwise medical management of infertility in women with polycystic ovary syndrome (PCOS), based on international guideline criteria and the Rotterdam criteria, including first-, second-, and third-line treatments, decision points, and alternative options. flowchart: # Nodes : • Start (rectangle): "Polycystic ovary syndrome Diagnosis: International Guideline criteria, building on Rotterdam criteria Full baseline assessment including male partner" • Process (rectangle): "Optimise preconception health and lifestyle" • First-line medical treatment (rectangle): "Letrozoleᶜ, increasing dose as required." • Alternative first-line (rectangle): "Can consider with full explanation of risks, benefits, efficacy and costs: Clomiphene citrate + metformin (preferred to clomiphene alone), clomiphene, metformin (low cost /low efficacy/no monitoring) or gonadotrophins (high cost /multiple pregnancy/high efficacy/monitoring)ᶜᵈ" • Decision (diamond): "Ovulation detected?" • If YES (rectangle): "Repeated cycles – shared decision making considering age and resources then to IVF" • If NO (rectangle): "Gonadotrophinsᶜ with US monitoring. Adjusting dose as required." • Alternative second-line (rectangle): "Can consider Laparoscopic ovarian surgery, noting need for facilities and experience" • Second decision (diamond): "Ovulation detected?" • If YES (rectangle): "Repeated cycles – shared decision making considering age and resources then to IVF" • If NO (rectangle): "In vitro fertilization.ᵉ" # Connectors : • Downward arrows connect each step in sequence. • After "Optimise preconception health and lifestyle", two parallel options: "Letrozole" or the alternative first-line box. • Both first-line options lead to the "Ovulation detected?" decision diamond. • "Ovulation detected?" splits: YES to "Repeated cycles..." (right), NO to "Gonadotrophins..." (down). • After "Gonadotrophins...", two parallel options: continue with gonadotrophins or consider laparoscopic surgery. • Both second-line options lead to the second "Ovulation detected?" decision diamond. • Second "Ovulation detected?" splits: YES to "Repeated cycles..." (right), NO to "In vitro fertilization." (down). # Layout : • Vertical flow, with parallel options at first- and second-line treatment steps. • Decision diamonds branch horizontally to YES (right) and NO (down). • Repeated cycles and IVF are terminal nodes. # Analysis : • The flowchart provides a clear, stepwise escalation of infertility treatment in PCOS, starting with lifestyle optimization and letrozole, progressing to gonadotrophins or surgery if ovulation is not detected, and culminating in IVF if prior steps fail. • Decision points are based on ovulation detection, with repeated cycles and shared decision-making emphasized before moving to more invasive or costly interventions. • Alternative options and considerations (e.g., cost, efficacy, monitoring) are explicitly noted for informed patient choice.
PCOD / PCOS Medicines
1. Lifestyle First (Non-Drug, But Mandatory)
2. For Menstrual Regulation and Hyperandrogenism (Not Trying to Conceive)
Combined Oral Contraceptive Pills (OCPs)
- First-line treatment for women not seeking pregnancy
- Increase sex hormone-binding globulin (SHBG), which lowers free androgens
- Reduce hirsutism, acne, and regulate cycles
- Take ~6 months to show full effect on hair/acne
- Use the lowest effective estrogen dose
- Examples: ethinylestradiol + drospirenone, ethinylestradiol + cyproterone acetate (Diane-35), ethinylestradiol + desogestrel
- Harrison's Principles of Internal Medicine 22E, p. 3178
Progestins (Endometrial Protection)
- Medroxyprogesterone acetate 10 mg daily for 10-14 days every 1-3 months
- Progesterone (prometrium) 200 mg daily for 10-14 days every 3 months
- Levonorgestrel IUD (Mirena) - long-acting option
3. For Hyperandrogenism (Hirsutism / Acne) - Add-On After 6 Months
Spironolactone
- Anti-androgen; blocks androgen receptors in hair follicles
- Reduces hirsutism and acne
- Used alongside OCP (must not be taken without contraception - risk of feminizing a male fetus)
Flutamide
- Another anti-androgen option
- Less commonly used due to liver toxicity risk
Finasteride
- 5-alpha reductase inhibitor; reduces DHT (active androgen in skin)
- Used off-label for hirsutism
4. For Insulin Resistance and Metabolic Management
Metformin
- Biguanide, primarily an insulin sensitizer
- Reduces insulin resistance, lowers androgens indirectly, may restore ovulation
- Recommended for overweight/obese PCOS women for cardiometabolic risk reduction
- Not first-line for endometrial protection or hyperandrogenism alone
- Doses: 500 mg three times daily, or 850-1000 mg twice daily (start low, increase gradually)
- Extended-release formulation causes less GI upset
- Avoid in hepatic/renal dysfunction
- Berek & Novak's Gynecology, p. 2053
GLP-1 Receptor Agonists (e.g., Semaglutide, Liraglutide)
- Newer option for obese PCOS women
- A 2024 meta-analysis (PMID: 39178623) confirmed GLP-1 agonists promote weight loss and improve hormonal regulation in PCOS women with obesity
Inositol (Myo-inositol / D-chiro-inositol)
- Nutraceutical with insulin-sensitizing properties
- Improves menstrual regularity, reduces androgens, supports ovulation
- Well tolerated; often used alongside metformin or alone in mild cases
5. For Fertility / Ovulation Induction
Step 1 - Letrozole (Aromatase Inhibitor) - First-Line
- Blocks estrogen production, stimulates FSH release, promotes ovulation
- Better live birth rates than clomiphene in PCOS
- Harrison's Principles of Internal Medicine 22E, p. 3178
Step 2 - Clomiphene Citrate (SERM)
- Selective estrogen receptor modulator
- Long-standing standard; still widely used
- Give cycle days 3-7 or 5-9
- Clomiphene + metformin preferred over clomiphene alone in some guidelines
Step 3 - Injectable Gonadotropins (FSH/LH)
- For clomiphene/letrozole-resistant cases
- Requires ultrasound monitoring (risk of ovarian hyperstimulation syndrome - OHSS)
- Berek & Novak's Gynecology
Step 4 - Laparoscopic Ovarian Drilling (LOD)
- Surgical (not a drug) but listed here as it's an alternative second-line option to gonadotropins
Step 5 - IVF
- If all above fail
6. Summary Table
| Goal | Drug Category | Examples |
|---|---|---|
| Regulate cycles / reduce androgens | Combined OCP | Diane-35, Yasmin, Mercilon |
| Endometrial protection | Progestins | Medroxyprogesterone, Levonorgestrel IUD |
| Hirsutism / acne (add-on) | Anti-androgens | Spironolactone, Flutamide |
| Insulin resistance / metabolic | Biguanide | Metformin |
| Obesity + PCOS | GLP-1 agonist | Semaglutide, Liraglutide |
| Ovulation induction (1st line) | Aromatase inhibitor | Letrozole |
| Ovulation induction (2nd line) | SERM | Clomiphene citrate |
| Ovulation induction (3rd line) | Gonadotropins | FSH injections (Gonal-F, Follistim) |
- All medications should be prescribed by a gynecologist or endocrinologist after proper evaluation (hormonal panel, ultrasound, metabolic screen)
- PCOS management is long-term; lifestyle changes must accompany any drug treatment
- Screening for hypertension, diabetes, depression, and dyslipidemia is recommended at diagnosis and at regular intervals