
Htn retinopathy
hypertensive retinopathy fundus changes
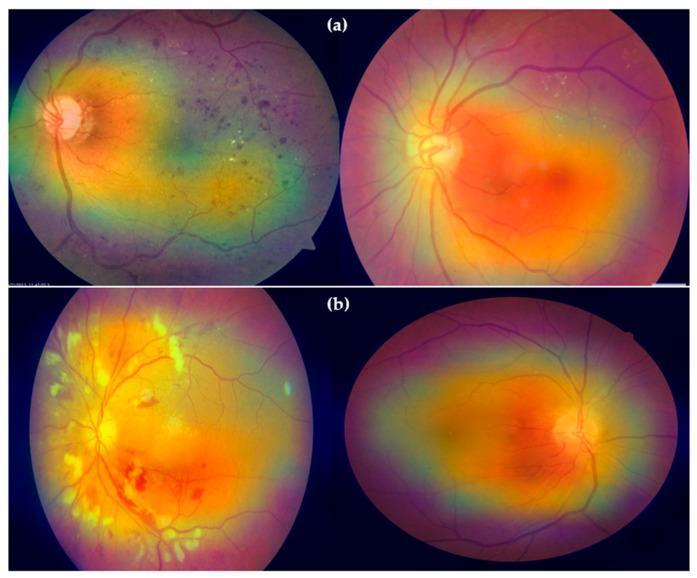
This diagnostic image displays four digital color fundus photographs with Grad-CAM heatmap overlays used for the automated classification of retinal pathologies. The images are organized into two rows: (a) Diabetic Retinopathy (DR) and (b) Hypertensive Retinopathy (HR). In the DR row, the fundus images demonstrate characteristic clinical signs including microaneurysms, intraretinal hemorrhages, and hard exudates. The heatmap overlays (red and orange zones) concentrate on these focal lesions and the macula, indicating the diagnostic importance of microvascular damage in DR. In the HR row, the retina exhibits signs of vascular hypertensive changes such as arteriolar narrowing, increased vascular tortuosity, and flame-shaped hemorrhages. The corresponding heatmaps show a more diffuse distribution, primarily following the course of the major retinal vessels and the optic disc, reflecting the systemic vascular impact of hypertension on the retinal architecture. This comparison illustrates how deep learning models utilize localized lesion detection for diabetic retinopathy versus broader vascular pattern recognition for hypertensive retinopathy.
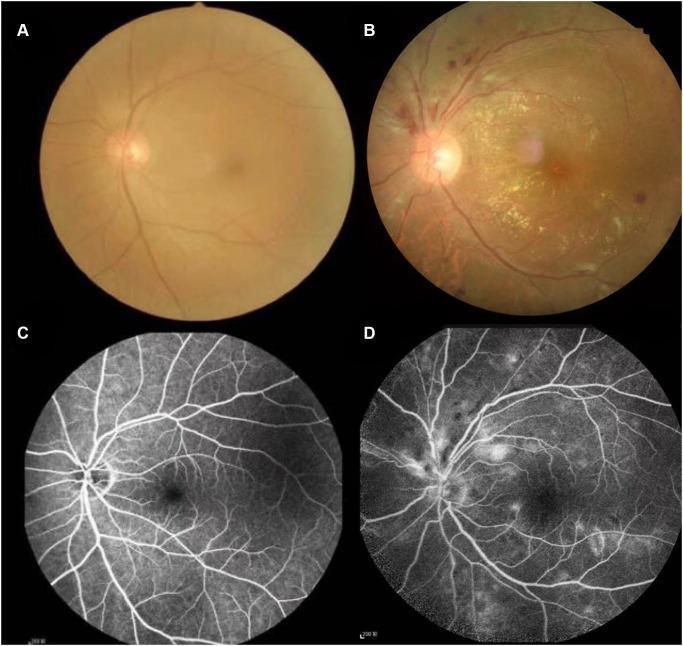
Comparison of color fundus photography and fluorescein fundus angiography (FFA) between healthy individuals and patients with hypertensive retinopathy (HR). Panels A and B are color fundus photographs; Panel A displays a healthy retina with clear vessel margins and an even fundus appearance, while Panel B demonstrates severe hypertensive retinopathy features including retinal hemorrhages, hard exudates (yellowish deposits), cotton-wool spots, and retinal edema. Panel B also shows vascular signs of arteriosclerosis such as arteriolar narrowing (stenosis), increased vessel wall light reflex, and arteriovenous (A/V) crossing changes. Panels C and D provide the corresponding FFA images. Panel C illustrates normal, uniform vascular filling and intact blood-retinal barriers. Panel D shows pathologic findings in a patient with HR, characterized by irregular vascular filling, diffuse fluorescein leakage indicative of compromised vessel integrity, and areas of capillary non-perfusion. This clinical comparison highlights the diagnostic landmarks used by ophthalmologists to grade the severity of hypertensive microvascular damage.
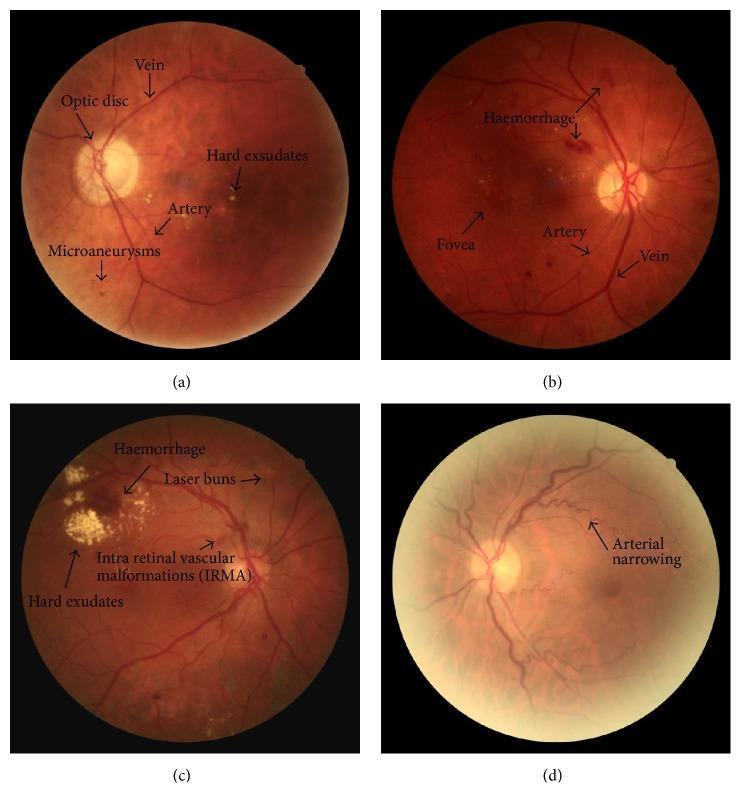
A multi-panel diagnostic image comprising four nonmydriatic fundus photographs (a-d) illustrating various stages of retinopathy. (a) Mild nonproliferative diabetic retinopathy (NPDR) with hypertensive features, showing discrete microaneurysms and scattered yellowish hard exudates. (b) Moderate NPDR characterized by a prominent intraretinal hemorrhage located superior to the optic disc and foveal region. (c) Proliferative diabetic retinopathy (PDR) following treatment, demonstrating characteristic laser photocoagulation burns, intraretinal microvascular abnormalities (IRMA), persistent hard exudates, and localized hemorrhage. (d) Grade I hypertensive retinopathy, primarily highlighting generalized arterial narrowing and vascular tortuosity. The images provide a clinical comparison of vascular changes, exudative processes, and sequelae of retinal ischemia and hypertension. Key anatomical landmarks including the optic disc, retinal arteries, veins, and fovea are annotated throughout the set to facilitate identification of pathological distributions.
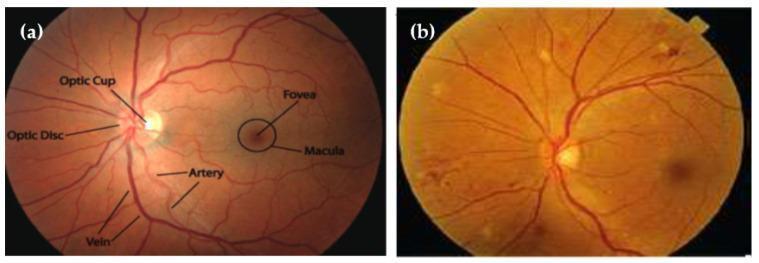
This comparison chart features two retinal fundus images used for the diagnostic assessment of hypertensive retinopathy. Image (a) depicts a normal retinal fundus with clearly labeled anatomical structures, including the optic disc, optic cup, fovea, and macula. The vasculature displays healthy arteriolar and venous distribution with distinct margins and normal caliber. In contrast, image (b) illustrates manifestations of hypertensive retinopathy. This diagnostic image shows characteristic microvascular abnormalities, including generalized arteriolar narrowing and the presence of scattered clinical lesions. Distinctive visual features in the pathological image include light-yellow, irregularly shaped cotton-wool spots or hard exudates across the retinal surface and a more muted, orange-yellow fundus background. These visuals serve as educational material for ophthalmology and internal medicine, highlighting the ocular impact of systemic hypertension. Key educational concepts include the identification of normal retinal landmarks versus pathological signs such as vascular wall changes and exudative lesions used in clinical staging and computer-aided diagnosis (CAD).
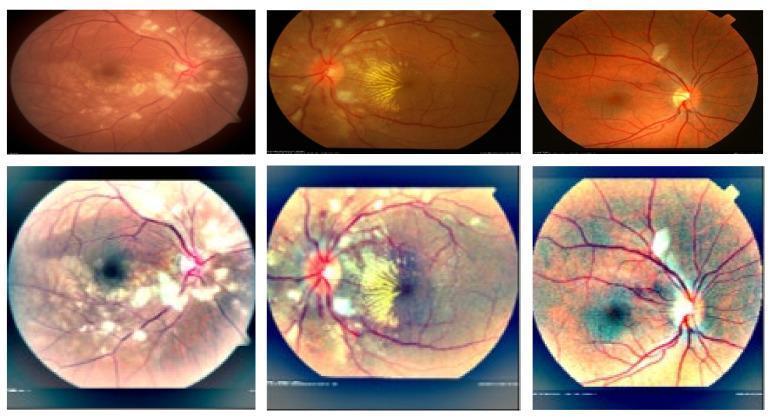
This Comparison Chart displays two rows of diagnostic retinal fundus images (retinographs) illustrating a pre-processing step for clinical imaging enhancement. The top row consists of original fundus photographs exhibiting clinical signs of malignant hypertensive retinopathy, characterized by scattered cotton-wool spots (whitish, irregularly shaped lesions), macular stars (yellowish exudates in a radial pattern), and arteriolar changes. These original images demonstrate lower contrast and muted color balance, which can obscure subtle pathological features. The bottom row presents the same images after light adjustment and contrast enhancement in a perceptual-oriented color space. These enhanced versions show significantly improved clarity of retinal structures, including sharper delineation of the retinal vasculature, the optic disc, and the boundaries of cotton-wool spots. This visual comparison highlights the educational concept of digital image processing in ophthalmology to improve the diagnostic visibility of hypertensive retinopathy features such as microvascular disorders and inflammatory exudates.
hypertensive retinopathy classification grading
Hypertensive Retinopathy
Pathophysiology
- Vasoconstriction - autoregulatory arteriolar spasm to protect the capillary bed
- Arteriosclerosis - intimal thickening, hyaline degeneration, and medial wall changes (chronic)
- Breakdown of blood-retinal barrier - in acute/malignant phase, fibrinoid necrosis leads to leakage and ischemia
Fundus Signs
Chronic (long-standing) HTN
| Finding | Description |
|---|---|
| Arteriolar narrowing | Generalized or focal; earliest sign |
| AV nicking ("nipping") | Compression of vein at arteriovenous crossing |
| "Copper wiring" | Increased arteriolar light reflex, orange-red appearance |
| "Silver wiring" | Dense wall opacity; vessel lumen barely visible |
| Flame-shaped hemorrhages | Along nerve fiber layer |
| Cotton-wool spots (CWSs) | Nerve fiber layer infarcts |
| Hard exudates | Lipid deposits from leaky vessels |
| Arterial macroaneurysms | Focal outpouchings |
| Central/branch retinal vein or artery occlusion | Complication of arteriosclerosis |
Acute ("Malignant") / Accelerated HTN
- Hard exudates in a "macular star" configuration
- Retinal edema, CWSs, flame hemorrhages
- Optic disc edema (papilledema) - hallmark of grade 4 / hypertensive emergency
- Rarely: serous retinal detachment, vitreous hemorrhage
- Elschnig spots - focal choroidal infarcts appearing as black spots with yellow haloes; sign of past hypertensive crisis
- Siegrist streaks - linear flecks along choroidal vessels; indicate fibrinoid necrosis in malignant hypertension
Classification / Grading
Keith-Wagener-Barker (Modified) - Hypertensive Retinopathy Scale
| Grade | Features |
|---|---|
| 1 | Generalized attenuation of retinal arterioles |
| 2 | More pronounced + focal arteriolar attenuation |
| 3 | Grade 2 + retinal exudates, cotton-wool spots, hemorrhages |
| 4 | Grade 3 + papilledema |
Grades 1-2 = chronic hypertension; Grades 3-4 = hypertensive emergency/urgency
Scheie's Arteriosclerotic Scale
| Grade | Features |
|---|---|
| 1 | Broadening of arteriolar reflex, minimal AV crossing defects |
| 2 | Increased arteriolar light reflex + AV crossing changes |
| 3 | Copper wire arterioles + marked AV crossing changes |
| 4 | Silver wire arterioles + severe AV crossing changes |
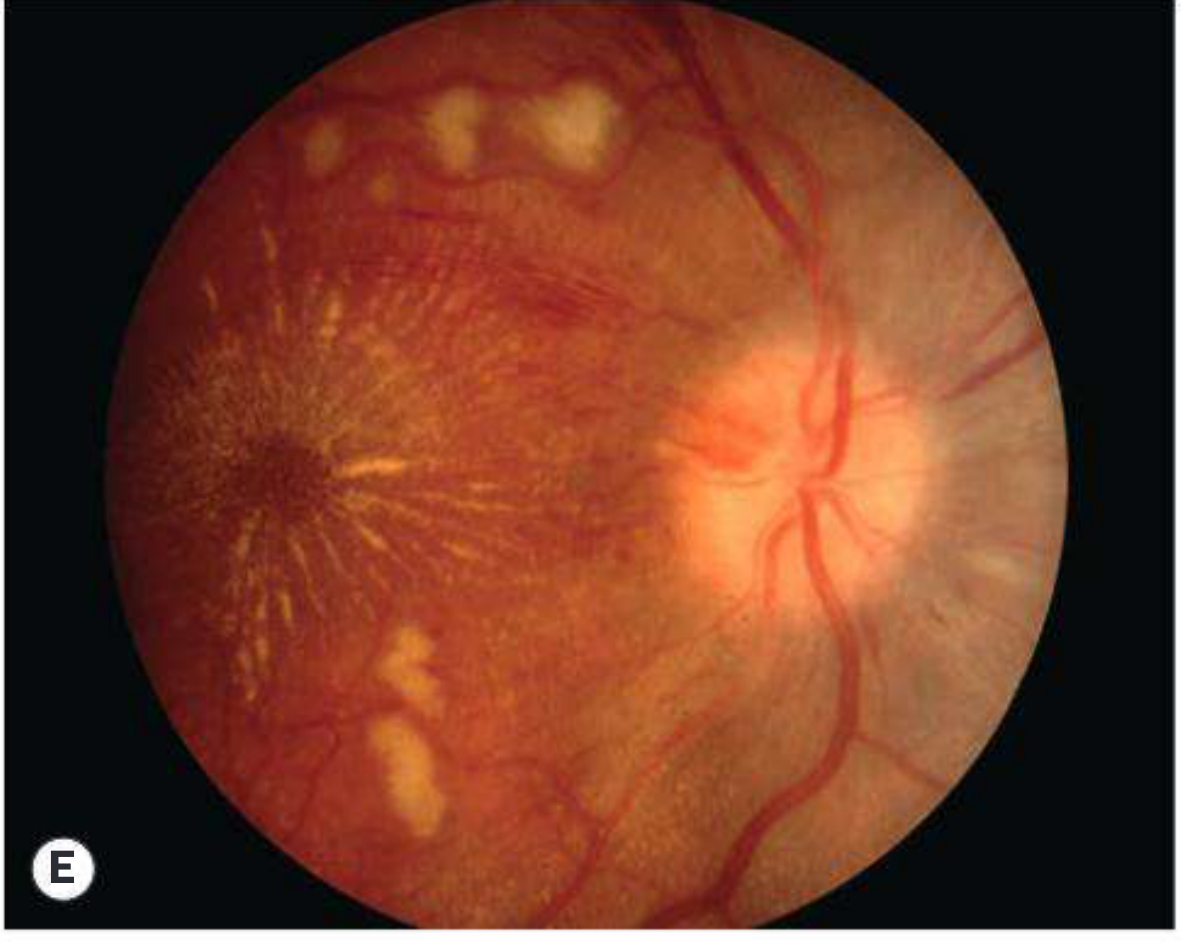
Fundus Images

Differential Diagnosis
| Condition | Distinguishing Feature |
|---|---|
| Diabetic retinopathy | Dot-blot hemorrhages, microaneurysms common, crosses horizontal raphe; vessel attenuation less prominent |
| CRVO/BRVO | Usually unilateral; massive hemorrhages, dilated tortuous veins |
| Collagen vascular disease | Multiple CWSs but fewer other HTN features |
| Anemia | Predominantly hemorrhages; few arterial changes |
| Radiation retinopathy | History of irradiation |
Note: When HTN retinopathy appears unilateral, suspect ipsilateral carotid artery stenosis - the affected side has reduced perfusion pressure and is "protected" from hypertensive damage, while the contralateral (normal-appearing) eye has normal carotid flow and shows retinopathy.
Etiology
- Primary HTN - no identifiable cause (most common)
- Secondary HTN - preeclampsia/eclampsia, pheochromocytoma, renal disease, adrenal disease, aortic coarctation
Workup
- History: known HTN, diabetes, radiation exposure
- Check blood pressure immediately
- Complete dilated fundus examination
- Urgent referral if: systolic BP ≥180 mmHg, diastolic BP ≥110 mmHg, or symptoms (chest pain, dyspnea, headache, altered consciousness, blurred vision + disc swelling) - these require immediate medical attention
- Workup for secondary hypertension if indicated
Preclinical Markers (Kanski)
- Reduced arteriolar calibre - early pre-hypertensive sign; prompts BP monitoring
- Wider venular calibre - relatively specific for impaired glucose metabolism
- Low arteriolar + high venular calibre = markers of preclinical cardiovascular disease
Treatment & Follow-Up
- Treat the systemic hypertension (per internist/cardiologist)
- Retinal changes are generally reversible with BP control in early/moderate grades
- Grade 4 (papilledema) = hypertensive emergency requiring immediate BP lowering
- Follow-up: every 2-3 months initially, then every 6-12 months
- The Wills Eye Manual, 7th Ed. - Section 11.10
- Kanski's Clinical Ophthalmology, 10th Ed. - Section 13 (Retinopathy)
- Textbook of Family Medicine, 9th Ed. - eAppendix 17-4
- Comprehensive Clinical Nephrology, 7th Ed. - Fig. 35.6