
Mechanism of action of acetazolamide
acetazolamide mechanism of action carbonic anhydrase inhibitor diagram
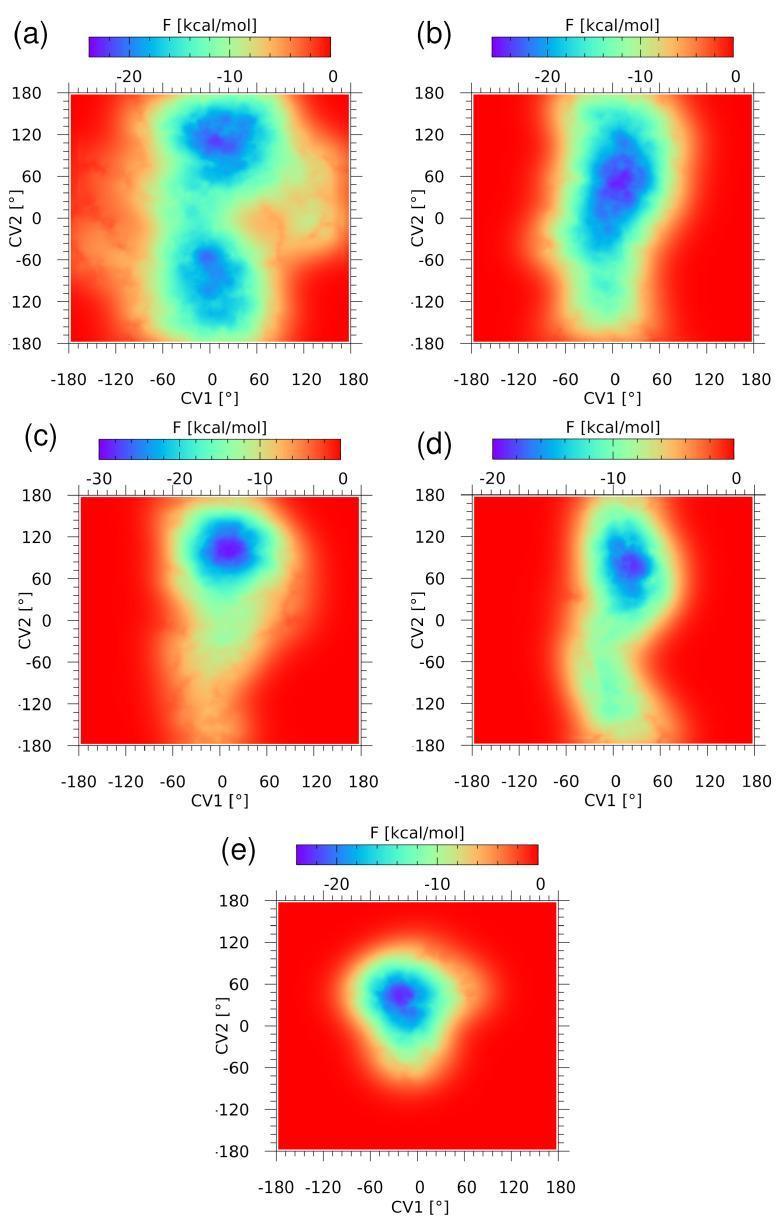
This figure presents five 2D free energy (F) surface plots (a-e) derived from metadynamics simulations, illustrating the conformational energetics of the drug acetazolamide (AZM) in varying states of binding site entrapment. Acetazolamide is a carbonic anhydrase IX (CA IX) inhibitor used in treating glaucoma and studied for its role in tumor hypoxia. Each subplot maps free energy (kcal/mol) across two collective variables: CV1 (S1-C2-N4-C1 dihedral angle) and CV2 (S1-C3-S2-O2B dihedral angle), both ranging from -180° to 180°. A color scale indicates free energy levels, where blue represents stable low-energy minima and red indicates high-energy states. Plot (a) shows the isolated AZM molecule with two distinct minima. Progression through (b) AZM-T, (c) AZM-TT, (d) AZM-TTL, to (e) AZM-TTLH demonstrates a gradual coalescence and narrowing of these minima into a single, highly localized well. This visual progression represents the restriction of the ligand's conformational freedom and the stabilization of specific intramolecular chalcogen and hydrogen bonds as it becomes increasingly constrained within the CA IX mimic binding pocket, relevant for rational drug design targeting tumor metastasis.
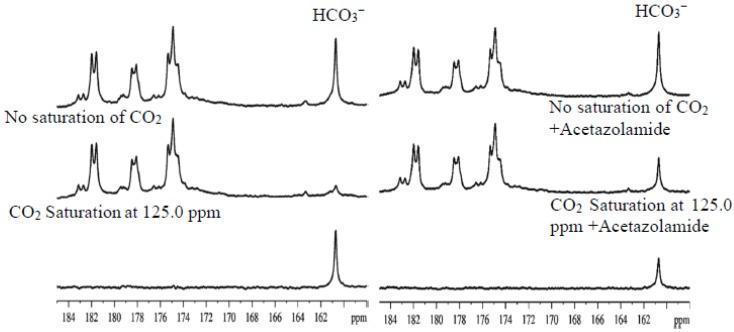
This diagnostic image displays in vivo 13C Magnetic Resonance Spectroscopy (MRS) spectra obtained from a rat brain model, illustrating the magnetization transfer effect between carbon dioxide (CO2) and bicarbonate (HCO3-). The figure is divided into two columns: the left side shows baseline conditions, and the right side shows results after the administration of Acetazolamide, a carbonic anhydrase inhibitor. In both columns, three traces are shown: a control 'No saturation' spectrum (top), a 'CO2 Saturation' spectrum at 125.0 ppm (middle), and a 'Difference' spectrum (bottom). In the baseline state, saturating the CO2 signal causes a significant reduction in the bicarbonate peak at ~161 ppm, indicating rapid enzymatic interconversion. Conversely, the right column demonstrates that Acetazolamide markedly reduces this saturation transfer effect, visible as a much smaller difference peak. This comparison highlights the role of carbonic anhydrase in facilitating CO2-bicarbonate exchange and demonstrates how MRS can quantify enzymatic activity and pharmacological inhibition in vivo.
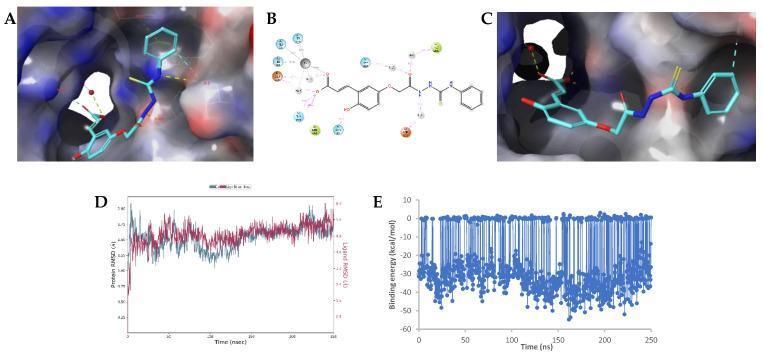
This composite image illustrates molecular modeling and simulation data for a potential human Carbonic Anhydrase (hCA) inhibitor. Panels A and C present 3D molecular surface representations of the ligand 14a-(E)-open docked within the protein binding pocket, showing the initial pose and the state after 250 ns of Molecular Dynamics (MD) simulation, respectively. The surfaces are color-coded by electrostatic and hydrophobic properties (red for anionic, purple for cationic, green for hydrophobic). Panel B is a 2D ligand-protein interaction diagram detailing specific residue contacts, including hydrogen bonds (purple dashed lines) with residues such as Thr199 and Gln92. Panel D provides a line graph of the Root Mean Square Deviation (RMSD) for protein Cα-atoms and ligand heavy atoms over 250 ns, indicating structural stability of the protein and conformational flexibility of the ligand. Panel E displays a scatter plot of MM-GBSA binding energy (kcal/mol) over the simulation time, demonstrating the thermodynamic profile of the binding event. These data are typical for pharmaceutical research into CA IX inhibitors used in oncology or metabolic studies.
Mechanism of Action of Acetazolamide
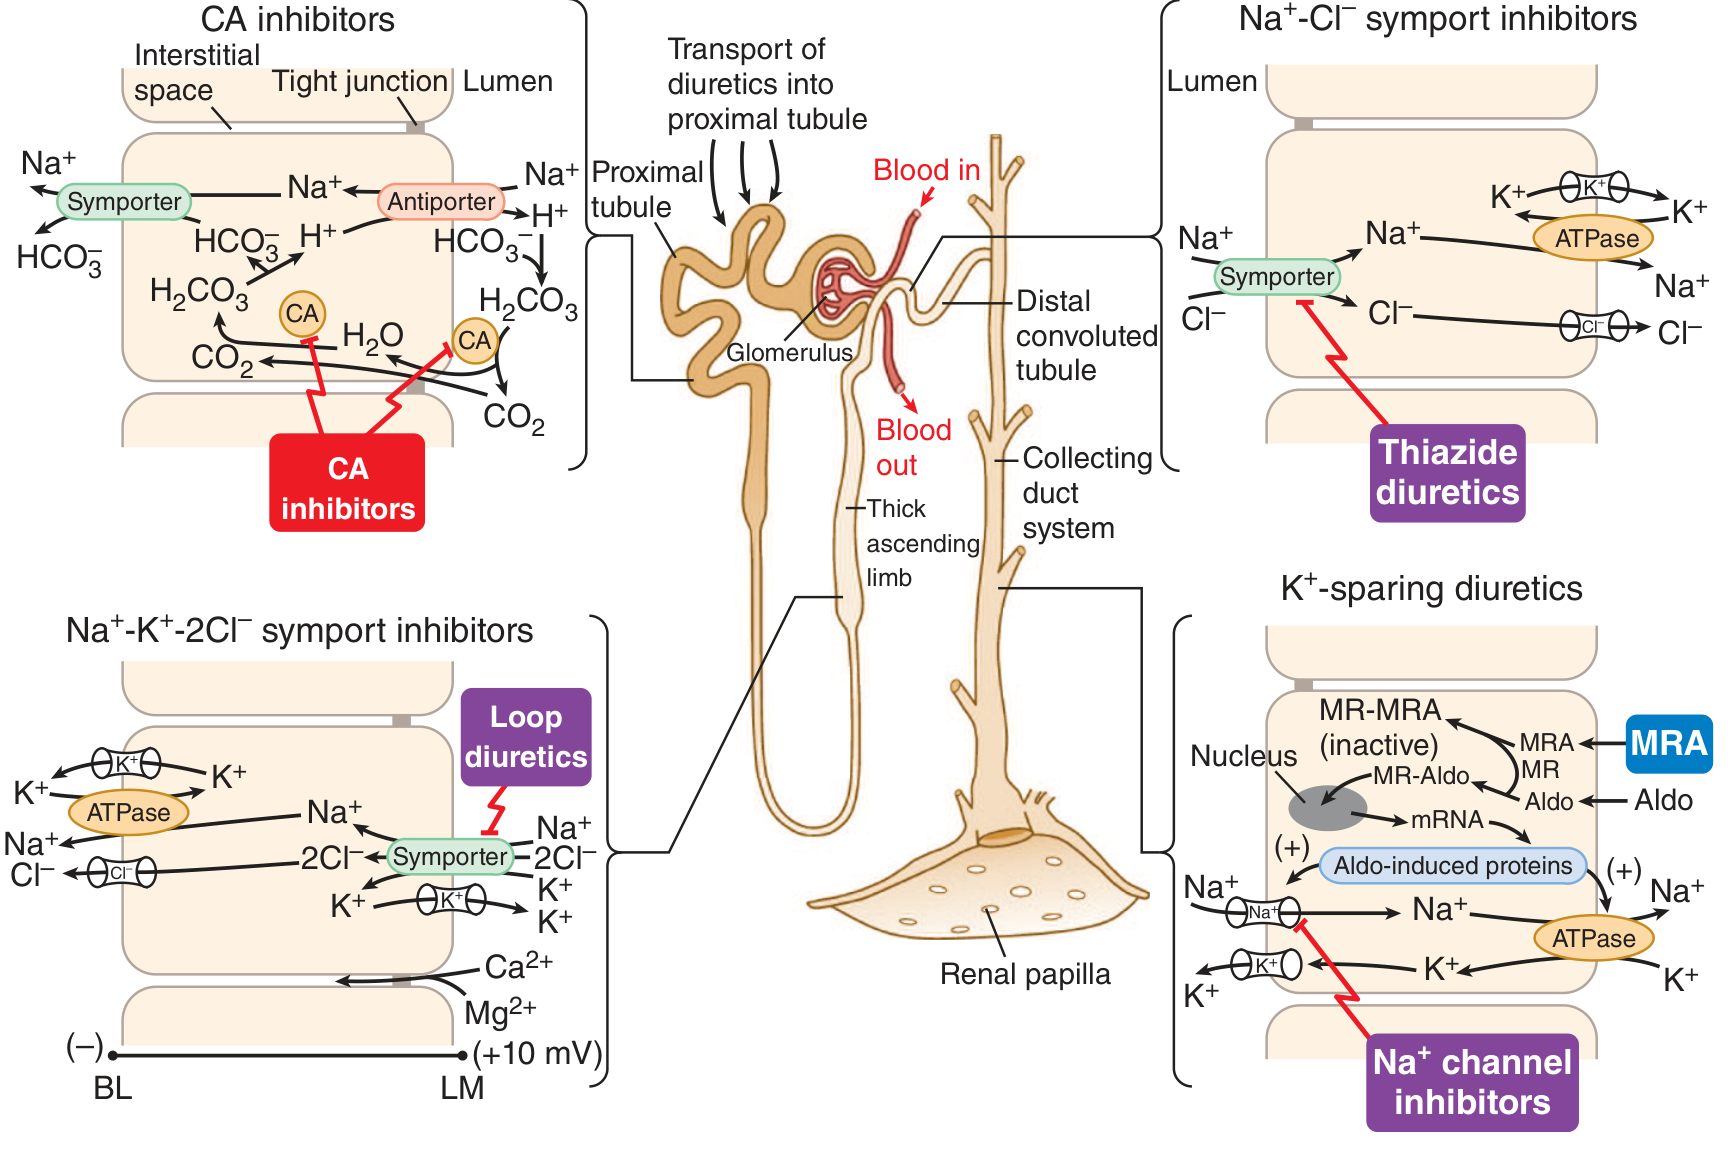
Step-by-Step Molecular Mechanism (Proximal Convoluted Tubule)
- Luminal side: H+ is secreted into the tubular lumen via the Na+/H+ antiporter (NHE3). In the lumen, this H+ combines with filtered HCO3- to form H2CO3.
- Luminal CA (CA IV) catalyzes the dehydration of H2CO3 → CO2 + H2O. CO2 diffuses freely across the apical membrane into the epithelial cell.
- Intracellular CA (CA II) catalyzes the reverse reaction: CO2 + H2O → H2CO3 → H+ + HCO3-. The H+ is recycled back to the lumen (step 1), while HCO3- exits via the basolateral Na+/HCO3- symporter into the interstitium - effectively reabsorbing NaHCO3.
- H2CO3 cannot be dehydrated in the lumen → H+ and HCO3- accumulate in the lumen → less H+ is recycled back → the Na+/H+ exchanger slows down → less Na+ reabsorption
- Intracellular CO2 cannot be rehydrated → less intracellular H+ generated → basolateral HCO3- export decreases
- Net result: NaHCO3 is not reabsorbed and is excreted in the urine
At maximal dosing, ~85% of the proximal tubule's HCO3- reabsorptive capacity is inhibited, but only ~45% of whole-kidney HCO3- reabsorption overall (as HCO3- is partially rescued downstream by CA-independent mechanisms). - Katzung's Basic and Clinical Pharmacology, 16e, p. 402
Downstream Consequences
| Effect | Mechanism |
|---|---|
| Bicarbonate diuresis | HCO3- retained in lumen obligates Na+, K+ and water excretion |
| Hyperchloremic metabolic acidosis | Loss of HCO3- depletes body buffer; Cl- is retained to maintain electronegativity |
| Urine alkalinization (pH ~8) | HCO3- is a base; urinary pH rises |
| Hypokalemia | Increased distal Na+ delivery → enhanced K+ secretion |
| Loss of diuretic efficacy over days | Plasma HCO3- depletion reduces filtered HCO3- load; NaCl reabsorption compensates |
Extra-Renal Mechanisms
- Direct inhibition of CA in CNS neurons
- Induced metabolic acidosis itself has anticonvulsant properties (used in absence seizures)
- Induces mild metabolic acidosis → stimulates peripheral chemoreceptors → increases ventilation → raises PaO2 at altitude
- Also increases the gradient for CO2 in peripheral tissues
- Inhibits CA in red blood cells → CO2 accumulates in peripheral tissues, and less CO2 is expired → respiratory stimulation
- Opens Ca2+-activated K+ channels → vasodilation (clinical significance unclear)
Summary Table
| Property | Detail |
|---|---|
| Drug class | Carbonic anhydrase inhibitor (sulfonamide derivative) |
| Enzyme inhibited | Carbonic anhydrase (CA II cytoplasmic + CA IV membrane-bound) |
| Primary site of action | Proximal convoluted tubule (also collecting duct) |
| Ion effects | ↑ HCO3- excretion, ↑ Na+ excretion, ↑ K+ excretion, ↓ Cl- excretion |
| Acid-base | Hyperchloremic metabolic acidosis |
| Urine pH | Alkaline (↑ to ~8) |
| Body pH | Decreases (acidosis) |
In flow chat
A detailed medical flowchart showing the mechanism of action of acetazolamide (carbonic anhydrase inhibitor) in the proximal convoluted tubule. The flowchart should show: 1) Acetazolamide inhibits Carbonic Anhydrase (CA II and CA IV), 2) Luminal side: H2CO3 cannot be dehydrated to CO2 + H2O, 3) Intracellular: CO2 cannot be rehydrated to H+ + HCO3-, 4) Na+/H+ antiporter (NHE3) slows down, 5) Less Na+ and HCO3- reabsorbed, 6) HCO3- stays in tubular lumen, 7) HCO3- diuresis with Na+, K+, and water, 8) Downstream effects branching out: Metabolic acidosis (loss of HCO3-), Urine alkalinization (pH ~8), Hypokalemia (increased distal Na+ delivery), Reduced IOP (ciliary body CA inhibition), Anticonvulsant effect (CNS CA inhibition), High-altitude sickness relief (stimulates ventilation via acidosis). Use color-coded boxes: red for inhibition steps, blue for normal physiology, green for clinical effects. Clean professional medical diagram style with arrows connecting each step.
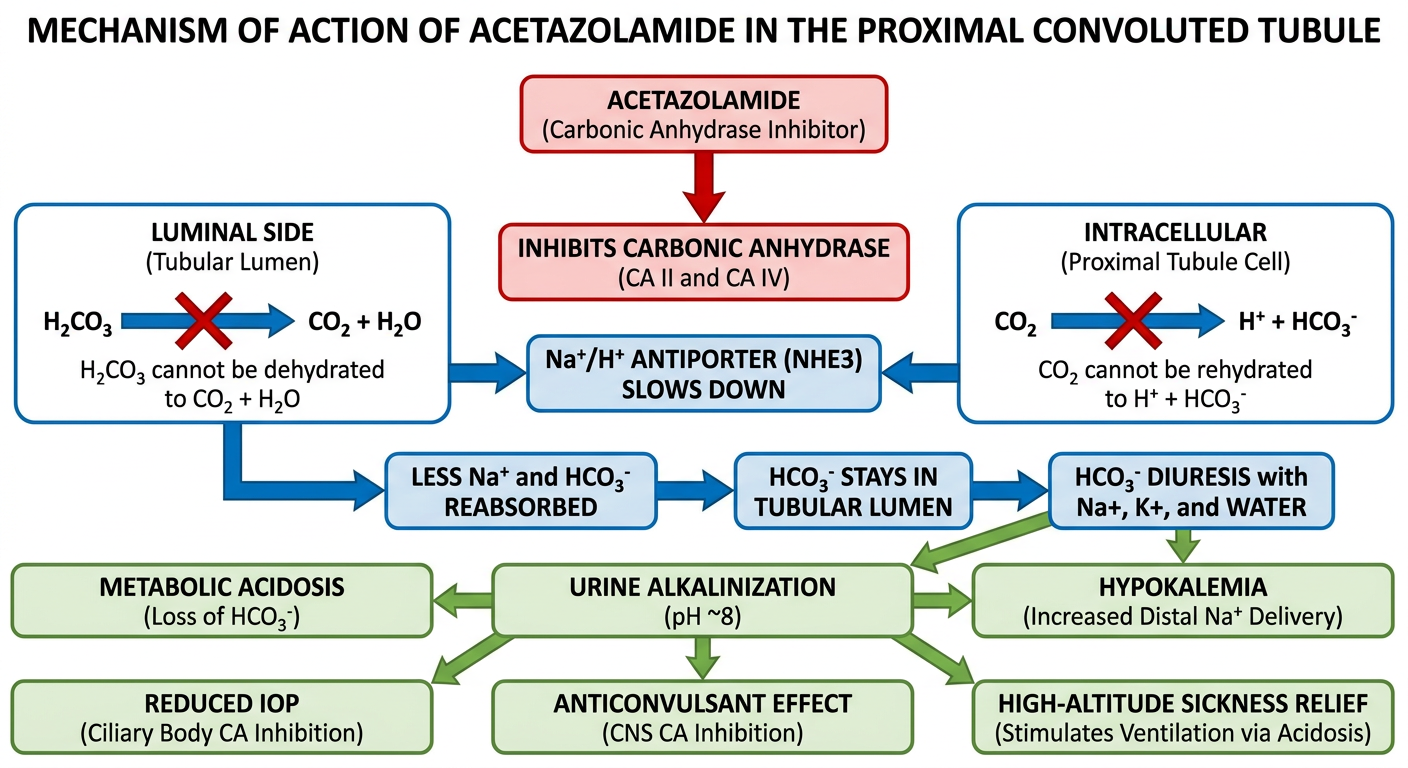
- Acetazolamide inhibits CA II (cytoplasmic) and CA IV (luminal membrane)
- Luminal: H2CO3 accumulates (not converted to CO2 + H2O)
- Intracellular: CO2 not rehydrated → less H+ and HCO3- generated
- Na+/H+ exchanger (NHE3) slows → reduced Na+ reabsorption
- HCO3- stays in the tubular lumen → HCO3- diuresis with Na+, K+, and water
- Hyperchloremic metabolic acidosis - body loses HCO3- (base)
- Alkaline urine (pH ~8)
- Hypokalemia - increased distal Na+ delivery drives K+ secretion
- Reduced IOP - inhibits CA in ciliary processes → less aqueous humor
- Anticonvulsant - direct CNS CA inhibition + acidosis
- High-altitude relief - acidosis stimulates ventilation → raises PaO2
MOA OF MANNITOL
A detailed medical flowchart showing the complete mechanism of action of Mannitol (osmotic diuretic). The flowchart should have two main branches clearly separated: BRANCH 1 - RENAL (DIURETIC) MECHANISM: Start: Mannitol given IV → Freely filtered at glomerulus → NOT reabsorbed by tubules → Increases osmolarity of tubular fluid → Opposes passive water reabsorption in Proximal Convoluted Tubule → Same effect in Loop of Henle (impairs water and solute reabsorption) → Also washes out medullary hypertonicity (reduces concentrating ability) → Result: Large volume of dilute urine (water diuresis > solute diuresis), increased Na+ excretion at high doses BRANCH 2 - VASCULAR / SYSTEMIC MECHANISM: Start: Mannitol given IV → Raises plasma osmolality → Osmotic gradient draws water from intracellular and interstitial compartments into blood → Reduces cerebral edema → Reduces intracranial pressure (ICP) → Also reduces intraocular pressure (IOP) by drawing fluid from vitreous humor ADDITIONAL EFFECTS BOX at bottom: - Increases renal blood flow (RBF) - Stimulates vasodilating prostaglandins - Free radical scavenger - Expands plasma volume transiently Use color coding: blue boxes for steps, red for inhibition/osmotic barrier, green for clinical outcomes (↓ICP, ↓IOP, ↑urine output). Arrows connecting each step. Clean, professional medical diagram style. Title at top: MECHANISM OF ACTION OF MANNITOL.
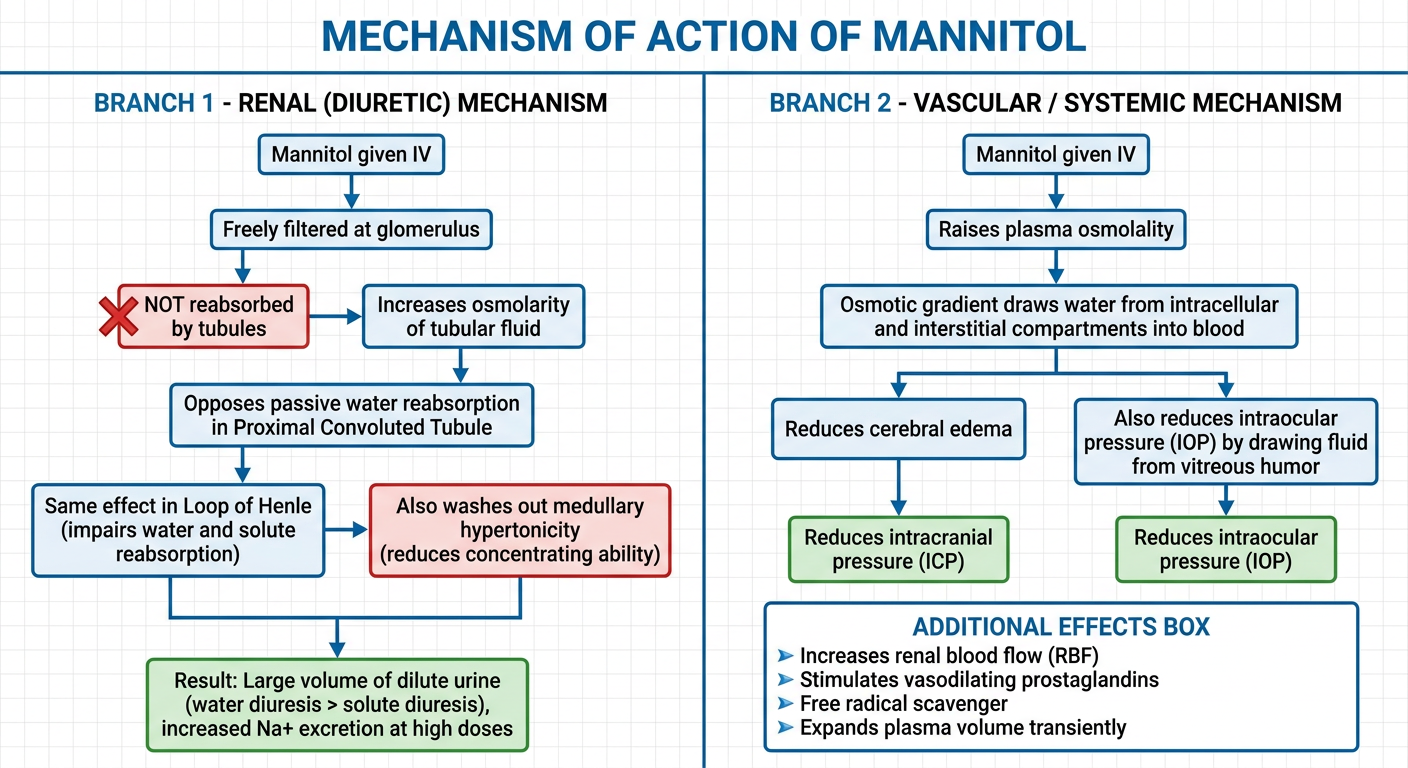
Mechanism of Action of Mannitol
Branch 1 - Renal (Diuretic) Mechanism
| Step | What happens |
|---|---|
| IV administration | Mannitol distributed in extracellular fluid only |
| Glomerular filtration | Freely filtered - not bound to plasma proteins |
| Tubular handling | NOT reabsorbed (no transporter for it) |
| PCT effect | Raises tubular fluid osmolarity → opposes passive water reabsorption that normally follows Na+ |
| Loop of Henle | Same osmotic effect impairs water AND solute reabsorption |
| Medullary washout | Increased RBF washes out medullary hypertonicity → impairs urine concentrating ability |
| Final result | Large volume of hypotonic urine (water loss > solute loss) |
At high doses, mannitol also increases Na+, K+, Ca2+, Mg2+, Cl-, and phosphate excretion. - Morgan & Mikhail's Clinical Anesthesiology, 7e
Branch 2 - Vascular / Systemic Mechanism
| Step | What happens |
|---|---|
| IV mannitol | Raises plasma osmolality acutely |
| Osmotic gradient | Water drawn from intracellular and interstitial compartments into blood |
| Brain effect | Reduces cerebral edema → ↓ Intracranial Pressure (ICP) |
| Eye effect | Draws fluid from vitreous humor → ↓ Intraocular Pressure (IOP) |
Additional Effects
- Increases renal blood flow (RBF) - stimulates synthesis of vasodilating prostaglandins
- Free radical scavenger - may protect renal tubules in AKI
- Transient plasma volume expansion - before diuresis kicks in (can worsen heart failure)
Key Pharmacokinetic Points
| Property | Detail |
|---|---|
| Route | IV only (not absorbed orally) |
| Distribution | Extracellular fluid only |
| Metabolism | Minimal (largely excreted unchanged) |
| Dose | 0.25-1 g/kg IV |
| Onset of ICP effect | 15-30 minutes |
Important Adverse Effect
MOA of loop diuretics
A detailed medical flowchart titled "MECHANISM OF ACTION OF LOOP DIURETICS" showing: TOP BOX: Loop Diuretics (Furosemide, Bumetanide, Ethacrynic Acid, Torsemide) — given IV or orally → secreted into tubular lumen via proximal tubule organic acid transporter MAIN MECHANISM BOX (central, blue): Block NKCC2 (Na+/K+/2Cl- cotransporter) on luminal membrane of Thick Ascending Limb (TAL) of Loop of Henle → Na+, K+, 2Cl- NOT reabsorbed into tubular cells → accumulate in tubular lumen FROM THIS BLOCK, THREE ARROWS BRANCH DOWN: BRANCH 1 (left, orange): Loss of lumen-positive transepithelial voltage → Paracellular reabsorption of Ca2+ and Mg2+ abolished → HYPOCALCEMIA and HYPOMAGNESEMIA BRANCH 2 (centre, red): Large solute delivery to distal nephron → Acts as osmotic load → Impairs water reabsorption → Also: Disrupts countercurrent multiplier → Reduced medullary hypertonicity → Impaired urine concentrating ability → Result: 20-25% of GFR excreted as urine (most potent diuretics) BRANCH 3 (right, purple): Increased distal Na+ delivery to collecting duct → Aldosterone-stimulated Na+/K+ exchange ↑ → Excess K+ secretion → HYPOKALEMIA → ↓ H+ reabsorption → METABOLIC ALKALOSIS ADDITIONAL EFFECTS BOX (bottom, green): - Stimulates prostaglandin synthesis → renal and peripheral vasodilation (venodilation reduces preload acutely) - Stimulates renin release via macula densa - Ototoxicity (inhibits NKCC1 in inner ear at high doses) ADVERSE EFFECTS SUMMARY BOX (bottom right, yellow): Hypokalemia | Metabolic alkalosis | Hypomagnesemia | Hypocalcemia | Hyperuricemia | Ototoxicity | Volume depletion Use color-coded arrows and boxes. Professional clean medical diagram style.
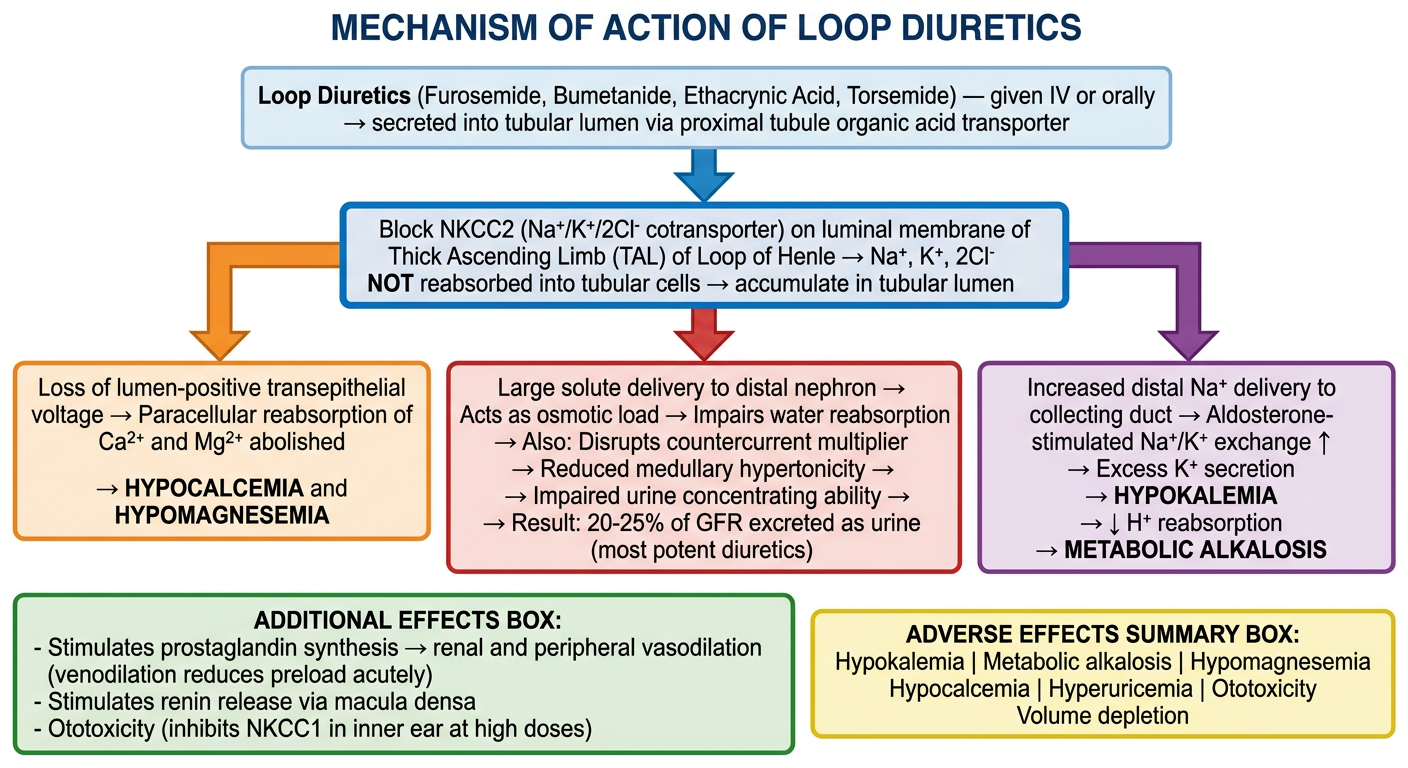
Mechanism of Action of Loop Diuretics
Drugs in this class
Step 1 - Delivery to Site of Action
Step 2 - Core Mechanism (Thick Ascending Limb)
| Step | Detail |
|---|---|
| Target | NKCC2 (Na+/K+/2Cl- cotransporter) on the luminal membrane of the thick ascending limb (TAL) |
| Effect | Blocks simultaneous entry of 1 Na+, 1 K+, and 2 Cl- into the tubular cell |
| Consequence | Na+, K+, Cl- remain in the tubular lumen and are excreted |
The TAL is normally impermeable to water, so it reabsorbs solute without water - loop diuretics exploit this. - Guyton & Hall, p. 425
Step 3 - Three Downstream Cascades
- Normally, K+ recycled back into the lumen via ROMK channels creates a lumen-positive transepithelial potential
- This drives paracellular reabsorption of Ca2+, Mg2+, Na+
- Loop diuretics abolish this voltage → Hypocalcemia + Hypomagnesemia
- TAL normally pumps solute into medullary interstitium to build medullary hypertonicity
- Blocked NKCC2 → medullary interstitial osmolarity falls
- Less water reabsorbed from descending limb and collecting duct
- Result: up to 20-25% of GFR delivered as urine - the most potent diuretic class
- Flood of Na+ to collecting duct → aldosterone-driven Na+/K+ exchange ↑ → excess K+ secretion → Hypokalemia
- Increased H+ secretion (to exchange for Na+) → Metabolic alkalosis
Additional / Extra-Renal Effects
| Effect | Mechanism |
|---|---|
| Acute venodilation | Stimulates prostaglandin synthesis → reduces preload (useful in acute pulmonary edema even before diuresis) |
| Renin release | Via macula densa sensing reduced NaCl delivery |
| Ototoxicity | Inhibits NKCC1 in stria vascularis of the inner ear (especially at high doses or with aminoglycosides) |
| Hyperuricemia | Volume depletion → urate reabsorption competes with diuretic secretion in PCT |
Summary of Electrolyte/Acid-Base Effects
| Parameter | Change | Reason |
|---|---|---|
| Na+ | ↓ | Direct NKCC2 block |
| K+ | ↓ | Increased distal delivery |
| Ca2+ | ↓ | Loss of lumen-positive voltage |
| Mg2+ | ↓ | Same as Ca2+ |
| Cl- | ↓ | Direct NKCC2 block |
| HCO3- | ↑ | Metabolic alkalosis |
| Urine volume | ↑↑↑ | Most potent diuretics |
| Body pH | ↑ | Metabolic alkalosis |