
Explajn about anginal pectoral and it's type How they differ from myocardial infarction
angina pectoris types stable unstable diagram coronary artery disease
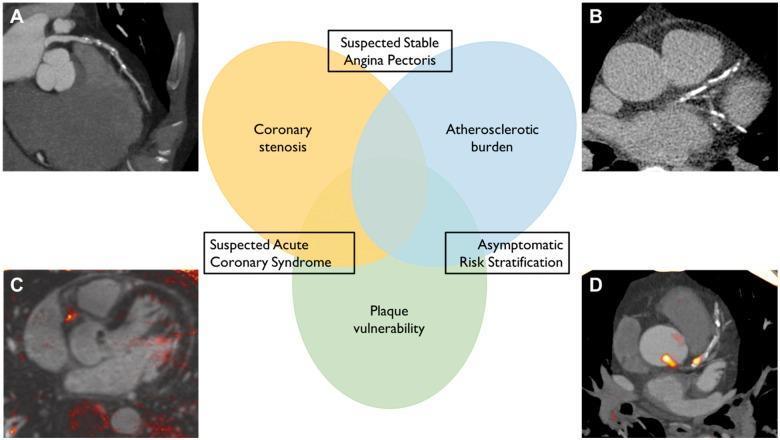
A multi-panel medical infographic and diagnostic imaging collage illustrating non-invasive coronary imaging modalities. The central feature is a Venn diagram highlighting three clinical objectives: coronary stenosis assessment (yellow), atherosclerotic burden quantification (blue), and plaque vulnerability identification (green). Overlapping regions link these objectives to clinical scenarios such as suspected stable angina pectoris, suspected acute coronary syndrome, and asymptomatic risk stratification. Surrounding the diagram are four diagnostic images: (A) a computed tomography angiography (CTA) showing coronary vessel morphology; (B) a coronary artery calcium (CAC) scan highlighting high-density calcified plaques; (C) a T1-weighted magnetic resonance coronary angiography showing potential intracoronary thrombus or intraplaque hemorrhage; and (D) a positron emission tomography (PET) scan utilizing radioactive tracers to map metabolic markers of plaque instability, indicated by focal orange/red hotspots. This educational visual demonstrates the complementary roles of CT, MRI, and PET in cardiology for evaluating ischemic heart disease and vascular health.
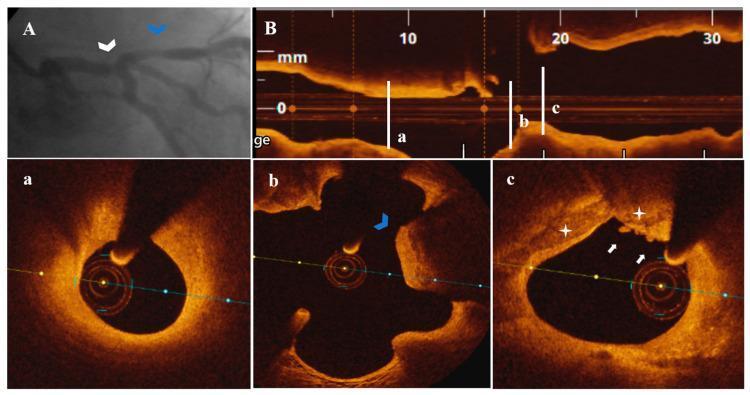
This composite medical image presents diagnostic findings for a 79-year-old patient with unstable angina pectoris (UAP), utilizing coronary angiography (CA) and optical coherence tomography (OCT). Panel A displays a CA of the left coronary system, identifying a borderline distal left main (LM) stenosis (white arrowhead) and a nonsignificant proximal left anterior descending (LAD) artery stenosis (blue arrowhead). Panel B provides a longitudinal OCT view of the LM-LAD segment with corresponding cross-sectional frames (a, b, c). Frame (a) shows a nonsignificant, uncomplicated LAD stenosis. Frame (b) highlights a calcified protrusion (blue arrowhead). Frame (c) demonstrates plaque erosion with superficial calcium protrusion (PE-SCP), indicated by white stars, accompanied by white thrombi (white arrows) within a nonsignificant LM stenosis (44.9% area stenosis). The imaging illustrates the utility of intravascular OCT in identifying specific high-risk plaque morphologies and thrombus formation in cases where angiography shows only borderline or nonsignificant coronary artery disease.
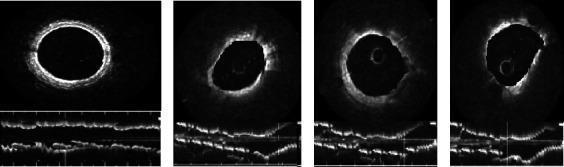
This diagnostic image provides a side-by-side comparison of intravascular optical coherence tomography (OCT) scans of coronary arteries. Panel (a) displays a healthy coronary artery, characterized by a smooth, circular lumen and a clearly defined three-layer vascular wall structure consisting of the intima (bright signal), media (dark band), and adventitia (outer bright layer). Panels (b), (c), and (d) depict clinical manifestations of unstable angina pectoris in a 67-year-old male. These pathological scans demonstrate irregular lumen morphology, heterogeneous signal intensity, and arterial wall thickening. Specific findings include high-intensity dot-like and strip-like structures consistent with macrophage infiltration and areas of signal attenuation indicative of atherosclerotic plaque. The bottom sections of each panel provide longitudinal reconstructions (L-mode), further highlighting the contrast between the uniform, layered architecture of the healthy vessel and the disrupted, irregular vessel wall topography associated with coronary artery disease and unstable plaque. This comparison is used to educate on the identification of vulnerable plaque features and thrombus formation in interventional cardiology.
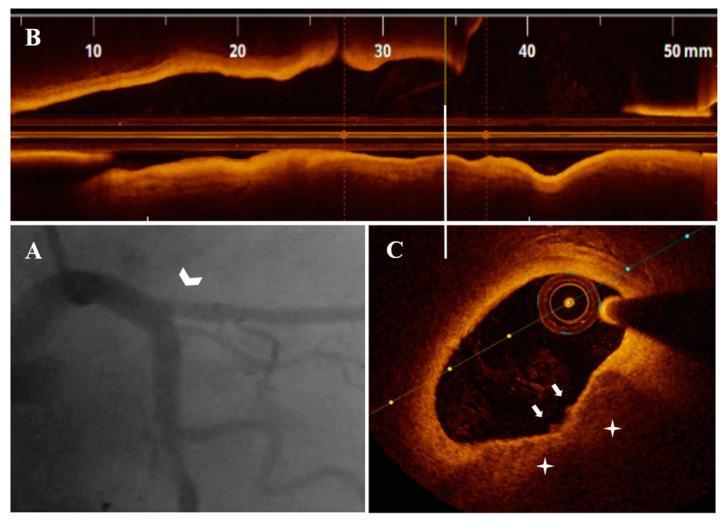
This composite figure demonstrates diagnostic imaging of the coronary arteries in a patient with unstable angina pectoris (UAP). Figure A is a coronary angiography (CA) frame showing the left coronary system, with a white arrowhead identifying a hazy, eccentric plaque at the ostium of the left anterior descending (LAD) artery. Figure B and C provide high-resolution intravascular imaging using optical coherence tomography (OCT). Figure B displays a longitudinal reconstructed view of the LAD plaque over a 50mm segment. Figure C shows a cross-sectional OCT view of the ostial LAD, revealing a plaque with an area stenosis of 38%. The image highlights plaque erosion with superficial calcific plaque (PE-SCP), marked by white stars, which is overlaid by white thrombi, indicated by white arrows. An OCT imaging catheter is centered within the vessel lumen. This set of images illustrates the clinical utility of combining luminal angiography with intravascular OCT to characterize vulnerable plaque morphology, such as calcific erosion and associated thrombosis, in acute coronary syndromes.
myocardial infarction vs angina comparison ischemia necrosis
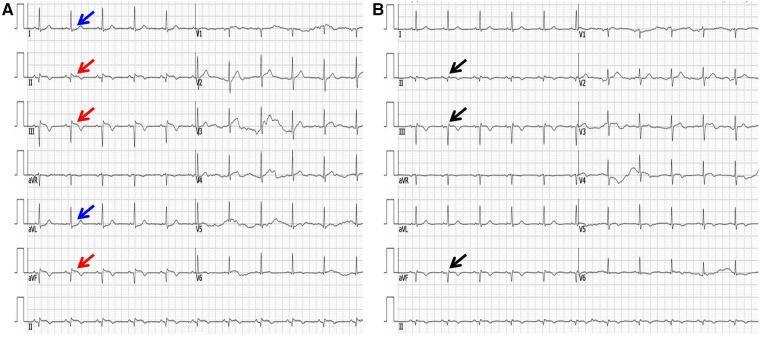
Comparison of two 12-lead electrocardiograms (ECG) demonstrating the temporal evolution of an inferior myocardial infarction. Panel A shows the acute phase on admission, characterized by significant ST-segment elevation (STEMI) in inferior leads II, III, and aVF (indicated by red arrows). This is accompanied by reciprocal ST-segment depression in high lateral leads I and aVL (indicated by blue arrows), which is a classic diagnostic marker for acute inferior wall ischemia. Panel B displays the ECG one week post-admission following intervention. Key morphological changes include the resolution of ST-segment elevations toward the baseline and the development of pathological Q waves in the inferior leads (indicated by black arrows). The appearance of these Q waves represents the transition from acute injury to established myocardial necrosis/scarring. This side-by-side comparison illustrates the typical electrocardiographic progression from hyperacute ST-segment elevation to the chronic development of Q-wave infarction in the inferior territory of the heart.
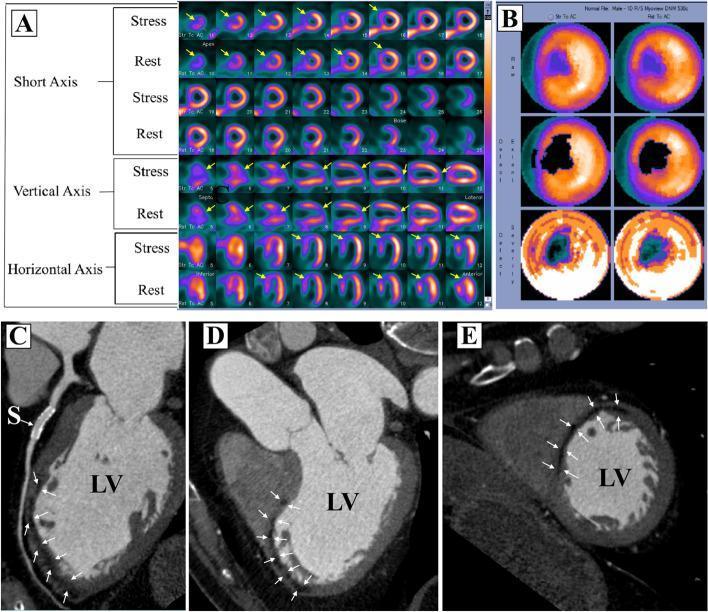
This composite diagnostic image illustrates a multi-modality cardiac assessment for myocardial ischemia and infarction. Panel A displays SPECT Myocardial Perfusion Imaging (MPI) in short-axis, vertical long-axis, and horizontal long-axis views. It shows comparative stress and rest slices where yellow arrows indicate fixed perfusion defects (FPD) in the anterior wall and apex, consistent with prior myocardial infarction. Panel B shows corresponding polar maps (bullseye plots) quantifying the extent and severity of the perfusion defect during stress and rest. Panels C, D, and E are Coronary Computed Tomographic Angiography (CCTA) images. These images demonstrate the anatomical correlation of the SPECT findings, showing a patent coronary stent (labeled 'S') in the left anterior descending artery. White arrows in the CCTA views point to localized sub-endocardial hypo-perfusion and myocardial thinning in the anterior and apical regions of the left ventricle (LV). This multimodal comparison is used in clinical education to differentiate between true myocardial necrosis (scar) and soft tissue attenuation artifacts by correlating functional perfusion deficits with anatomical hypo-enhancement.
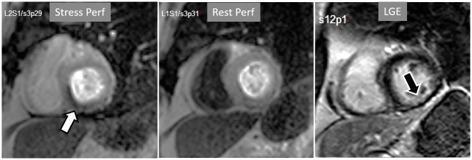
This Comparison Chart displays three short-axis Cardiac Magnetic Resonance (CMR) images illustrating stress/rest perfusion and Late Gadolinium Enhancement (LGE) in a patient with chronic myocardial infarction. The first panel (Stress Perf) shows a subendocardial perfusion defect in the inferior wall of the left ventricle, indicated by a white arrow, characterized by a dark region of low signal intensity. The second panel (Rest Perf) demonstrates the resolution of this defect at rest, suggesting inducible ischemia. The third panel (LGE) shows a localized area of hyperintensity in the inferior subendocardium (black arrow), representing a myocardial scar from a previous infarct. Notably, the stress perfusion defect is larger than the LGE scar, indicating a peri-infarction zone of reversible ischemia. This diagnostic imaging sequence is used in cardiology to differentiate between fixed myocardial necrosis and viable but ischemic tissue, which is critical for guiding revascularization decisions in ischemic cardiomyopathy.
Angina Pectoris - Types & Differences from Myocardial Infarction
What is Angina Pectoris?
Three Types of Angina Pectoris
1. Stable (Typical) Angina
- Mechanism: Fixed atherosclerotic narrowing of coronary arteries causing reduced supply; symptoms triggered by increased oxygen demand
- Trigger: Predictably precipitated by exertion, emotional stress, tachycardia, cold exposure, or heavy meals
- Character: Crushing or squeezing substernal sensation, usually 2-5 minutes in duration
- Radiation: Left arm (ulnar aspect), left jaw, neck, interscapular region
- Relief: Rest within 1-5 minutes, or sublingual nitroglycerin (vasodilator)
- Threshold: Fixed and predictable - patients know exactly what activity triggers it
- Underlying pathology: Stable atheromatous plaque causing fixed coronary stenosis; no plaque disruption
2. Prinzmetal (Variant) Angina
- Mechanism: Episodic coronary artery spasm causing transient, severe reduction in blood supply - NOT due to increased demand
- Trigger: Occurs at rest, often in the early morning hours; not related to exertion
- Character: Same substernal chest discomfort pattern, but unpredictable
- ECG: Transient ST elevation (unlike stable angina which shows ST depression)
- Special feature: Can affect atherosclerotic vessels OR completely normal coronary arteries
- Relief: Responds promptly to vasodilators - nitroglycerin and calcium channel blockers
- Clinical significance: Can trigger serious arrhythmias during episodes
3. Unstable Angina
- Mechanism: Plaque disruption with superimposed thrombosis, distal thromboembolism, and/or vasospasm - partial or intermittent occlusion
- Pattern: Increasingly frequent chest pain, precipitated by progressively less exertion or occurring at rest - the crescendo pattern
- Key feature: New onset, or change in character of previous stable angina (more frequent, longer, occurring at rest)
- Pathology: Active plaque rupture, platelet aggregation, non-occlusive thrombus
- Clinical significance: Part of the Acute Coronary Syndrome (ACS) spectrum - majority of cases show evidence of myocyte injury on biomarkers
- Management: Treated aggressively to prevent progression to full MI
Canadian Cardiovascular Society (CCS) Grading of Angina
| Class | Description |
|---|---|
| I | Angina only with strenuous/rapid/prolonged exertion |
| II | Slight limitation - angina on walking >2 blocks or climbing >1 flight of stairs |
| III | Marked limitation - angina on walking 1-2 blocks or climbing 1 flight |
| IV | Inability to carry on any activity without discomfort; angina at rest |
How Angina Differs from Myocardial Infarction (MI)
| Feature | Angina Pectoris | Myocardial Infarction |
|---|---|---|
| Pathophysiology | Transient, reversible ischemia | Sustained ischemia → irreversible myocyte necrosis |
| Duration of ischemia | Brief (minutes); self-limiting | Prolonged (>20-40 minutes) |
| Myocyte death | None - no necrosis | Yes - coagulative necrosis of myocytes |
| Biomarkers (Troponin, CK-MB) | Normal (not elevated) | Elevated - leaked from necrotic cells |
| Coronary occlusion | Partial or transient | Usually complete/near-complete occlusion |
| ECG changes | Transient ST depression or T-wave changes; resolves | Persistent ST elevation (STEMI) or new Q waves; often permanent |
| Pain duration | 2-15 minutes | >20-30 minutes; does NOT resolve with rest |
| Response to nitroglycerin | Usually relieves symptoms | May not fully relieve; only partially helps |
| Pathology on autopsy | No macroscopic changes | Pale/yellow zone of necrosis; later scarring |
| Biomarker rise-fall | No biomarker elevation | Troponin rises within 3-6 hrs; peaks at 12-24 hrs |
| Complications | Rare (arrhythmia in Prinzmetal) | Heart failure, arrhythmia, cardiogenic shock, rupture |
| Reversibility | Completely reversible | Permanent loss of myocardium |
Key Molecular Turning Point
Spectrum View: Ischemic Heart Disease Continuum
Silent Ischemia → Stable Angina → Unstable Angina → NSTEMI → STEMI
        ← No necrosis →         ← ACS spectrum / Increasing necrosis →
- Unstable angina and NSTEMI differ only by the presence of biomarker elevation (myocyte death) in NSTEMI
- STEMI involves complete occlusion of an epicardial artery with transmural ischemia and the most extensive necrosis