
Adrenal gland anatomy
Adrenal gland anatomy
adrenal gland anatomy zones cortex medulla diagram
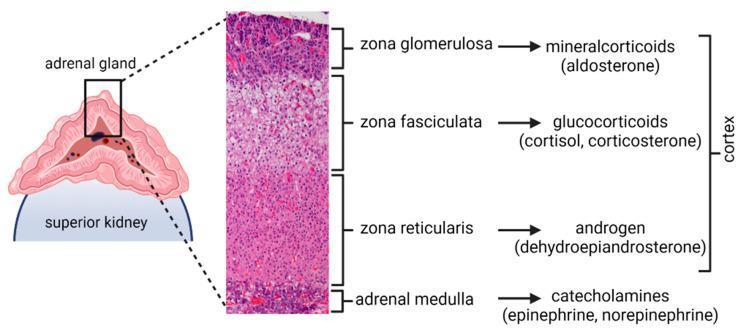
An educational infographic and diagnostic image composite illustrating the anatomy and functional histology of the adrenal gland. On the left, a schematic diagram depicts the adrenal gland situated on the superior pole of the kidney. A high-magnification histological section (Hematoxylin and Eosin stain) of a macaque adrenal gland is featured in the center, showing the distinct layered architecture. The image labels the adrenal cortex and its three functional zones from superficial to deep: the zona glomerulosa (mineralocorticoids/aldosterone), the thickest layer, zona fasciculata (glucocorticoids/cortisol and corticosterone), and the zona reticularis (androgens/dehydroepiandrosterone). The innermost region is identified as the adrenal medulla, responsible for secreting catecholamines (epinephrine and norepinephrine). The histological section displays characteristic cellular morphology, including the rounded clusters of the glomerulosa, the linear cords of the fasciculata, and the branching network of the reticularis. This graphic is designed for medical education to correlate anatomical structure with endocrine function.
![A pathophysiology diagram illustrating the bidirectional neuroendocrine axis between the brain and the adrenal gland, specifically focusing on the mechanisms of adrenarche. The diagram depicts a sagittal view of the human brain connected to an adrenal gland through several pathways. The adrenal gland is shown in cross-section with its histological zones: the medulla (Med) and the cortex, comprising the zona glomerulosa (ZG), zona fasciculata (ZF), and zona reticularis (ZR). Key pathways include: (1) Descending hypothalamic-pituitary-adrenal (HPA) influences via ACTH or unidentified corticotrophs; (2) Autonomic innervation from the spinal cord via the splanchnic nerve (Sp. n.) to the medulla and cortex; and (3) Ascending feedback loops where DHEA[S] and 11-oxyandrogens impact the CNS, potentially influencing mental health, puberty preparation, and sexually dimorphic behaviors. A separate feedback line shows cortisol's influence on the brain. The illustration highlights the complex interplay of endocrine, paracrine, and neural signals that regulate the maturation of steroidogenesis within the adrenal zona reticularis.](https://cdn.orris.care/cdss_images/pmc_clinical_VQA_fbfc51581f4c6f67769062b258c4a653cacc4ccb695634ad2cbe722d4089c6e6.jpg)
A pathophysiology diagram illustrating the bidirectional neuroendocrine axis between the brain and the adrenal gland, specifically focusing on the mechanisms of adrenarche. The diagram depicts a sagittal view of the human brain connected to an adrenal gland through several pathways. The adrenal gland is shown in cross-section with its histological zones: the medulla (Med) and the cortex, comprising the zona glomerulosa (ZG), zona fasciculata (ZF), and zona reticularis (ZR). Key pathways include: (1) Descending hypothalamic-pituitary-adrenal (HPA) influences via ACTH or unidentified corticotrophs; (2) Autonomic innervation from the spinal cord via the splanchnic nerve (Sp. n.) to the medulla and cortex; and (3) Ascending feedback loops where DHEA[S] and 11-oxyandrogens impact the CNS, potentially influencing mental health, puberty preparation, and sexually dimorphic behaviors. A separate feedback line shows cortisol's influence on the brain. The illustration highlights the complex interplay of endocrine, paracrine, and neural signals that regulate the maturation of steroidogenesis within the adrenal zona reticularis.
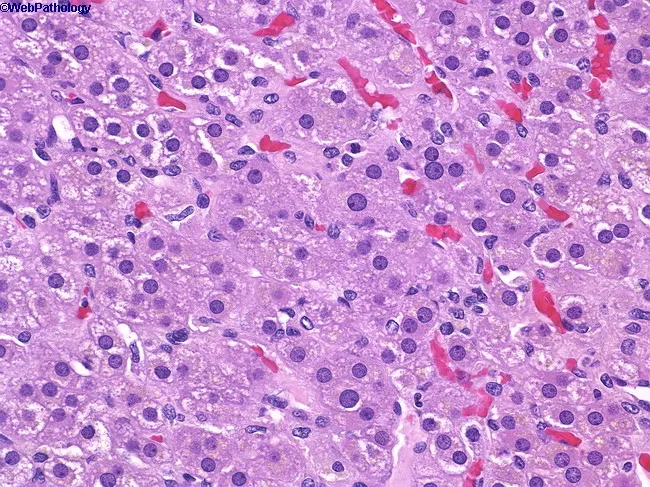
Imaging modality: Light microscopy of adrenal gland tissue, Hematoxylin and Eosin (H&E) stained section, viewed under brightfield illumination at high magnification (approximately 400x). Anatomical location: adrenal cortex with zona reticularis occupying the deepest corticoid layer, immediately superficial to the adrenal medulla, behind zona fasciculata. Visual features: cells arranged in anastomosing cords and small nests; cytoplasm is acidophilic and granular; nuclei are round to vesicular with prominent punctate nucleoli; capillary sinusoids are intermixed, producing a lobular vascular network. The zona reticularis lies between the zona fasciculata and the medulla, forming a reticular, fine meshwork. The cellular morphology indicates steroidogenic chromaffin-adjacent cells with robust endoplasmic reticulum and lipid-poor cytoplasm relative to fasciculata. Notable features include tight cell-to-cell contacts, vascularized stroma, and delineation from the surrounding zones. Pathophysiology/diagnostic significance: Normal zonation of the adrenal cortex is demonstrated; zona reticularis is responsible for glucocorticoid and sex hormone synthesis (androgen precursors), contributing to the endocrine milieu. Clinical relevance: understanding this histology supports differential diagnosis of adrenal cortical neoplasms and endocrine disorders; potential use in educational contexts, research on steroidogenesis, and histopathology training. This image serves as a reference for adrenal cortical anatomy, steroidogenic cell morphology, and the interface with the medulla.
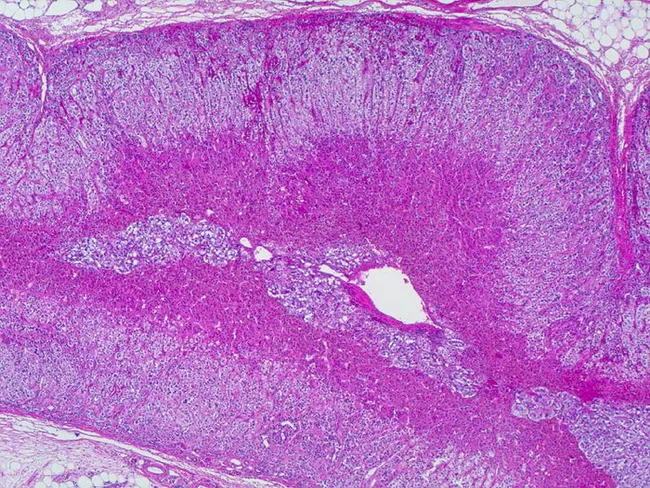
Imaging modality: Light microscopy; Technique: Hematoxylin and Eosin (H&E) stained paraffin section showing adrenal gland architecture. Adrenal gland composed of an outer cortex with three concentric zones—zona glomerulosa (outermost), zona fasciculata, and zona reticularis—surrounding an inner medulla with chromaffin cells; in this low-power view the medulla is centralized and encircles the principal blood vessels near the image center. The cortex thickness measures approximately 1 mm in healthy adults and demonstrates dense cellular cords with alternating light and dark staining patterns corresponding to zona fasciculata foamy cytoplasm and zona glomerulosa compact arrangement; zona reticularis forms a network of intertwining cords. The medullary region consists of chromaffin cells arranged in irregular clusters with abundant cytoplasm and consistent purple nuclei; scant interstitial connective tissue is visible. The overall architecture is preserved, with no evident cortical hyperplasia, nodularity, or adrenal neoplasm. The specimen likely represents a normal, non-pathologic adrenal gland from a healthy adult, matching reported averages: combined gland weight ~8 g and normal cortex thickness ~0.7–1.3 mm. Diagnostic significance: confirms typical zonation and corticomedullary organization; pathology considerations would include hyperplasia, adenoma, pheochromocytoma if architecture were disrupted. Clinical correlation: adrenal function tests, cortisol/aldosterone regulation, catecholamine synthesis would be interpreted against this baseline.
Adrenal Gland Anatomy
Overview
Embryology
| Component | Origin | Timing |
|---|---|---|
| Cortex | Mesodermal tissue (adrenogenital ridge, near gonads) | ~5th week gestation |
| Medulla | Ectodermal (neural crest cells migrating from paravertebral/para-aortic areas) | ~5th-6th week gestation |
Gross Anatomy & Relations
- Right adrenal: sits above the upper pole of the right kidney; posteromedially related to the IVC, which it contacts directly
- Left adrenal: crescentic shape; medial to the upper pole of the left kidney; related to the splenic vessels and tail of pancreas anteriorly
- Both glands sit within Gerota's fascia (perirenal fascia)
Blood Supply
| Vessels | Source |
|---|---|
| Superior suprarenal arteries | Inferior phrenic artery |
| Middle suprarenal arteries | Directly from aorta |
| Inferior suprarenal arteries | Renal artery |
- Right adrenal vein: drains directly into the IVC (short, ~1 cm - surgically significant)
- Left adrenal vein: drains into the left renal vein (longer, more forgiving surgically)
Zones of the Adrenal Cortex
| Zone | Location | Product | Mnemonic |
|---|---|---|---|
| Zona Glomerulosa | Outermost | Mineralocorticoids (aldosterone) | Salt |
| Zona Fasciculata | Middle (thickest) | Glucocorticoids (cortisol, corticosterone) | Sugar |
| Zona Reticularis | Innermost (adjacent to medulla) | Sex steroids / androgens (DHEA, androstenedione) | Sex |
- Glomerulosa: cells in rounded clusters/glomeruli
- Fasciculata: cells in linear cords, foamy cytoplasm (lipid-rich for steroidogenesis)
- Reticularis: anastomosing cords in a reticular network, lipid-poor compact cells
Adrenal Medulla
- Composed of chromaffin cells (modified postganglionic sympathetic neurons derived from neural crest)
- Arranged in irregular clusters with abundant cytoplasm
- Secretes catecholamines: primarily epinephrine (~80%) and norepinephrine (~20%)
- The medulla is innervated by preganglionic sympathetic fibers via the splanchnic nerves - it acts as a modified sympathetic ganglion
Histological Comparison
Innervation
- Cortex: poorly innervated; regulation is primarily humoral (ACTH from pituitary via HPA axis)
- Medulla: richly innervated by preganglionic sympathetic (cholinergic) fibers through the greater splanchnic nerve; bypasses synapsing in a ganglion - which is why stress rapidly triggers catecholamine release
Clinical Correlates of Anatomy
| Anatomical Feature | Clinical Relevance |
|---|---|
| Right adrenal vein enters IVC directly | High-risk bleeding during right adrenalectomy |
| Ectopic cortical tissue near gonads | Can become functional in congenital adrenal hyperplasia |
| Organ of Zuckerkandl | Site of extra-adrenal pheochromocytoma (paraganglioma) |
| Neural crest origin of medulla | Explains pheochromocytoma; also explains neuroblastoma in children |
| Zona glomerulosa produces aldosterone | Regulated by renin-angiotensin, NOT ACTH |
Bladder cancer and prostate diseases
bladder cancer urothelial carcinoma cystoscopy histology
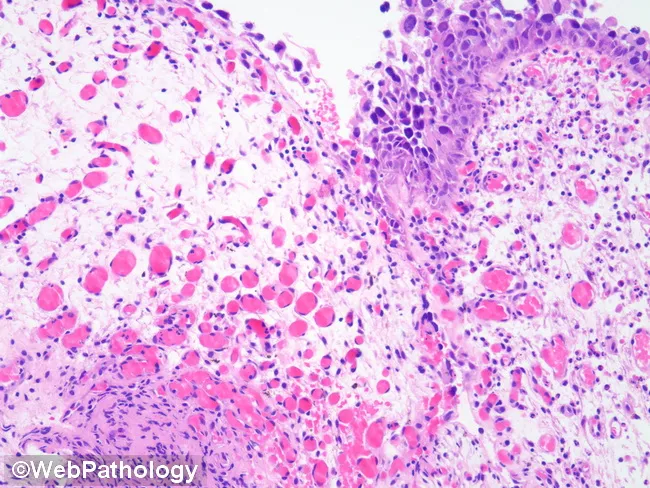
Histopathology: Bladder mucosa illustrating urothelial carcinoma in situ with prominent tumor-induced neovascularization of the lamina propria. Hematoxylin and eosin (H&E) stained section shows an intact urothelium overlying a richly vascular lamina propria, with conspicuous capillary proliferation and inflammatory infiltrates, consistent with mucosal erythema seen cystoscopically. The urothelial layer exhibits high-grade cytologic atypia, including enlarged, hyperchromatic nuclei, increased nuclear-to-cytoplasmic ratio, pleomorphism, and frequent atypical mitoses confined to the basal and intermediate layers, without overt invasion into muscularis propria. Mucosal edema and mild edema-related vascular congestion accompany chronic inflammatory cells, including lymphocytes and plasma cells. The combination of neovascularization and dysplastic urothelium is characteristic of carcinoma in situ, or high-grade urothelial intraepithelial neoplasia, and correlates with the erythematous, velvety appearance observed during cystoscopy. Inflammation likely augments vascular density and mucosal visibility. Clinically, CIS carries a high risk of progression to invasive disease and warrants intravesical therapy and close surveillance. This image represents a biopsy specimen suitable for histologic confirmation, referral to urothelial pathology, and integration with cytology and imaging for comprehensive staging. Accurate recognition of angiogenic changes supports diagnosis, guides treatment selection, and informs prognosis in bladder cancer management. Histology corroborates cystoscopic findings and cytology, enabling precise therapeutic planning and improved outcomes.
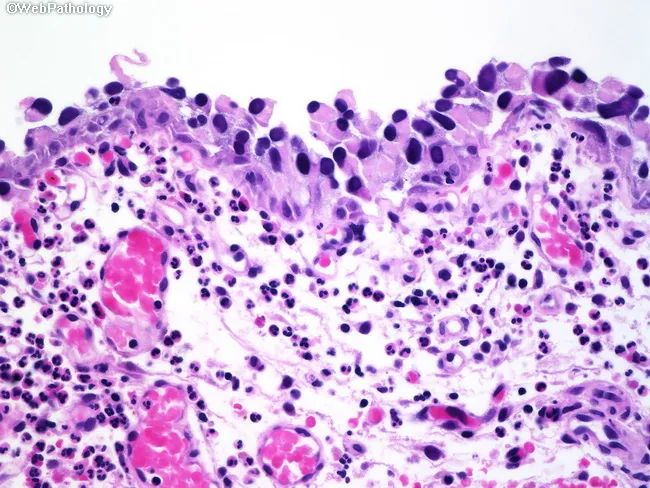
Light microscopy of an hematoxylin-and-eosin (H&E) stained bladder mucosa section showing urothelial carcinoma in situ (CIS). The specimen depicts urothelial epithelium with full-thickness high-grade atypia: markedly pleomorphic, hyperchromatic nuclei with prominent nucleoli and abundant eosinophilic cytoplasm, increased nuclear-to-cytoplasmic ratio, and conspicuous architectural disarray with loss of polarity. Basal and superficial layers demonstrate uniform dysplasia across the entire thickness, while the basement membrane remains intact, consistent with non-invasive disease. An acute inflammatory infiltrate is present in the underlying lamina propria, yet invasion is not evident. The histologic pattern is diagnostic of CIS and correlates with high-grade urothelial carcinoma in situ, a precursor to invasive urothelial carcinoma. Clinically, CIS carries a high risk of recurrence and progression and mandates intravesical therapy consideration (e.g., BCG) and close surveillance with cystoscopy and urine cytology. This image is valuable for diagnostic education, differential diagnosis with reactive urothelial changes, high-grade dysplasia, and invasive carcinoma, and for correlating histology with ancillary tests. The description supports precision in pathology reporting, guiding staging, treatment planning, and research on bladder cancer pathobiology. The image supports educational objectives in surgical pathology, cytology correlations, and multidisciplinary tumor boards; it also enhances database annotations for machine-assisted detection of non-invasive urothelial carcinoma and related premalignant lesions.
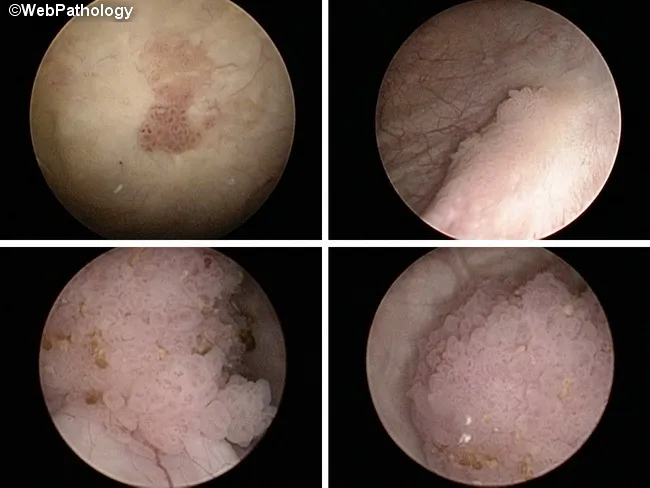
Flexible office-based cystoscopy using a pliable cystoscope under white-light illumination provides in vivo visualization of the urothelium. In these four quadrants, papillary, frond-like lesions rise from a background of smooth, regular urothelial lining in the urinary bladder. The lesions exhibit irregular, pedunculated or sessile architecture with variable color—from pale pink to slightly erythematous—often with delicate vascularity at the surface. The surrounding mucosa remains intact and non-ulcerated in the absence of obvious invasion, though focal necrosis or a broad-based, sessile component would raise concern for higher-grade disease. The endoscopic appearance alone cannot establish histology; histopathologic confirmation via biopsy is required to differentiate benign inflammatory processes from urothelial carcinoma and to determine grade and stage. Endoscopic assessment is essential for lesion localization, resection planning, and surveillance, with biopsy targets typically chosen at the most prominent papillary fronds or suspicious necrotic areas. Clinically, these findings prompt to perform transurethral resection with intravesical therapy if indicated, and staged evaluation to assess invasion depth. In summary, cystoscopy detects papillary urothelial tumors, supports risk stratification (papillary vs sessile; necrotic tendency), and guides diagnostic workup in bladder cancer management, including urothelial carcinoma, non-invasive papillary carcinoma, carcinoma in situ, and inflammatory/benign mimics.
prostate cancer Gleason grading histology adenocarcinoma
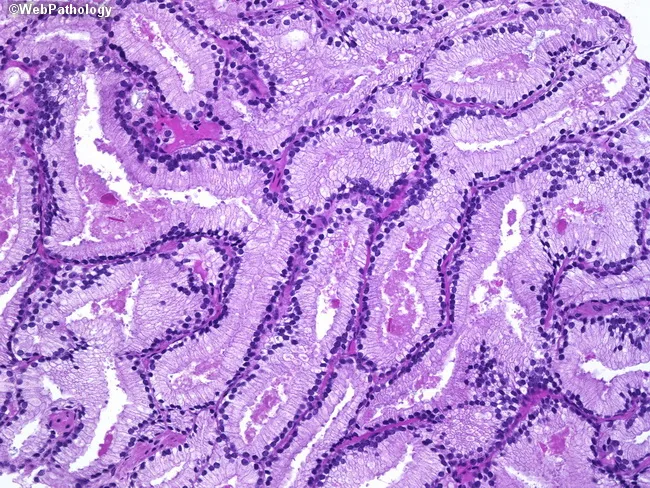
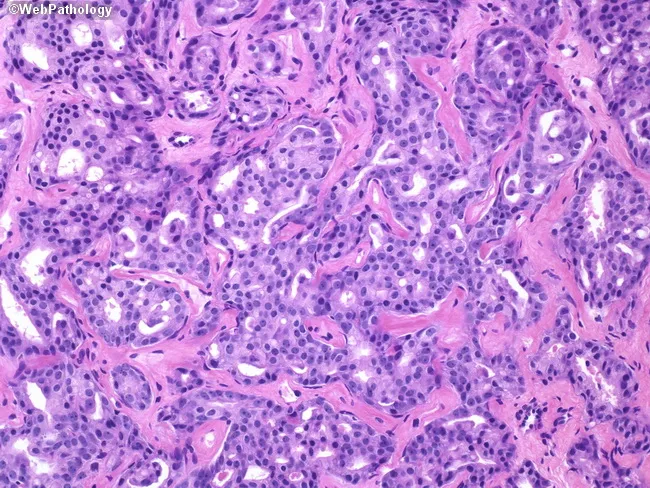
High-power histology image of prostatic acinar adenocarcinoma (Gleason score 3+3=6) viewed under bright-field light microscopy. The specimen demonstrates well-formed, back-to-back glands infiltrating the periglandular stroma, consistent with low-grade malignant acinar architecture. Gland lumina are generally round to slightly elongated, lined by a single layer of cuboidal to columnar epithelial cells with mild cytologic atypia, small central nuclei, and occasional stratification. The basal cell layer characteristic of benign prostatic acini is not evident within the malignant glands, and there is minimal desmoplastic reaction. The glands vary in size but maintain a predominantly tubular, well-differentiated appearance without prominent cribriform, fused, or solid growth patterns, which aligns with Gleason pattern 3. Nuclei show modest enlargement; nucleoli are rarely conspicuous in this field. Overall morphology supports a low-grade prostatic adenocarcinoma, with infiltration into surrounding stroma but without high-grade features locally evident. This image captures a classic example applicable to educational discussions of prostate cancer grading, prognosis, and management implications. Clinically relevant keywords include prostate cancer, acinar adenocarcinoma, Gleason 3+3, tumor architecture, well-formed glands, low grade, and active surveillance considerations. It complements histology teaching of tumor grading systems and is suitable for radiologic-pathologic correlation and pathology review.
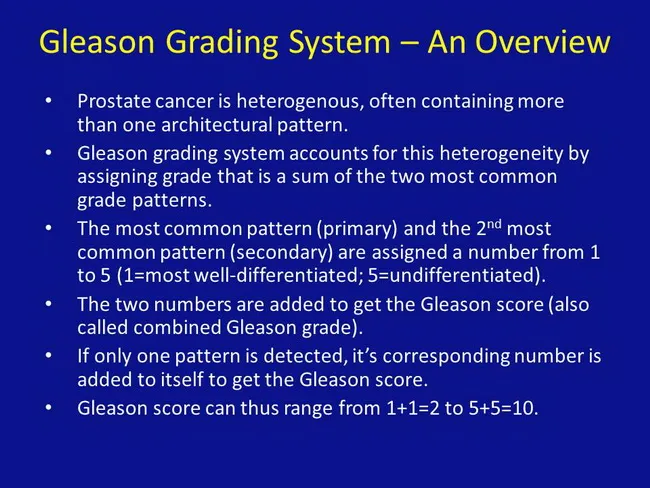
Imaging modality: Not applicable; this is an educational infographic illustrating the Gleason Grading System for prostate cancer. Primary subject: Gleason grading; Prostate gland tissue; histopathology overview. The figure explains that prostate adenocarcinoma is graded by two most prevalent architectural patterns observed in needle core biopsy or prostatectomy specimens. Patterns are numbered 1 through 5, with 1 being well differentiated (well-formed glands) and 5 being undifferentiated. The most common pattern (primary) and the second most common pattern (secondary) are assigned numbers and added to produce the Gleason score (e.g., 3+4 = 7; also called combined Gleason grade). If only a single pattern is detected, that pattern is summed with itself to yield the score (e.g., 3+3 = 6). The final score ranges from 2 to 10 in older definitions but commonly reported as 6 to 10 in modern practice, with higher scores indicating more aggressive disease. The diagnostic significance lies in prognosis and treatment planning; higher scores correlate with worse prognosis and may prompt intensified therapy, surveillance strategies, or risk stratification. Clinically, Gleason grading is integrated with PSA levels and imaging findings to guide biopsy decisions, active surveillance versus definitive therapy, and eligibility for systemic treatment. This framework supports educational, research, and clinical decision scenarios, including risk-adapted management, stratification into low-, intermediate-, and high-risk groups, and comparative pathology teaching for learners globally.
High-magnification histopathology image of a prostate needle core biopsy stained with Hematoxylin and Eosin. The sample demonstrates prostatic adenocarcinoma with cribriform architectural pattern (Gleason pattern 4) forming anastomosing clusters and ill-defined, punched-out lumina within an infiltrative stroma. The glands are irregular, tightly packed, and display cytologic atypia characterized by increased nuclear size, hyperchromasia, and prominent nucleoli. This high-grade neoplasm shows minimal intervening benign prostatic acini, with a cribriform network extending variably, consistent with Gleason score 4+4=8. The abundant malignant glands exhibit solid and cribriform growth rather than broad, well-differentiated acini, indicating aggressive histology. No definitive perineural invasion is identifiable in this field, though occasional invasion of surrounding stroma may be present in other sections. The image highlights diagnostic features used for grading: architectural disarray, cribriform glands with punched lumina, and conspicuous cellular atypia, supporting a high-grade prostate cancer diagnosis. Clinically, this pattern portends intermediate to high risk, guides treatment planning towards definitive local therapy with adjuvant systemic approaches, and necessitates correlation with serum PSA values, MRI staging, and potential molecular studies. Recognizing this cribriform pattern is essential for pathologists and clinicians as it influences prognosis, aggressiveness, and management decisions. This image serves as an educational reference for education, diagnosis, and research.
benign prostatic hyperplasia BPH prostate enlargement ultrasound pathology
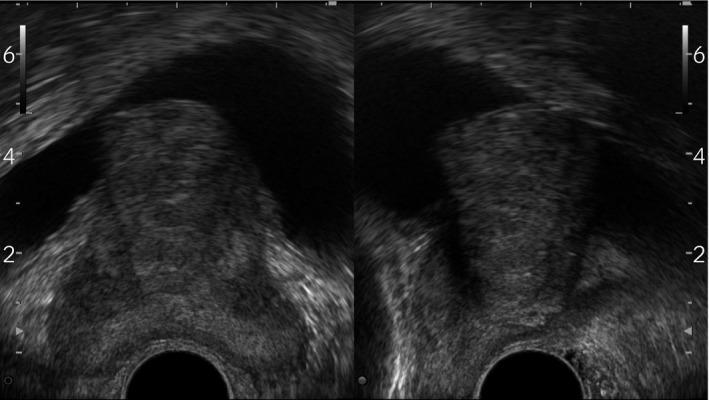
This diagnostic image consists of two grayscale prostate ultrasonography views (likely transverse and sagittal planes) demonstrating Benign Prostatic Hyperplasia (BPH) with significant mid-lobe hypertrophy. The prostate gland appears enlarged with a heterogeneous echotexture. A prominent, solid tissue mass originating from the median lobe is seen protruding superiorly into the anechoic (black) space of the bladder lumen. This intravesical prostatic protrusion (IPP) is a key clinical finding that correlates with bladder outlet obstruction. The image also displays standard sonographic depth markers on the lateral margins and a dark circular acoustic shadow at the bottom center, representing the position of the ultrasound probe. This material is used to teach medical students and urology residents the sonographic evaluation of lower urinary tract symptoms and the anatomical manifestations of prostatic enlargement.
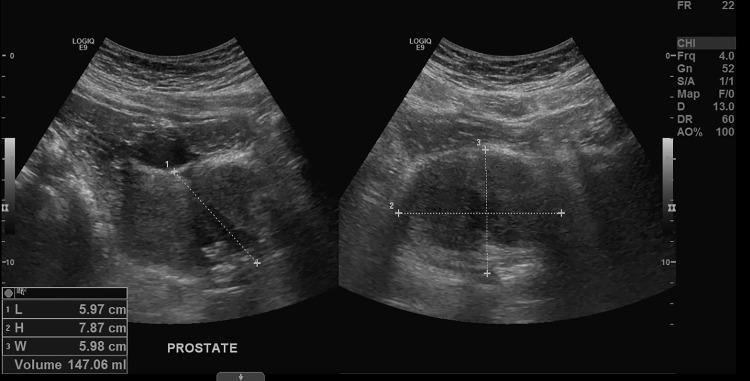
This diagnostic image is a split-screen retroperitoneal ultrasound of the prostate gland in longitudinal and transverse planes. The ultrasound shows severe prostatic enlargement (prostatomegaly) with a calculated volume of 147.06 mL, significantly exceeding the normal range. In the sagittal view (left), there is evidence of median lobe hypertrophy protruding into the bladder base. Electronic calipers measure the gland's dimensions: length (L) 5.97 cm, height (H) 7.87 cm, and width (W) 5.98 cm. The prostate displays a relatively heterogeneous but primarily hypoechoic to isoechoic echotexture with well-defined borders. This imaging is clinically significant for evaluating benign prostatic hyperplasia (BPH) and lower urinary tract symptoms. The presence of median lobe hypertrophy is a key finding that can contribute to bladder outlet obstruction. The image is intended for intermediate to advanced medical learners studying urology and diagnostic radiology.
Bladder Cancer & Prostate Diseases
PART 1: BLADDER CANCER
Epidemiology & Risk Factors
- Cigarette smoking - the most prominent risk factor, increasing risk 4-7x. Risk remains elevated 10 years after cessation.
- Occupational carcinogens - aromatic amines (dye, rubber industry), benzidine, paint, metal, and petroleum manufacturing
- Cyclophosphamide chemotherapy
- Radiation therapy to the pelvis
- Schistosoma haematobium infection (linked to squamous cell carcinoma, endemic regions)
- Prolonged catheterization / foreign body exposure
- Aristolochic acid (certain herbal weight-loss supplements)
Pathology & Classification
| Pathway | Lesion | Mutations | Behavior |
|---|---|---|---|
| Papillary (exophytic) | PUNLMP, Low-grade, High-grade papillary | FGFR3 amplification (gain-of-function) | Recurs frequently; low progression (~20%) |
| Flat (CIS pathway) | Carcinoma in situ (CIS) | TP53 and RB disruption early | High risk of muscle invasion |
TNM Staging
| Stage | Description |
|---|---|
| Ta | Non-invasive papillary carcinoma (confined to mucosa) |
| Tis | Carcinoma in situ (flat, high-grade) |
| T1 | Invades lamina propria (subepithelial connective tissue) |
| T2 | Invades muscularis propria (muscle-invasive) |
| T3 | Invades perivesical tissue |
| T4 | Invades adjacent organs (prostate, uterus, vagina, pelvic/abdominal wall) |
Diagnosis
- Hematuria (gross or microscopic) is the most common presenting sign
- Cystoscopy + biopsy - gold standard for diagnosis and staging
- Urine cytology - positive results are essentially diagnostic; false-negatives limit use alone
- TURBT (transurethral resection of bladder tumor) - both diagnostic and therapeutic for NMIBC
- CT urography / MRI - for staging, especially lymph node assessment
- 18F-FDG PET - indicated for equivocal conventional imaging; pooled sensitivity 57%, specificity 92% for lymph node staging - Campbell-Walsh-Wein Urology
Cystoscopic appearance - papillary bladder tumors
Histopathology - Urothelial CIS
Treatment
NMIBC (Ta, T1, CIS)
- TURBT - primary treatment for all NMIBC
- Intravesical BCG - first-line adjuvant for high-risk NMIBC (CIS, high-grade T1); BCG instillations reduce recurrence and progression
- Intravesical chemotherapy - mitomycin C (lower-risk lesions), immediate post-TURBT instillation
- Radical cystectomy - for BCG-refractory disease; guidelines recommend cystectomy if BCG fails within 2 years (>2-year delay significantly reduces cancer-specific survival) - Campbell-Walsh-Wein Urology, p. 1682
- Photodynamic therapy (PDT) - salvage option; 66% response rate in CIS patients
MIBC (T2-T4)
- Radical cystectomy (cystoprostatectomy in men, anterior pelvic exenteration in women) with urinary diversion - standard of care
- Neoadjuvant cisplatin-based chemotherapy - improves survival when given before cystectomy
- Bladder-sparing trimodality therapy - TURBT + concurrent chemoradiation (selected patients)
- Systemic chemotherapy (MVAC or gemcitabine/cisplatin) for metastatic disease
- Immune checkpoint inhibitors (pembrolizumab, atezolizumab) - for platinum-ineligible or refractory metastatic urothelial carcinoma
PART 2: PROSTATE DISEASES
A. Benign Prostatic Hyperplasia (BPH)
Epidemiology
Pathogenesis
- Dihydrotestosterone (DHT) - the key hormonal driver (10x more potent than testosterone)
- DHT is synthesized from testosterone in the prostate by 5α-reductase type 2
- DHT binds nuclear androgen receptors, driving proliferation of both stromal and glandular elements
- With aging: testosterone declines but estrogen remains stable/increases - estrogens act synergistically with DHT on stromal and epithelial cells
- BPH does NOT occur in men castrated before puberty or with androgen-insensitivity syndromes
Morphology
- Prostate weight increases 3-5x (60-100 g, can exceed this)
- Affects the periurethral transition zone - compresses urethra to a slit-like orifice
- Histology: hyperplastic nodules with variable proportions of glands and fibromuscular stroma
- Hyperplastic glands lined by two cell layers - inner tall columnar epithelium + outer flattened basal cells (key distinction from malignancy)
- Lumina may contain corpora amylacea (laminated proteinaceous secretions)
BPH on Ultrasound
Symptoms (LUTS - Lower Urinary Tract Symptoms)
- Obstructive: hesitancy, weak stream, incomplete emptying, straining, overflow dribbling
- Irritative: frequency, urgency, nocturia, dysuria
- Complications: recurrent UTIs, acute urinary retention, hydronephrosis
Treatment
- Alpha-1 adrenergic blockers (tamsulosin, alfuzosin, doxazosin) - relax prostatic smooth muscle
- 5α-reductase inhibitors (finasteride, dutasteride) - inhibit DHT formation; shrink the gland over months
- Combination therapy - most effective for large glands
- Surgical: TURP (transurethral resection of prostate), HIFU, laser therapy, radiofrequency ablation - for medically refractory cases
B. Prostate Cancer
Epidemiology
Pathogenesis & Molecular Biology
- Most common mutations: TMPRSS2-ETS fusion genes and enhanced PI3K/AKT signaling
- Cancers arise most often in the outer peripheral zone (palpable on DRE)
- BPH arises in the transition zone (inner); cancer in the peripheral zone - important distinction
- Prostate cancers are androgen-dependent for growth
Gleason Grading System
| Gleason Score | Grade Group | Risk |
|---|---|---|
| 6 (3+3) | Grade Group 1 | Low |
| 7 (3+4) | Grade Group 2 | Intermediate-favorable |
| 7 (4+3) | Grade Group 3 | Intermediate-unfavorable |
| 8 (4+4) | Grade Group 4 | High |
| 9-10 (4+5, 5+4, 5+5) | Grade Group 5 | Very high |
PSA Screening
- PSA is a kallikrein-type serine protease secreted by prostate epithelium
- PSA >4 ng/mL is the traditional threshold for biopsy, but this lacks precision
- False positives: BPH, prostatitis, recent DRE/ejaculation
- PLCO trial found no mortality benefit from PSA screening; ERSPC showed a 20% relative reduction in prostate cancer death but required screening 1410 men and treating 48 to prevent 1 death
- Current consensus: individualized PSA screening after shared decision-making, particularly for men 55-69 years - Textbook of Family Medicine 9e
Diagnosis
- DRE - firm, hard nodule in peripheral zone; predicts cancer in 18-28% of cases
- PSA - useful for detection, monitoring, and recurrence surveillance
- MRI (multiparametric MRI, mpMRI) - gold standard for localizing lesions and guiding biopsy
- TRUS-guided biopsy - confirms diagnosis; systematic or MRI-targeted
Staging (TNM)
| Stage | Description |
|---|---|
| T1 | Clinically inapparent (not palpable, found incidentally) |
| T2 | Palpable tumor confined within prostate |
| T3 | Extends through prostate capsule |
| T4 | Invades adjacent structures (bladder, rectum) |
Treatment
| Setting | Options |
|---|---|
| Low-risk, localized (Gleason 6, PSA <10) | Active surveillance / watchful waiting |
| Localized (any risk) | Radical prostatectomy (open or robotic), external-beam radiation, brachytherapy |
| Locally advanced | Surgery + radiation, androgen deprivation therapy (ADT) |
| Metastatic / castration-sensitive | ADT (surgical orchiectomy or LHRH agonists/antagonists ± antiandrogens) |
| Castration-resistant (CRPC) | Enzalutamide, abiraterone, docetaxel, cabazitaxel, PARP inhibitors (for BRCA mutations), sipuleucel-T (immunotherapy) |
C. Prostatitis
| Type | Features |
|---|---|
| Acute bacterial prostatitis | Fever, chills, dysuria, perineal/back pain; tender boggy prostate on DRE; E. coli most common; treat with fluoroquinolones |
| Chronic bacterial prostatitis | Recurrent UTIs with same organism; lower urinary tract symptoms; fluoroquinolones x 4-6 weeks |
| Chronic pelvic pain syndrome (CPPS) | Most common form; no identifiable infection; pelvic/perineal pain, voiding symptoms; multifactorial management |
| Asymptomatic inflammatory prostatitis | Found incidentally on biopsy; no treatment required |
Summary Comparison
| Feature | BPH | Prostate Cancer |
|---|---|---|
| Location in gland | Transition zone (periurethral) | Peripheral zone |
| Palpable on DRE? | Smooth, rubbery enlargement | Hard, irregular nodule |
| PSA | Mildly elevated (proportional to size) | Often elevated (but not specific) |
| Histology | Two cell layers (columnar + basal cells) | Single cell layer (no basal cells), nuclear atypia |
| Gland weight | 60-100+ g | Variable |
| Hormonal drive | DHT (5α-reductase) | Testosterone/DHT (androgen receptor) |
| Treatment | Alpha-blockers, 5α-reductase inhibitors, surgery | Surveillance, surgery, radiation, ADT |

What is the meaning of PIRADS
PI-RADS - Prostate Imaging - Reporting and Data System
PI-RADS Score Scale (1-5)
| Score | Meaning | Clinical Action |
|---|---|---|
| 1 | Very low - clinically significant cancer highly unlikely | No biopsy needed |
| 2 | Low - clinically significant cancer unlikely | No biopsy needed |
| 3 | Intermediate - equivocal; presence of significant cancer uncertain | Clinical judgment / consider biopsy |
| ≥ 4 | High - clinically significant cancer likely | Biopsy recommended |
| 5 | Very high - clinically significant cancer highly likely | Urgent targeted biopsy |
What is "Clinically Significant" Prostate Cancer?
The Three mpMRI Sequences in PI-RADS
1. T2-Weighted Imaging (T2WI) - Anatomical (Top row: Axial, Sagittal, Coronal)
- Provides the anatomical roadmap of the prostate
- Normal peripheral zone = bright (hyperintense)
- Cancer = dark (hypointense) focal area - visible as the yellow-outlined region on the axial image
- T2WI is the dominant sequence for the transition zone
2. Diffusion-Weighted Imaging (DWI) - Functional (Bottom left)
- Measures restriction of water molecule diffusion - cancer cells are densely packed, restricting diffusion
- Cancer appears bright on DWI and dark on the ADC map
- DWI is the dominant sequence for the peripheral zone (where most cancers arise)
3. Dynamic Contrast-Enhanced MRI (DCE) - Vascular (Bottom right - color map)
- Tracks IV gadolinium contrast uptake over time
- Cancer shows rapid early enhancement (wash-in) and rapid washout due to tumor angiogenesis
- The red areas on the color perfusion map indicate high blood flow - a hallmark of malignant vascularity
- The caption in your image: "Showing a clinically significant prostate mass with rapid contrast uptake and washout"
- In PI-RADS v2.1, positive DCE (focal early enhancement) can upgrade a PI-RADS 3 peripheral zone lesion to PI-RADS 4
Dominant Sequence Rule in PI-RADS v2.1
| Prostate Zone | Dominant Sequence |
|---|---|
| Peripheral zone (PZ) | DWI |
| Transition zone (TZ) | T2WI |
Clinical Context in Your Image
- MRI-ultrasound fusion targeted biopsy - directly targeting the suspicious lesion outlined in yellow
- This significantly increases the detection rate of clinically significant cancer compared to systematic biopsy alone
↑Glomerulosclerosis → Progressive Loss of Nephrons → Progressive ↓in GFR over ≥ 3 months → Progressive ↑ in serum BUN and Creatinine, Progressive ↑ in Albuminuria, and ↑ risk of other CKD-related complications COULD U EXPLAIN TO ME BUN
urea cycle liver protein metabolism BUN diagram kidney
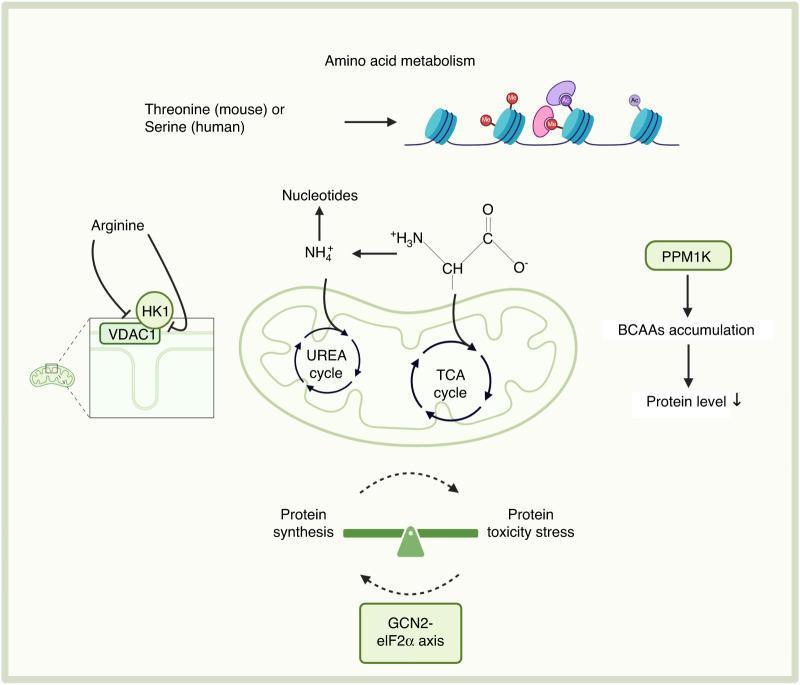
This pathophysiology diagram illustrates the role of amino acid metabolism in maintaining stem cell metabolic homeostasis. The central focus is a mitochondrion where the Urea cycle and TCA cycle take place, interacting with ammonium (NH4+) and alpha-keto acids for nucleotide synthesis. Key metabolic pathways include: 1) The GCN2-eIF2̱̱α axis, which maintains a homeostatic balance between protein synthesis and protein toxicity stress, represented by a seesaw scale with bidirectional feedback loops. 2) Arginine signaling through a complex involving Hexokinase 1 (HK1) and Voltage-Dependent Anion Channel 1 (VDAC1) located at the mitochondrial membrane. 3) Threonine (mouse) or Serine (human) metabolism linked to histone modifications (methylation and acetylation) on nucleosomes, representing epigenetic regulation. 4) The PPM1K pathway, which regulates branched-chain amino acids (BCAAs) accumulation and subsequent protein levels. The diagram effectively maps how specific amino acids serve as signaling molecules and metabolic substrates to coordinate stem cell function, protein proteostasis, and genomic integrity.
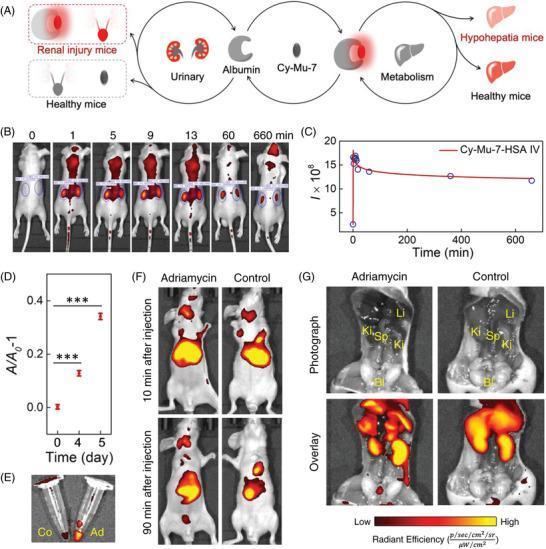
This composite educational graphic illustrates the metabolism and diagnostic application of Cy-Mu-7 near-infrared (NIR) fluorescence probes in murine models of Acute Kidney Injury (AKI). (A) A schematic depicts the metabolic cycle where Cy-Mu-7 binds to albumin (HSA), with high urinary fluorescence indicating renal injury and systemic metabolic changes signaling hypohepatia. (B) Time-dependent in vivo fluorescence imaging shows rapid accumulation in the kidneys within 1 minute post-IV injection, with signal persistence in the bladder through 660 minutes. (C) A corresponding graph quantifies peak fluorescence intensity at 1 minute (~18x10^8) followed by a gradual decline. (D) A line graph shows increased urine protein concentration over 5 days following Adriamycin-induced nephropathy. (E-G) Experimental comparison between healthy (Control) and Adriamycin-treated (AKI) mice. In vivo and ex vivo imaging (G) demonstrate significant fluorescence accumulation in the bladder (Bl) of AKI mice 90 minutes post-injection, highlighting albuminuria. Key landmarks labeled include Kidneys (Ki), Liver (Li), and Spleen (Sp). This figure demonstrates the probe's efficacy for real-time diagnostic imaging of renal clearance and metabolic function.
BUN - Blood Urea Nitrogen
What Does BUN Stand For and Mean?
Step-by-Step: How BUN is Produced
Dietary Protein
↓
Digested → Amino Acids
↓
Amino acids broken down (catabolism) → releases Ammonia (NH₃)
↓ (Ammonia is TOXIC to the brain!)
LIVER converts NH₃ → UREA
(via the Urea Cycle)
↓
Urea enters the BLOODSTREAM → measured as BUN
↓
KIDNEYS filter urea → excreted in URINE
What is the Normal BUN Range?
| Parameter | Normal Value |
|---|---|
| BUN | 5 - 20 mg/dL |
| Serum Creatinine (for comparison) | 0.6 - 1.2 mg/dL (men), 0.5 - 1.1 mg/dL (women) |
- Frameworks for Internal Medicine
Why Does BUN Rise in CKD? (Your Context)
↑Glomerulosclerosis → Progressive loss of nephrons → Progressive ↓ GFR → Progressive ↑ BUN
- Healthy kidneys freely filter urea at the glomerulus, then partially reabsorb it, and excrete the rest in urine
- As GFR falls in CKD, fewer nephrons are functioning → the kidneys cannot filter and excrete urea fast enough
- Urea accumulates in the blood → BUN rises
- This is called azotemia (elevated nitrogenous waste products in blood) - Quick Compendium of Clinical Pathology 5e
Important: BUN is NOT a Perfect Kidney Test
Causes of HIGH BUN (not always kidney disease):
| Cause | Why BUN rises |
|---|---|
| High-protein diet | More protein → more urea produced |
| GI bleed (upper) | Blood in gut is digested as protein → more urea |
| Dehydration / low blood volume | Kidneys reabsorb more urea (prerenal cause) |
| Fever, infection, burns, trauma | Increased protein catabolism |
| Glucocorticoids (steroids) | Anti-anabolic; increase protein breakdown |
| Obstruction of urine flow | Urea backs up into blood |
| CKD / AKI | Reduced GFR → less excretion |
Causes of LOW BUN:
| Cause | Why BUN falls |
|---|---|
| Low-protein diet / malnutrition | Less substrate for urea production |
| Liver disease / liver failure | Liver cannot synthesize urea from ammonia |
| Rhabdomyolysis | Creatinine rises disproportionately, BUN relatively lower |
- Brenner & Rector's The Kidney; Frameworks for Internal Medicine
BUN vs. Creatinine - Which is Better for Kidney Function?
| BUN:Creatinine Ratio | Interpretation |
|---|---|
| >20:1 | Prerenal cause (dehydration, GI bleed, low flow) |
| 10-20:1 | Normal or intrinsic renal disease |
| <10:1 | Low protein intake, liver disease, or dialysis |
- Comprehensive Clinical Nephrology 7e
The Term "Uremia"
- Nausea, vomiting, anorexia
- Altered mental status, encephalopathy ("uremic encephalopathy")
- Pericarditis ("uremic pericarditis")
- Pruritus (itching from urea crystals in skin)
- Platelet dysfunction → bleeding tendency
- "Uremic frost" (white crystalline deposits on skin in very advanced cases)
Azotemia = elevated BUN/creatinine (a lab finding) Uremia = azotemia with symptoms (a clinical syndrome)
- Quick Compendium of Clinical Pathology 5e
Tying It Back to Your CKD Pathway
↑ Glomerulosclerosis
↓
Progressive loss of nephrons
↓
↓ GFR (fewer glomeruli filtering)
↓
Less urea filtered and excreted per day
↓
Urea accumulates in blood
↓
↑ BUN (Azotemia)
↓ (if severe/untreated)
UREMIA
(toxic syndrome)
WHERE IS THE TUBULAR CELLS AND RELATED TO CKD?
renal tubular cells anatomy nephron proximal tubule histology
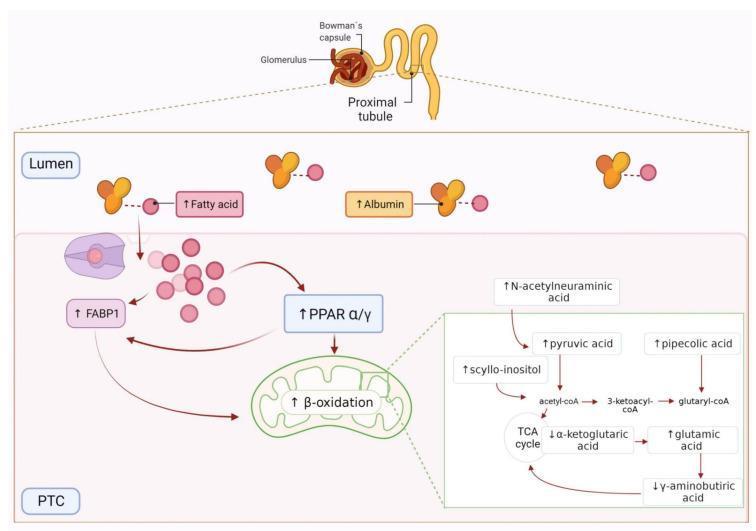
This medical illustration depicts the pathophysiology of fatty acid oxidation (FAO) in renal proximal tubular cells (PTCs). The top panel shows a nephron diagram highlighting the glomerulus, Bowman’s capsule, and proximal tubule. The main panel illustrates the transition from the tubular lumen to the PTC. In the lumen, increased albumin-bound fatty acids are shown entering the PTC via FABP1 (Fatty Acid Binding Protein 1). Intracellularly, there is an upregulation of PPAR ̑/̳, leading to increased mitochondrial ̒-oxidation. A detailed metabolic map within the mitochondrial compartment shows altered metabolite abundance associated with early renal damage. Specifically, it displays increased levels of N-acetylneuraminic acid, scyllo-inositol, pyruvic acid, pipecolic acid, and glutamic acid. Conversely, it shows decreased levels of ̑-ketoglutaric acid and ̳-aminobutyric acid (GABA). These changes are linked to the TCA cycle and acetyl-CoA production. This diagram serves as an educational tool for understanding metabolic reprogramming and cardiorenal risk in the context of normoalbuminuric hypertension.
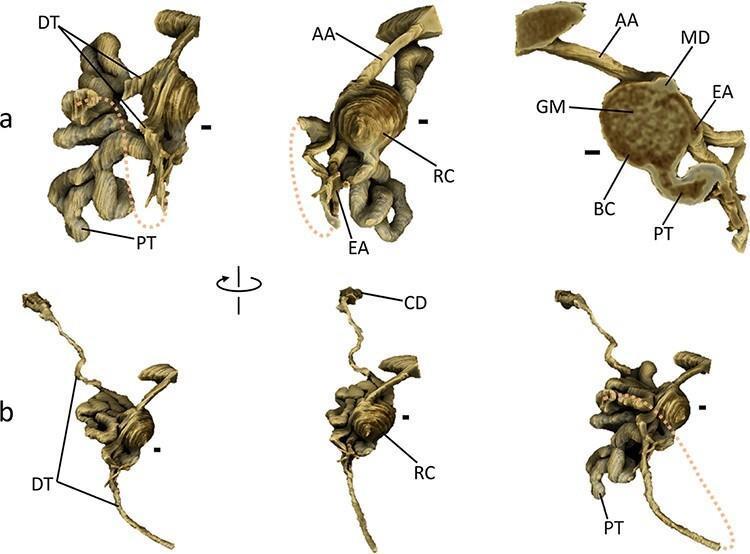
Anatomical diagram featuring high-resolution 3D renderings of a single mouse nephron, highlighting renal microstructure and spatial arrangement. Panel (a) provides detailed views of the renal corpuscle (RC), demonstrating the spherical Bowman's capsule (BC) and internal glomerulus (GM). It clearly illustrates the vascular pole with the afferent arteriole (AA), efferent arteriole (EA), and the macula densa (MD) of the distal tubule (DT) forming a v-shaped contact point. The tubular pole shows the exit of the highly convoluted proximal tubule (PT). Panel (b) illustrates the longitudinal progression from the renal corpuscle through the PT and DT to the collecting duct (CD). The rendering distinguishes between the intensely convoluted segments near the corpuscle and the straighter distal segments of the tubules. Key educational concepts include the juxtaglomerular apparatus anatomy, the morphology of glomerular filtration components, and the physical relationship between various segments of the nephron and their associated vasculature, essential for understanding renal physiology and pathology.
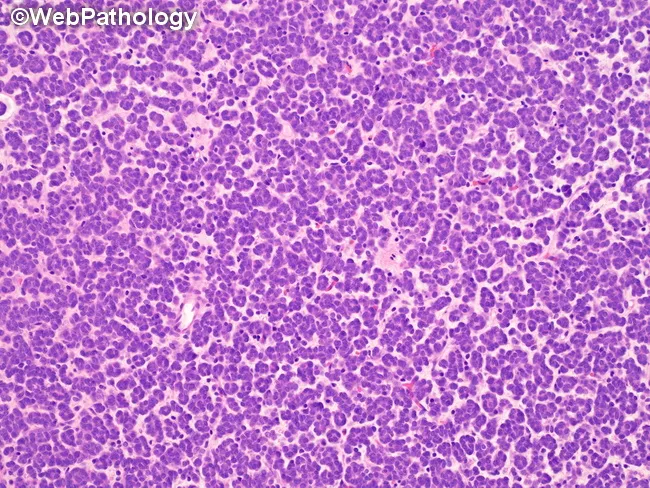
This is a histopathology image obtained from renal tumor tissue stained with Hematoxylin and Eosin (H&E) and viewed under light microscopy. The specimen corresponds to metanephric adenoma of the kidney, characterized by embryonal-appearing epithelial cells arranged in tightly packed small tubules. The tubules are commonly separated by scant acellular stroma that may be hyalinized or edematous. Lumina are abortive or extremely small, giving a primitive appearance evocative of developing metanephric tubules; in about one third of cases substantial hyalinizing stroma underscores tubule separation. The tumor cells display uniform, round to oval nuclei with scant cytoplasm and high cellular density, producing a solid to microtubular architectural pattern. The histology mimics primitive Wilms tumor and other embryonal renal neoplasms, raising differential diagnosis challenges. Important diagnostic features include the tubular architecture mimicking metanephric development, minimal cytologic atypia, and the presence or absence of conspicuous stromal components. Immunohistochemical stains and molecular testing may aid distinction from Wilms tumor, but routine H&E features often suffice when kidney-specific patterns are observed. Clinically, accurate recognition of metanephric adenoma is essential because prognosis is excellent after nephron-sparing surgery and overtreatment for a malignant pediatric neoplasm is avoided. This image is valuable for educational, diagnostic, and research contexts in renal pathology.
nephron tubular atrophy interstitial fibrosis CKD chronic kidney disease histology
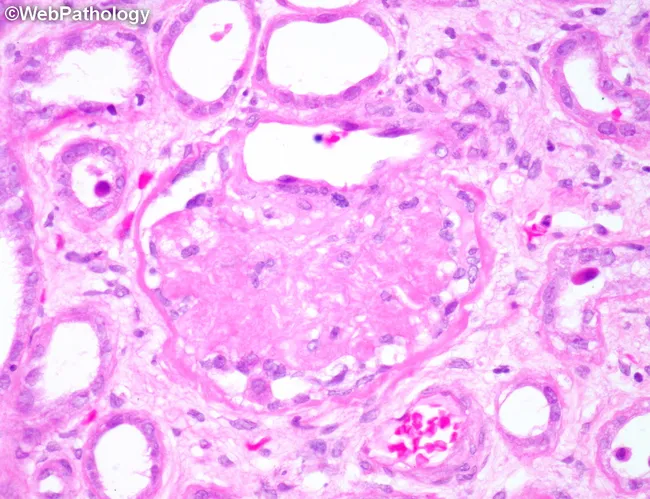
Renal cortical biopsy by light microscopy with Hematoxylin and Eosin staining. The image shows a globally sclerotic glomerulus surrounded by atrophic tubules within the renal cortex. The sclerotic tuft demonstrates obliteration of capillary lumina with increased mesangial matrix; tubulointerstitial compartment shows tubular atrophy and mild interstitial fibrosis. Vascular changes include hyaline arteriolosclerosis of small arteries and arterioles, compatible with chronic nephrosclerosis from long-standing hypertension. No acute inflammatory infiltrates or crescents are observed. This pattern is characteristic of benign hypertensive nephrosclerosis and contrasts with diabetic nephropathy or inflammatory glomerulonephritis. The accompanying tubules atrophy underscores chronic ischemic injury and reduced nephron mass. Clinically, such histology correlates with progressive decline in glomerular filtration rate (GFR), potential proteinuria, and risk of chronic kidney disease progression. Differential considerations include ischemic nephropathy due to vascular disease, age-related nephrosclerosis, and secondary hypertensive kidney injury. Understanding this morphology aids in etiologic assessment of CKD and guides management focusing on blood pressure control and renal protective strategies. This image is valuable for pathology education, nephrology training, and research on hypertensive vascular injury in the kidney. This pattern is commonly seen in chronic hypertensive patients.
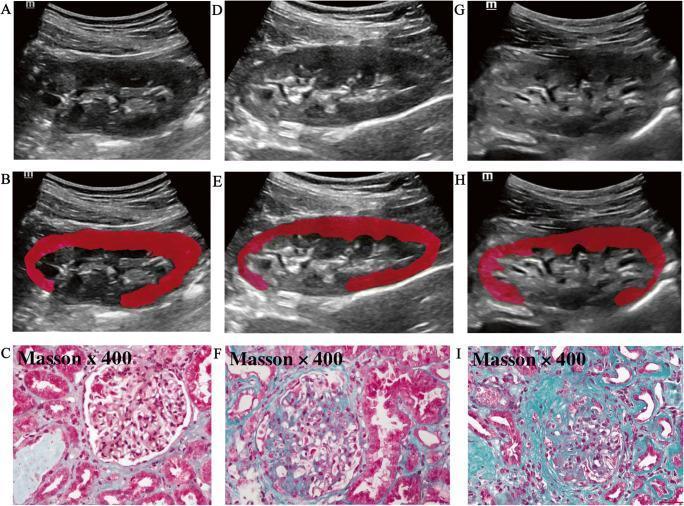
A nine-panel comparison figure illustrating the correlation between B-mode ultrasound imaging and histopathology in chronic kidney disease (CKD) across varying severities of interstitial fibrosis and tubular atrophy (IFTA). Panels A, D, and G present longitudinal B-mode ultrasound scans of the kidney. Progressing from mild (A) to severe (G) IFTA, the images demonstrate increasing cortical echogenicity, textural heterogeneity, and a progressive loss of corticomedullary differentiation. Panels B, E, and H show the same ultrasound scans with superimposed red regions of interest (ROI) generated via ITK-SNAP software for cortical radiomics analysis. Panels C, F, and I display corresponding kidney biopsy specimens with Masson’s trichrome staining (x400 magnification). Panel C (mild IFTA) shows preserved tubular architecture and minimal collagen. Panel F (moderate IFTA) exhibits increased interstitial collagen (blue staining) and early tubular atrophy. Panel I (severe IFTA) demonstrates extensive interstitial fibrosis, marked tubular atrophy, and glomerular sclerosis. This comparison highlights the visual indicators of renal structural decline used for non-invasive IFTA staging.
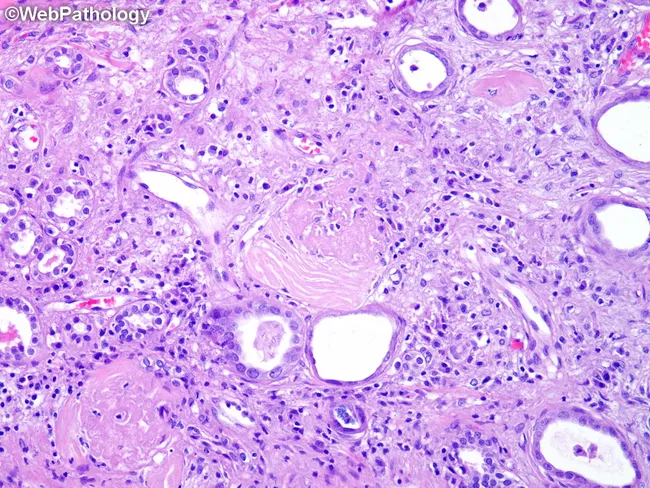
Light microscopy of formalin-fixed, paraffin-embedded renal parenchyma stained with Hematoxylin and Eosin shows advanced chronic cystic kidney disease consistent with Autosomal Dominant Polycystic Kidney Disease (ADPKD). The cortex and outer medulla are disrupted by cysts of varying size, separated by pronounced fibrous stroma. Interstitial fibrosis replaces normal tubular architecture, and several glomeruli are sclerotic with hyalinization of their tufts and thickened basement membranes. Arterioles and small arteries exhibit hyaline arteriolosclerosis with luminal narrowing, contributing to ischemic tubular injury. Tubular atrophy with thickened basement membranes and dilated, atrophic tubules line the interstitium. Calcific deposits are present within the interstitium or cyst walls near the periphery of fibrotic tissue. A chronic inflammatory infiltrate, dominated by lymphocytes and plasma cells, is intermixed with the fibrotic matrix. The overall pattern reflects long-standing nephron loss with compensatory hyperplastic changes in remaining nephrons. This histology supports the diagnosis of polycystic kidney disease and correlates with progressive renal dysfunction. Clinically, such tissue findings align with ADPKD severity, often accompanied by hypertension and risk of renal failure; differential considerations include other cystic diseases and chronic nephritis. The image exemplifies characteristic cyst-induced parenchymal remodeling and vascular compromise that underlie reduced glomerular filtration rate. These features are typical of late-stage disease.
Tubular Cells - Location, Function, and Role in CKD
PART 1: Where Are the Tubular Cells?
GLOMERULUS (filtering unit)
↓ filtered fluid enters
PROXIMAL CONVOLUTED TUBULE (PCT) ← in the CORTEX
↓
LOOP OF HENLE
- Thin descending limb ← dips into MEDULLA
- Thin ascending limb
- Thick ascending limb ← back to CORTEX
↓
DISTAL CONVOLUTED TUBULE (DCT) ← in the CORTEX
↓
COLLECTING DUCT ← passes through CORTEX & MEDULLA
↓
URINE exits to renal pelvis → ureter → bladder
PART 2: Nephron Anatomy Diagram
PART 3: What Each Tubular Segment Does
| Segment | Tubular Cell Function |
|---|---|
| Proximal Convoluted Tubule (PCT) | Reabsorbs ~65% of filtered Na⁺, K⁺, Ca²⁺; ALL filtered glucose; amino acids; bicarbonate; water. This is the WORKHORSE - reabsorbs ~60% of total filtrate. |
| Loop of Henle (descending) | Highly permeable to water - water moves out, concentrating the filtrate |
| Loop of Henle (ascending) | Pumps out Na⁺, K⁺, Cl⁻ - water CANNOT follow (impermeable to water) - creates concentrated medullary interstitium |
| Distal Convoluted Tubule (DCT) | Fine-tunes Na⁺ and Ca²⁺ reabsorption; responds to aldosterone and PTH |
| Collecting Duct | Final regulation of water (via ADH/vasopressin) and acid-base balance; principal cells (Na⁺/K⁺) and intercalated cells (H⁺/HCO₃⁻) |
- Campbell-Walsh-Wein Urology, p. 2549
PART 4: How Tubular Cells Relate to CKD
The Sequence of Tubular Injury in CKD:
Glomerulosclerosis (from your original pathway)
↓
Reduced blood supply to peritubular capillaries
(the capillary network that feeds tubular cells)
↓
TUBULAR CELL ISCHEMIA & INJURY
↓
Tubular cells release TGF-β, Angiotensin II
↓
Myofibroblast activation in the interstitium
↓
Interstitial Fibrosis + Tubular Atrophy
(IFTA - the hallmark finding in CKD biopsy)
↓
More nephron loss → further ↓ GFR
(vicious cycle of progression)
- Comprehensive Clinical Nephrology 7e; Robbins & Kumar Basic Pathology
What Happens to the Tubular Cells Specifically:
| Stage | What Happens to Tubular Cells |
|---|---|
| Early injury | Tubular cells swell, lose their brush border, undergo apoptosis (programmed death) |
| Ongoing injury | Surviving tubular cells undergo hypertrophy (enlargement) to compensate for lost neighbors |
| Progressive damage | Tubular cells transform and secrete pro-fibrotic signals (TGF-β) - this triggers fibrosis |
| Late CKD | Tubular cells completely lost → tubular atrophy - tubes shrink, collapse, and are replaced by scar tissue |
| End stage | Entire nephron lost (glomerulus + tubule) - no recovery possible |
PART 5: Histology - What You See on Kidney Biopsy in CKD
IFTA (Interstitial Fibrosis and Tubular Atrophy) - the hallmark of CKD
PART 6: Why Tubular Atrophy is the Best Prognostic Marker in CKD
"End result of progressive nephron loss from any cause, leading to glomerular obliteration, tubular atrophy, and interstitial fibrosis." - Robbins & Kumar Basic Pathology
- There are ~1 million nephrons per kidney - each nephron is one glomerulus PLUS its attached tubule
- When the tubule is destroyed, the whole nephron is functionally dead - even if the glomerulus still looks intact
- The kidney has limited ability to regenerate tubular cells once severely damaged
PART 7: Consequences of Tubular Cell Loss in CKD
| Lost Tubular Function | Clinical Consequence in CKD |
|---|---|
| Impaired Na⁺ reabsorption | Salt wasting OR sodium retention → hypertension/edema |
| Impaired K⁺ secretion | Hyperkalemia (dangerous arrhythmias) |
| Impaired H⁺ secretion | Metabolic acidosis (low bicarbonate) |
| Impaired EPO production (peritubular cells) | Anemia of CKD |
| Impaired 1α-hydroxylation of Vitamin D | Hypocalcemia + Renal osteodystrophy |
| Impaired water concentration (collecting duct) | Nocturia, polyuria (can't concentrate urine) |
| Impaired urea excretion (connects back to BUN!) | ↑ BUN = azotemia/uremia |
Summary: Tubular Cells and CKD in One Picture
HEALTHY NEPHRON
Glomerulus filters → Tubular cells process → Clean urine out
↓ (CKD)
Glomerulosclerosis → ↓ peritubular blood flow
↓
Tubular cell ischemia/injury → TGF-β release
↓
Tubular ATROPHY + Interstitial FIBROSIS (IFTA)
↓
Entire nephron lost → ↓↓ GFR
↓
↑ BUN, ↑ Creatinine, ↑ K⁺, ↓ HCO₃⁻, ↓ Hb, ↓ Ca²⁺
= Full CKD complication picture

WHAT IS THE MEAN BY AA AND AL?
amyloid Congo red staining kidney glomerulus AL AA amyloidosis histology
amyloidosis glomerulus kidney biopsy Congo red apple green birefringence
AL vs. AA Amyloidosis - What Do They Mean?
AL Amyloidosis - "A" + "L" (Amyloid Light chain)
| Feature | Detail |
|---|---|
| Full name | Amyloid - Light chain |
| Protein source | Immunoglobulin light chains (fragments of antibody) |
| Produced by | Clonal plasma cells (abnormal B-cells) |
| "L" stands for | Light chain (the small half of an antibody) |
| Which light chain? | Predominantly λ (lambda) over κ (kappa) - ratio 12:1 in kidney disease |
What causes too many light chains?
Key facts about AL amyloidosis:
- Most common type in developed countries (~8 per million/year)
- Median age: 59-63 years; men affected 2x more than women
- Kidneys are the most common organ involved - almost all patients eventually develop renal amyloid
- Up to 20% of AL amyloidosis cases also have overt multiple myeloma
- ~90% of patients will have a paraprotein spike detectable in serum/urine on immunofixation - Brenner & Rector's The Kidney
AA Amyloidosis - "A" + "A" (Amyloid A)
| Feature | Detail |
|---|---|
| Full name | Amyloid - A protein (also written "secondary amyloidosis") |
| Protein source | Serum Amyloid A (SAA) - an acute-phase reactant made by the liver |
| Produced in response to | Chronic inflammation |
| "A" stands for | Amyloid A (the name of the precursor protein: SAA) |
What causes too much SAA?
- RA = Rheumatoid Arthritis
- IBD = Inflammatory Bowel Disease (Crohn's disease, ulcerative colitis)
- Other: ankylosing spondylitis, tuberculosis, bronchiectasis, familial Mediterranean fever, osteomyelitis, leprosy
Side-by-Side Comparison
| Feature | AL | AA |
|---|---|---|
| "A" = ? | Amyloid | Amyloid |
| "L" or second "A" = ? | Light chain | Amyloid A protein (SAA) |
| Origin of protein | Plasma cells / B-cell clone | Liver (acute phase reactant) |
| Trigger | Plasma cell dyscrasia (cancer) | Chronic inflammation |
| Classic disease | Multiple myeloma | RA, IBD, tuberculosis |
| Kidney involvement | Yes - very common | Yes - kidneys, liver, spleen |
| Treatment target | Kill the plasma cell clone (chemo, stem cell transplant) | Suppress the underlying inflammation |
How Both Damage the Kidney (Your Slide's Pathway)
Abnormal protein circulates in blood
(Light chains in AL / SAA in AA)
↓
Deposits into GLOMERULUS
(starts in mesangium → spreads to GBM)
↓
Thickening of Glomerular Basement Membrane (GBM)
↓
Damage and effacement of PODOCYTES
(podocytes = the cells that form the filtration barrier)
↓
Filtration barrier breaks down
↓
NONSELECTIVE PROTEINURIA
(large proteins like albumin AND immunoglobulins leak through)
↓
NEPHROTIC SYNDROME
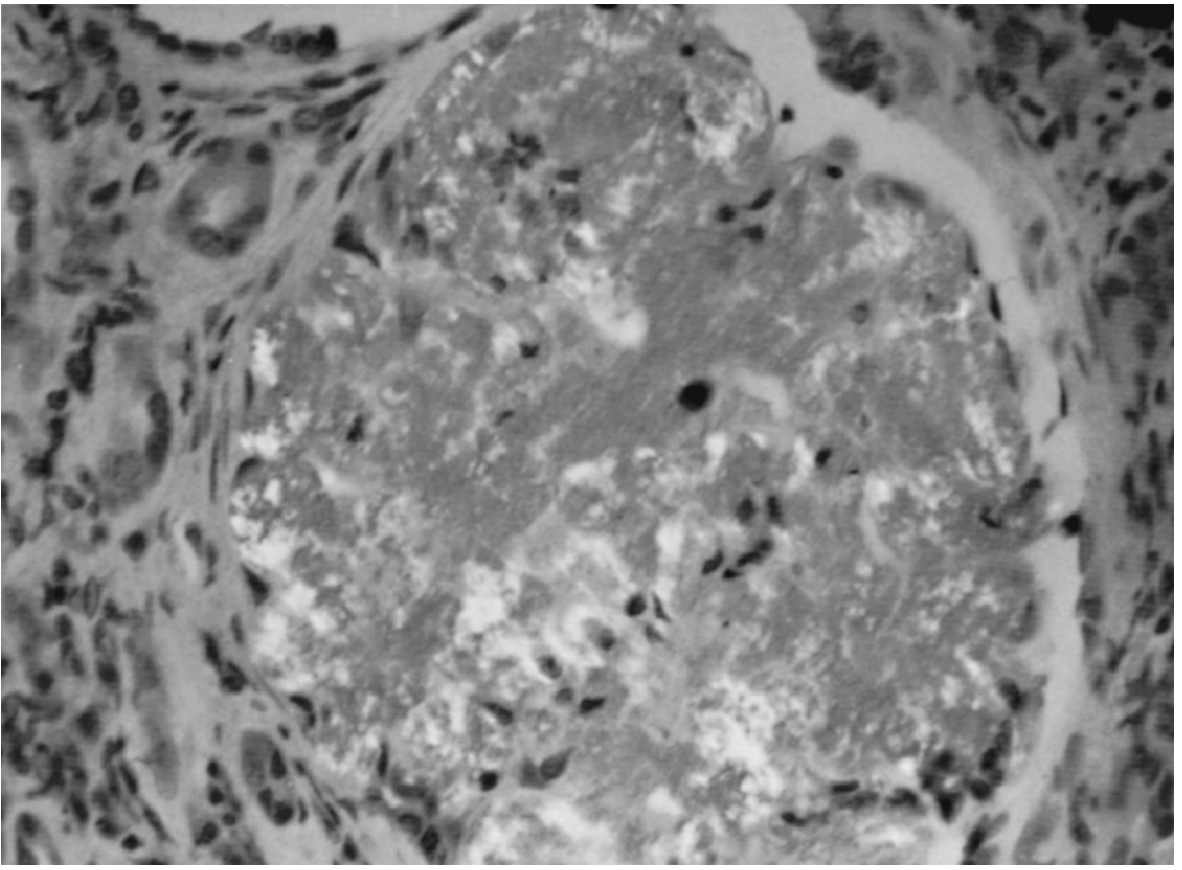
What It Looks Like Under the Microscope
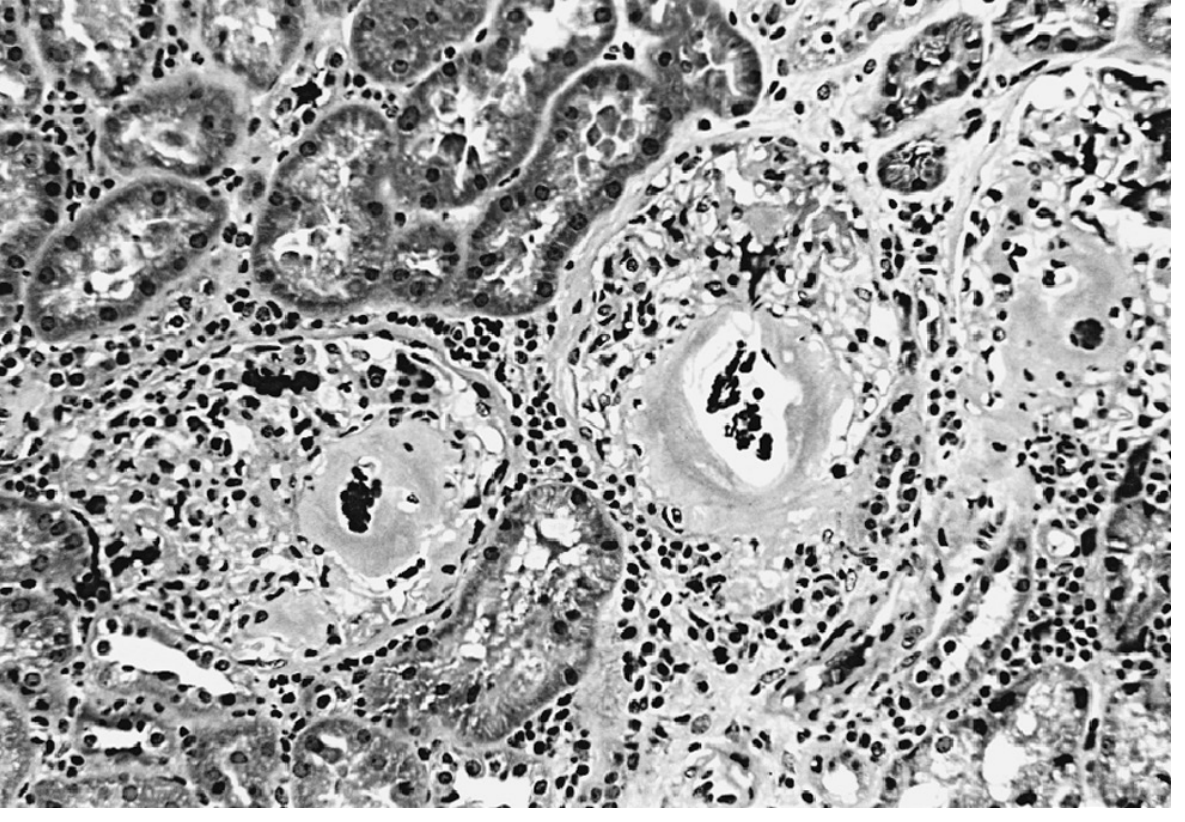
Quick Memory Trick
AL = Antibody Light chains = from a Lymphoid/plasma cell cancer (Multiple MyeLoma)AA = Acute phase protein = from chronic inflammation (RA, IBD, infections)
BRILLIANT, THX. WHATIS ROS?
ROS - Reactive Oxygen Species
What Does ROS Stand For?
The Three Main ROS (in order of increasing danger)
| ROS | Symbol | Also Called | Source |
|---|---|---|---|
| Superoxide | O₂⁻ | Superoxide anion | First ROS made in mitochondria |
| Hydrogen Peroxide | H₂O₂ | - | Made from superoxide by SOD enzyme |
| Hydroxyl Radical | HO• | OH• | Most dangerous - made from H₂O₂ via Fenton reaction |
Where Do ROS Come From?
Normal (physiological) production:
- Mitochondria - during normal ATP production (oxidative phosphorylation), small amounts of O₂⁻ "leak" from the electron transport chain
- Immune cells (neutrophils, macrophages) - deliberately produce ROS (the "oxidative burst") to kill bacteria and fungi
Pathological (excessive) production triggered by:
-
Radiation
-
Toxins / poisons
-
Ischemia-reperfusion injury (e.g., after a heart attack when blood flow returns)
-
Chronic inflammation
-
Heavy metals (iron, copper - catalyze Fenton reaction)
-
Basic Medical Biochemistry 6e; Robbins, Cotran & Kumar Pathologic Basis of Disease
The Full ROS Pathway - Diagram
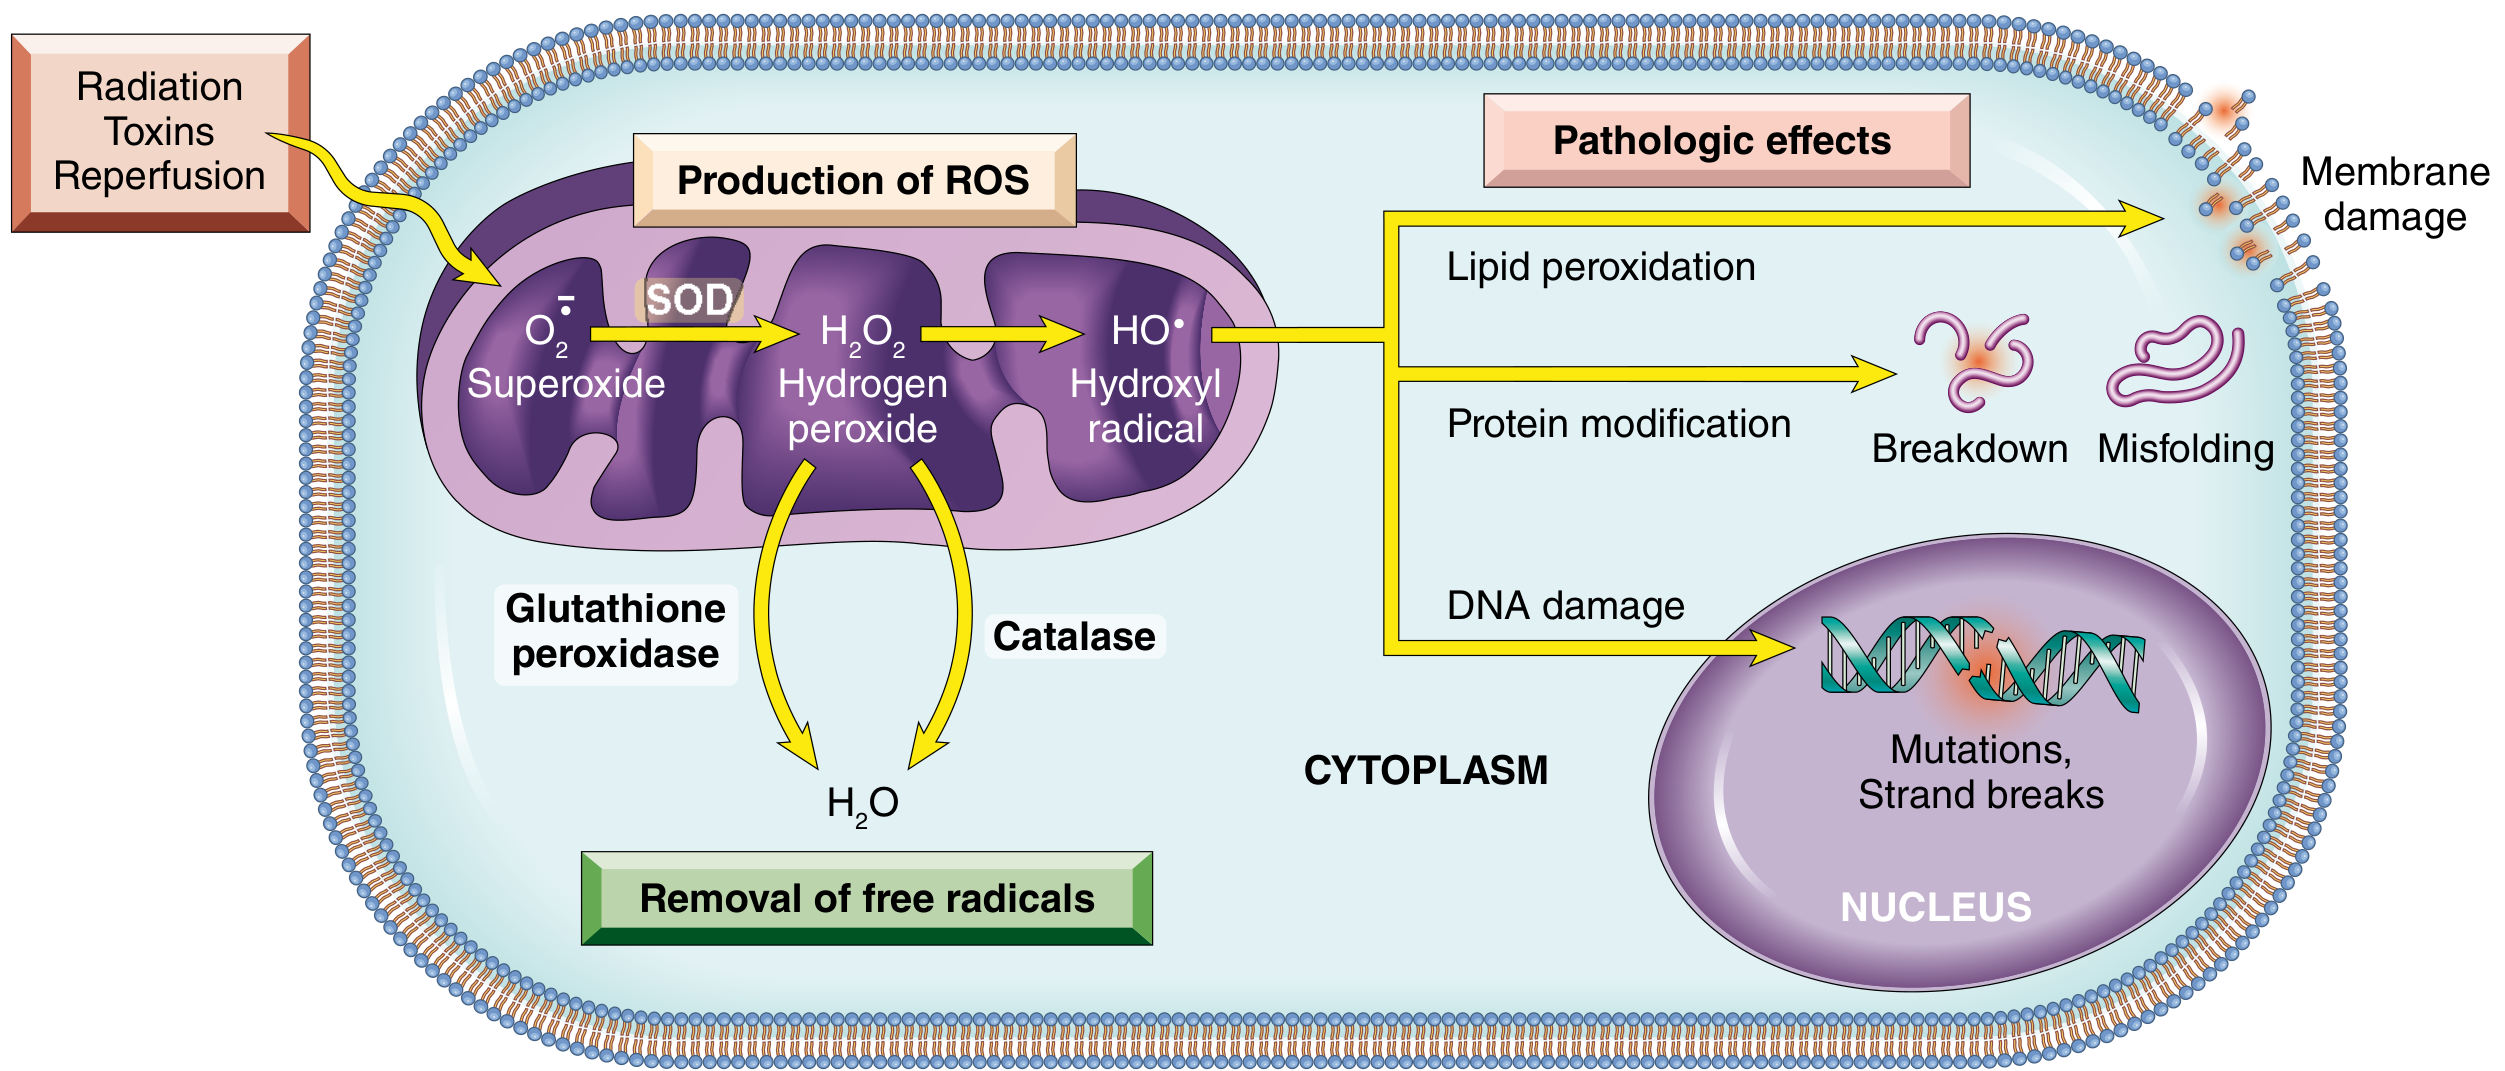
How ROS Damage Cells - 3 Main Pathways
1. Lipid Peroxidation - Membrane Damage
- ROS attack the double bonds in fatty acids of cell membranes
- This creates lipid peroxides which are themselves unstable
- A chain reaction propagates - one ROS can destroy dozens of membrane lipids
- Result: membrane rupture → cell death
2. Protein Modification
- ROS oxidize amino acid side chains
- Form abnormal protein-protein cross-links
- Destroy enzyme active sites
- Cause protein misfolding (notice: this also contributes to amyloid formation - connecting back to your previous question!)
- Result: loss of enzyme function, disrupted cell structure
3. DNA Damage
-
ROS cause single- and double-strand breaks in DNA
-
Cross-link DNA strands
-
Form mutagenic DNA adducts
-
Result: mutations → cancer, accelerated aging, or apoptosis
-
Robbins, Cotran & Kumar Pathologic Basis of Disease
How the Body Defends Against ROS
| Defense | How It Works |
|---|---|
| SOD (Superoxide Dismutase) | Converts O₂⁻ → H₂O₂ (less dangerous) |
| Catalase (in peroxisomes) | Breaks down H₂O₂ → H₂O + O₂ (harmless) |
| Glutathione Peroxidase | Neutralizes H₂O₂ using glutathione (GSH) |
| Vitamin E | Fat-soluble antioxidant - scavenges ROS in membranes |
| Vitamin C (ascorbic acid) | Water-soluble antioxidant in cytoplasm |
| Transferrin / Ferritin | Bind free iron → prevent Fenton reaction (iron makes HO•) |
- Robbins, Cotran & Kumar Pathologic Basis of Disease
ROS and Disease - Real Examples
| Disease | How ROS Involved |
|---|---|
| Atherosclerosis | ROS oxidize LDL cholesterol → oxidized LDL triggers plaque formation |
| Myocardial infarction | Ischemia-reperfusion after heart attack floods cells with ROS |
| CKD / kidney disease | Chronic inflammation → persistent ROS → tubular cell injury, fibrosis |
| Cancer | ROS cause DNA mutations → malignant transformation |
| Aging | Lifelong accumulation of ROS damage to DNA, proteins, membranes |
| ALS | Mutations in SOD gene → can't neutralize superoxide → motor neuron damage |
| Parkinson's disease | Dopaminergic neurons especially vulnerable to ROS damage |
| Reperfusion injury | Reoxygenation after ischemia creates burst of ROS |
ROS in Context of Your CKD Studies
Glomerulosclerosis → ischemia of tubular cells
↓
Ischemia → ↑ ROS production in tubular cells
↓
ROS damage tubular cell membranes, proteins, DNA
↓
Tubular cell apoptosis/death
↓
Release of TGF-β (profibrotic signal)
↓
Interstitial fibrosis + tubular atrophy
↓
Further nephron loss → worsening GFR
ROS = "Rogue Oxygen molecules" that steal electrons, wreck membranes, mangle proteins, and mutate DNA - unless your antioxidant defenses (SOD, catalase, vitamins C & E) stop them first.
OK WHAT IS THE HWNOCH-SCHONLEIN PURPURA? IN BRIEF
Henoch-Schonlein purpura palpable purpura rash skin legs vasculitis
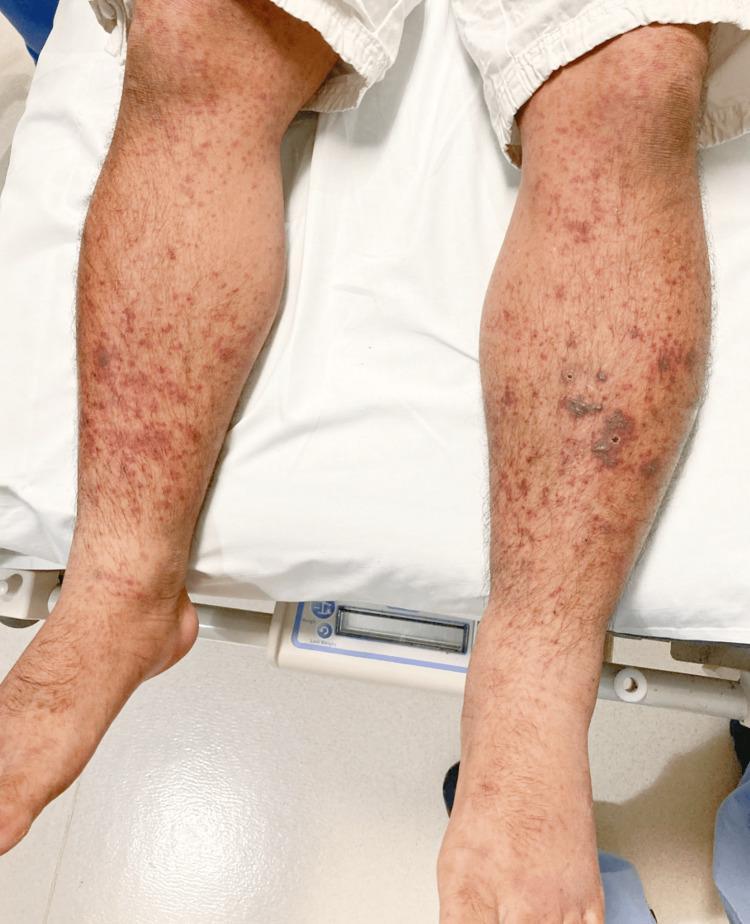
This clinical photograph displays a bilateral, symmetric palpable purpuric rash on the lower extremities of an adult male. The lesions extend from the dorsal feet and ankles up to the lower thighs. The primary morphology consists of numerous non-blanching, reddish-purple macules and papules that vary in size from pinpoint petechiae to larger, confluent ecchymotic patches. On the anterior and lateral aspects of the legs, the lesions are densely packed, with some appearing as dark necrotic-looking areas or small ulcerations, particularly on the right leg. The background skin shows mild surrounding erythema without significant scaling or edema. This presentation is characteristic of small-vessel vasculitis, specifically IgA vasculitis (Henoch-Schönlein purpura), which typically presents with this gravity-dependent distribution. The image serves as a classic educational example of palpable purpura, a hallmark sign of systemic vasculitis often involving the skin, gastrointestinal tract, and kidneys.
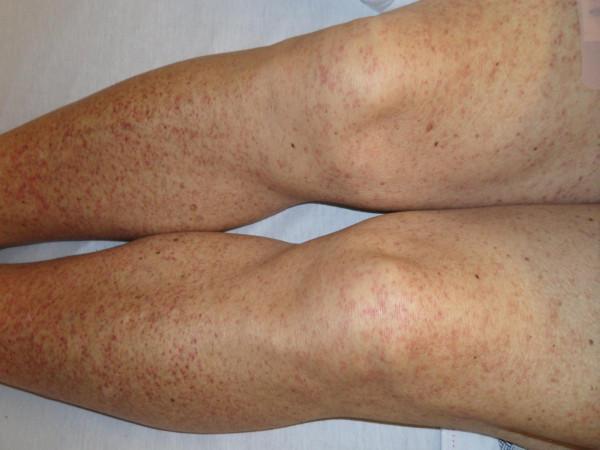
This clinical photograph displays the lower extremities of a patient exhibiting a generalized skin rash. The primary visual finding consists of numerous small, erythematous to purplish macules and papules consistent with palpable purpura. The lesions are bilaterally symmetrical and extensively distributed across the thighs, knees, and lower legs. The morphology shows individual pinpoint lesions (petechiae) and larger coalescing clusters (ecchymoses), particularly concentrated on the shins and calves. This presentation is a classic dermatological manifestation of small-vessel vasculitis, such as IgA vasculitis (Henoch-Schönlein purpura). The image serves as an educational reference for identifying non-blanching, gravity-dependent purpuric eruptions in the context of systemic inflammatory or autoimmune conditions. Clinical significance lies in the recognition of these lesions as a primary diagnostic sign of cutaneous leukocytoclastic vasculitis, often associated with systemic involvement including gastrointestinal symptoms and renal pathology.
Henoch-Schönlein Purpura (HSP)
What Is It?
The Root Cause in One Line
Abnormal IgA immune complexes form → deposit in small vessel walls → trigger inflammation → damage multiple organs simultaneously.
The Classic TETRAD (4 Features)
| # | Feature | What You See |
|---|---|---|
| 1 | Skin (Purpura) | Palpable purpura - non-blanching reddish-purple spots/bumps on lower limbs and buttocks |
| 2 | Joints (Arthritis) | Pain and swelling, mostly ankles and knees - no permanent deformity |
| 3 | Gut (GI involvement) | Colicky abdominal pain, nausea, vomiting, GI bleeding (25-90% of patients) |
| 4 | Kidneys (Nephritis) | Hematuria ± proteinuria = IgA nephropathy-like glomerulonephritis |
The Rash - Classic Appearance
Why Skin Lesions Don't Blanch?
HSP vs. IgA Nephropathy - How Are They Related?
| Feature | HSP | IgA Nephropathy (Berger's Disease) |
|---|---|---|
| Both caused by | IgA immune complex deposits | IgA immune complex deposits |
| Kidney finding | Same (mesangial IgA) | Same (mesangial IgA) |
| Systemic features | YES - skin, joints, gut | NO - kidney only |
| Age | Children (5-10 yr peak) | Young adults |
| Think of HSP as | Systemic IgA nephropathy | Kidney-limited HSP |
Outcome
- Most children recover completely within weeks to months
- Renal involvement is the main concern for long-term prognosis
- More severe kidney disease occurs in older children and adults
- HSP accounts for up to 15% of all glomerulonephritis in young children
In Brief - One Paragraph Summary
HSP = a child gets a throat infection → abnormal IgA is made → IgA immune complexes deposit in small vessels → leukocytoclastic vasculitis → palpable purpura on legs + colicky belly pain + swollen joints + blood/protein in urine. It is the systemic version of IgA nephropathy. Most kids recover fully.
- Brenner & Rector's The Kidney
TO DIAGNOSE WHAT I NEED AND WHAT IS THE DIFFERENCE?
How to Diagnose HSP - and How to Differentiate It from IgA Nephropathy
PART 1: How to Diagnose HSP
A. 1990 ACR Criteria (Adults) - need at least 2 of 4:
| Criterion | Description |
|---|---|
| 1. Palpable purpura | Non-blanching raised purpuric skin lesions (NOT due to low platelets) |
| 2. Age ≤ 20 at onset | Younger age at disease onset |
| 3. Bowel angina | Diffuse colicky abdominal pain, worse after meals, or bloody diarrhea |
| 4. Granulocytes on biopsy | Biopsy of skin or bowel wall showing granulocytes in vessel walls |
B. EULAR/PrES Criteria (Pediatric - more commonly used now)
| Supporting Feature | Example |
|---|---|
| Diffuse abdominal pain | Colicky pain, GI bleed |
| Any biopsy showing predominant IgA deposition | Skin or kidney biopsy |
| Arthritis OR arthralgia | Joint pain/swelling |
| Renal involvement | Hematuria OR proteinuria |
PART 2: The Diagnostic Workup - What Tests You Need
Step 1 - Clinical Examination
- Look for palpable purpura on lower extremities/buttocks (almost universal)
- Check joints for swelling/tenderness (ankles, knees most common)
- Abdominal examination for tenderness
Step 2 - Urine Tests
- Urinalysis - look for hematuria (red cells) and proteinuria
- Urine microscopy - red cell casts = glomerulonephritis
- Urine protein:creatinine ratio - quantify proteinuria
Step 3 - Blood Tests
| Test | Expected Result in HSP |
|---|---|
| Full blood count | Platelet count NORMAL (key! - rules out thrombocytopenic purpura) |
| Serum IgA | Elevated in ~50% of patients (but not always) |
| Complement (C3, C4) | Usually NORMAL (unlike lupus where C3/C4 are low) |
| ANA, ANCA | Negative (rules out SLE, ANCA vasculitis) |
| Renal function (Creatinine, BUN) | May be elevated if renal involvement |
| Galactose-deficient IgA1 | Elevated (shared with IgA nephropathy) |
Step 4 - Biopsy (when needed)
- Shows leukocytoclastic vasculitis (neutrophils destroying small vessel walls)
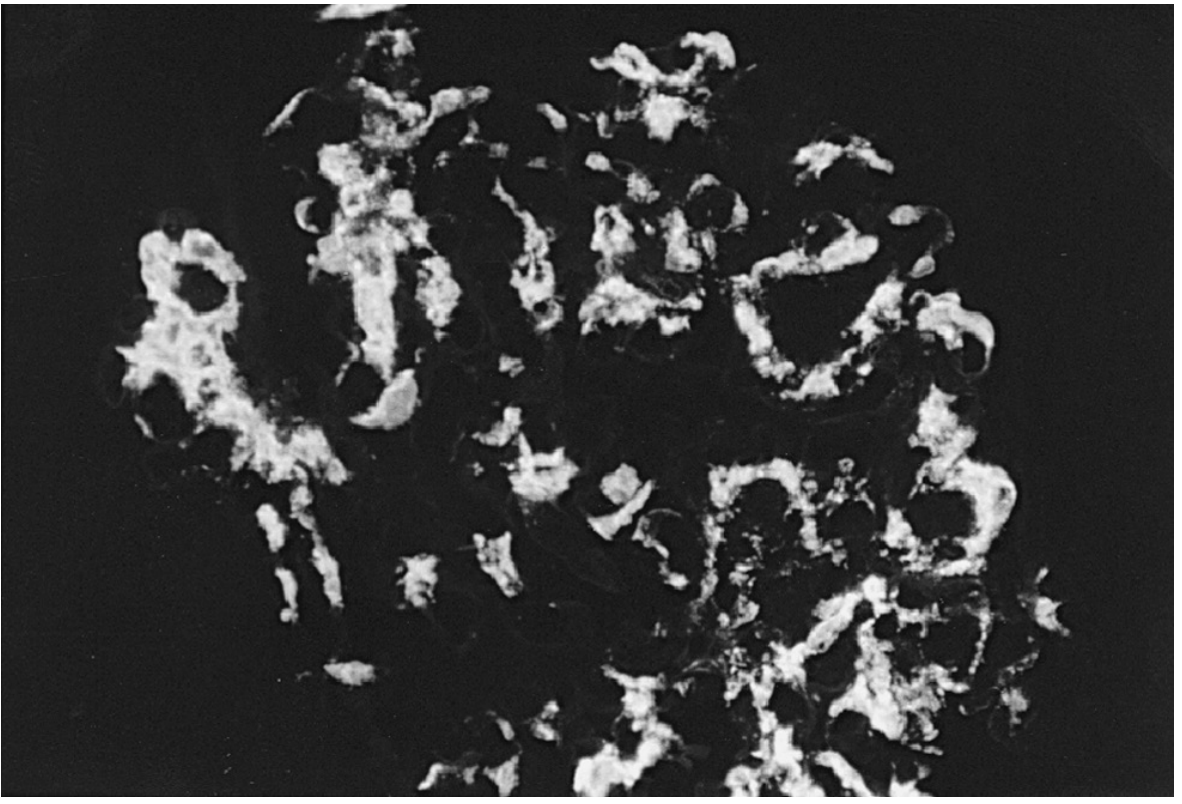
- Immunofluorescence shows IgA deposits in vessel walls - this is the KEY finding
- Also shows IgG, C3, properdin (but NOT C1q or C4)
- Mesangial proliferative glomerulonephritis
- Immunofluorescence: dominant IgA deposits in the mesangium
PART 3: The KEY Difference - HSP vs. IgA Nephropathy
| Feature | HSP (IgA Vasculitis) | IgA Nephropathy (Berger's Disease) |
|---|---|---|
| Age | Children (5-10 yr peak) | Young adults (15-35 yr) |
| Systemic involvement | YES - skin, joints, gut | NO - kidney ONLY |
| Palpable purpura | Always present | Absent |
| Abdominal pain / GI bleed | Common (25-90%) | Absent |
| Arthritis | Common (61% in adults) | Absent |
| Kidney findings | Hematuria ± proteinuria | Hematuria ± proteinuria (same!) |
| Kidney biopsy (LM) | Mesangial proliferation + crescents (often more severe) | Mesangial proliferation |
| Kidney biopsy (IF) | IgA dominant deposits | IgA dominant deposits (same!) |
| Serum complement | Normal | Normal |
| Serum IgA | Elevated in ~50% | Elevated in ~50% |
| Galactose-deficient IgA1 | Elevated | Elevated (same!) |
| Prognosis | Usually self-limited in children; adults worse | 25% reach ESKD over 20 years |
The Golden Rule for Differentiating Them:
On kidney biopsy alone, you CANNOT tell HSP from IgA nephropathy - they look IDENTICAL.The ONLY difference is clinical: HSP has systemic features (purpura + joint + gut). IgA nephropathy has NONE of these.
Quick Summary Table - What You Need to Diagnose HSP
DIAGNOSIS OF HSP =
Palpable purpura (mandatory)
+
At least ONE of:
✓ Abdominal pain / GI bleed
✓ Arthritis / arthralgia
✓ IgA deposits on biopsy (skin or kidney)
✓ Hematuria / proteinuria on urine test
+
Supporting labs:
✓ Normal platelets (rules out ITP)
✓ Normal complement (rules out SLE/MPGN)
✓ Negative ANA/ANCA (rules out SLE, ANCA vasculitis)
✓ Elevated serum IgA (in ~50%)
- Brenner & Rector's The Kidney; Firestein & Kelley's Textbook of Rheumatology; Comprehensive Clinical Nephrology 7e
(+) SPEP/UPEP → Supsect AL amyloidosis nephropathy Obtain Immunofixation and Fat pad biopsy to confirm , WHAT IS THE SPEP, UPEP?
SPEP and UPEP - What They Are and Why They Matter in AL Amyloidosis
The Abbreviations
| Abbreviation | Full Name | Sample Used |
|---|---|---|
| SPEP | Serum Protein Electrophoresis | Blood (serum) |
| UPEP | Urine Protein Electrophoresis | Urine (24-hr or spot) |
| SIFE | Serum Immunofixation Electrophoresis | Blood (more sensitive) |
| UIFE | Urine Immunofixation Electrophoresis | Urine (more sensitive) |
What is Electrophoresis? (The Principle)
Serum/Urine placed on gel
↓
Electric current applied
↓
Proteins migrate at different speeds
(based on size and charge)
↓
They separate into BANDS (zones)
↓
Stain and read the pattern
| Zone | Proteins Found |
|---|---|
| Albumin | Most abundant - large peak |
| Alpha-1 (α1) | Alpha-1 antitrypsin, AAT |
| Alpha-2 (α2) | Haptoglobin, alpha-2 macroglobulin |
| Beta (β) | Transferrin, complement |
| Gamma (γ) | Immunoglobulins (IgG, IgA, IgM, IgD, IgE) - broad diffuse band normally |
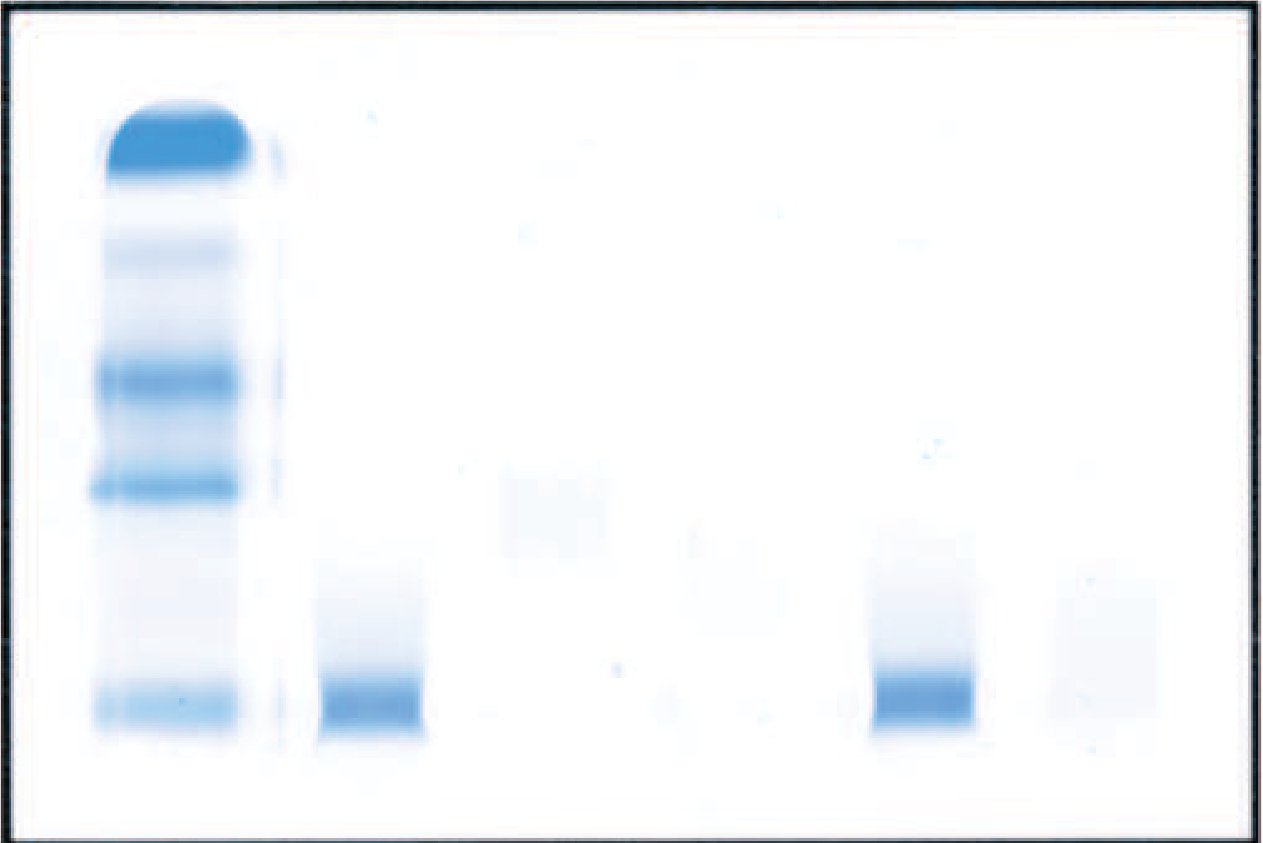
What Does POSITIVE SPEP/UPEP Mean? The "M-Spike"
NORMAL gamma zone: ___/‾‾‾\___ (broad, diffuse)
ABNORMAL - M-spike: ___/|\___ (tall, sharp, narrow spike)
↑
= M-protein / paraprotein
SPEP/UPEP in the Context of AL Amyloidosis
"SPEP and UPEP, although of value in multiple myeloma, are NOT useful screening tests if AL amyloidosis is suspected - because the clonal light chain is often not present in sufficient amounts to produce an M-spike."
- Harrison's Principles of Internal Medicine 22e, p. 941
So what DO you use?
| Test | Sensitivity | What it detects |
|---|---|---|
| SPEP | ~50-70% in AL amyloid | Only detects M-spike if protein load is HIGH enough |
| UPEP | Moderate | Detects Bence-Jones protein (free light chains in urine) |
| Immunofixation (SIFE/UIFE) | >90% | More sensitive - identifies WHICH heavy and light chain class is abnormal |
| Serum Free Light Chain (FLC) assay | ~95% | Most sensitive - directly measures free κ and λ chains; detects even tiny amounts |
More than 90% of AL amyloidosis patients have a monoclonal light chain detectable by immunofixation or serum free light chain assay - Harrison's 22e
The Full Diagnostic Pathway (Your Original Statement Explained)
Patient with Proteinuria / Nephrotic Syndrome
↓
Screen with SPEP + UPEP
↓
(+) M-spike found? → SUSPECT AL Amyloidosis
↓
CONFIRM with:
1. Immunofixation (SIFE + UIFE) → identify exact clone (IgG-λ? IgA-λ?)
2. Serum Free Light Chain assay → detect even trace amounts of free κ or λ
3. Bone marrow biopsy → % plasma cells (typically 5-30% in AL)
4. FAT PAD BIOPSY (abdominal subcutaneous fat) → Congo red stain
→ Apple green birefringence = AMYLOID CONFIRMED
5. Kidney biopsy → if needed for grading severity
What is the Fat Pad Biopsy?
- Stained with Congo red
- Under polarized light → apple green birefringence = AMYLOID PRESENT
- Then immunohistochemistry confirms the TYPE (AL vs AA) by staining for light chains (λ or κ) vs SAA protein
Summary - SPEP vs UPEP vs Immunofixation
| Test | What it shows | Role in AL Amyloid |
|---|---|---|
| SPEP | M-spike in serum | Initial screen - positive in ~50-70% |
| UPEP | Bence Jones protein (free light chains) in urine | Initial screen for urinary light chain excretion |
| Immunofixation (SIFE/UIFE) | Exact class of M-protein (IgG/IgA/IgM + κ/λ) | Confirms monoclonal protein - positive in >90% |
| Serum Free Light Chains | Free κ and λ ratio | Most sensitive; elevated κ:λ or λ:κ ratio confirms clonality |
| Fat pad biopsy + Congo red | Amyloid fibrils in tissue | Confirms amyloid deposition (the definitive step) |
Simple Memory Summary
SPEP and UPEP = "protein fingerprint tests" that find the abnormal M-spike (one clone's protein dominating). Positive = plasma cell disorder → suspect AL amyloidosis. But they can miss it in early/light disease → always follow up with immunofixation (more sensitive) and fat pad biopsy (confirms amyloid tissue deposition).
- Harrison's Principles of Internal Medicine 22e; Comprehensive Clinical Nephrology 7e; Goldman-Cecil Medicine
I am a medical student seeking a structured overview of large-vessel and medium-vessel vasculitis. Please provide: 1) Definitions and key distinctions between large-vessel vasculitis (e.g., giant cell arteritis, Takayasu arteritis) and medium-vessel vasculitis (e.g., polyarteritis nodosa, medium-vessel ANCA-associated vasculitides), including typical affected vessels and pathophysiology. 2) Diagnostic approach: diagnostic criteria, recommended labs, imaging modalities (e.g., ultrasound, MRI/MRA, CT angiography), biopsy considerations, and differential diagnosis. 3) Clinical presentation: hallmark symptoms, organ involvement, red flags, and differences across age groups. 4) Classification and timing: disease phases (quiescent vs active), scoring systems (e.g., appropriate disease activity indices if available), and when to escalate therapy. 5) Management overview: first-line treatments, induction vs maintenance therapy, tapering strategies, treatment-related adverse effects, and monitoring plans. 6) Special considerations: comorbidities, pregnancy considerations, and vaccination/osteoporosis prevention where relevant. 7) Key references and high-yield learning points for quick revision.
giant cell arteritis temporal artery biopsy histology granuloma giant cells
Takayasu arteritis aorta angiography stenosis large vessel vasculitis imaging
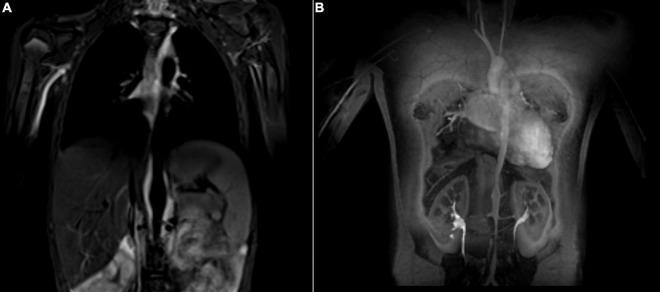
Diagnostic Image: Coronal Magnetic Resonance Imaging (MRI) and Magnetic Resonance Angiography (MRA) of the thorax and abdomen in a pediatric patient with Takayasu arteritis. Panel A displays a T2-weighted black blood sequence showing mural hypersignal along the abdominal aorta, indicative of active vessel wall inflammation and edema. Panel B presents a post-contrast MR angiogram showing the luminal morphology. Key findings include multifocal segmental narrowing (stenosis) of the mid-to-distal abdominal aorta and bilateral narrowing of the renal arteries. The aortic arch and proximal thoracic aorta appear relatively spared compared to the infra-diaphragmatic involvement. The image illustrates classic features of large-vessel vasculitis, highlighting the importance of using multi-sequence MRI to evaluate both vessel wall inflammation (wall thickening/edema) and luminal consequences (stenosis or occlusion). This case is representative of childhood-onset Takayasu arteritis affecting the abdominal aorta and its major branches.
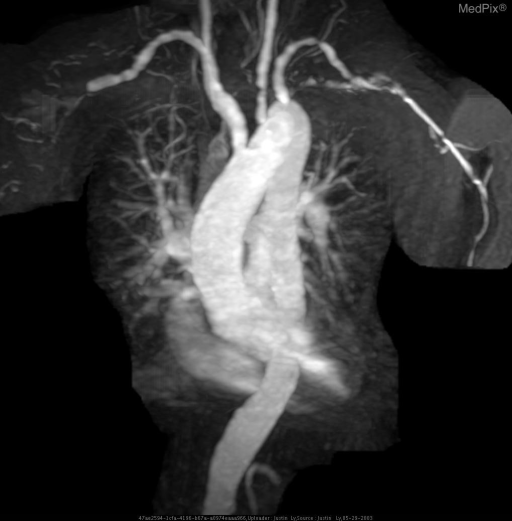
**Imaging Modality:** Contrast-enhanced Magnetic Resonance Angiography (MRA), Maximum Intensity Projection (MIP) reconstruction.
Large-Vessel & Medium-Vessel Vasculitis
A Structured Medical Student Overview
SECTION 1: DEFINITIONS & KEY DISTINCTIONS
The Chapel Hill Consensus Classification (2012)
| Category | Vessel Size | Key Diseases |
|---|---|---|
| Large-vessel vasculitis (LVV) | Aorta and its major branches | Giant Cell Arteritis (GCA), Takayasu Arteritis (TAK) |
| Medium-vessel vasculitis (MVV) | Main visceral arteries and their initial branches | Polyarteritis Nodosa (PAN), Kawasaki Disease |
| Small-vessel vasculitis | Arterioles, capillaries, venules | ANCA-associated, IgA vasculitis (HSP), etc. |
Note: ANCA-associated vasculitides (GPA, MPA, EGPA) are classified as small-vessel but frequently involve medium vessels - they are discussed briefly below.
Large-Vessel Vasculitis
Giant Cell Arteritis (GCA)
- Most common systemic vasculitis in adults (>50 years)
- Affects primarily the thoracic aorta and its branches, especially extracranial segments of the carotid (superficial temporal artery being the classic site)
- Granulomatous, transmural inflammation with multinucleated giant cells and destruction of the internal elastic lamina
- Spares intracranial arteries (which lack internal elastic lamina after penetrating the dura)
- Strongly associated with Polymyalgia Rheumatica (PMR) - 40-60% overlap
Takayasu Arteritis (TAK)
- Affects the aorta and its major branches (subclavian, carotid, renal, mesenteric)
- Classic disease of young women (peak age 10-30 years; female:male = 8:1)
- Highest prevalence in East Asia
- Histopathology nearly identical to GCA (granulomatous, giant cells, panarteritis)
- "Pulseless disease" or "occlusive thromboarteriopathy"
Medium-Vessel Vasculitis
Polyarteritis Nodosa (PAN)
- Necrotizing arteritis of medium-sized muscular arteries - visceral (renal, hepatic, mesenteric, coronary)
- Spares the lungs (key distinguishing feature)
- No glomerulonephritis (renal involvement = renal artery vasculitis, not glomerulonephritis)
- Strongly associated with Hepatitis B in ~20% of cases
- ANCA-negative - key distinction from ANCA-associated vasculitis
Pathophysiology Overview
| Disease | Immune Mechanism | Key Cells/Mediators |
|---|---|---|
| GCA | CD4+ T cell-driven (Th1 + Th17) activation of adventitial dendritic cells via TLR-2/4 → IFN-γ → macrophage recruitment → granuloma formation | Dendritic cells, CD4+ T cells, IL-6, IL-17, IFN-γ, PDGF |
| TAK | Similar to GCA; NK cells and γδ T cells additionally implicated; heat shock protein 65 may be an autoantigen | CD4+ T cells, NK cells, TGF-β, TNF-α |
| PAN | Immune complex deposition (especially HBsAg-HBsAb complexes in HBV-associated disease) → necrotizing inflammation | Immune complexes, neutrophil infiltration, fibrinoid necrosis |
- Firestein & Kelley's Textbook of Rheumatology
GCA Histopathology (from Temporal Artery Biopsy)
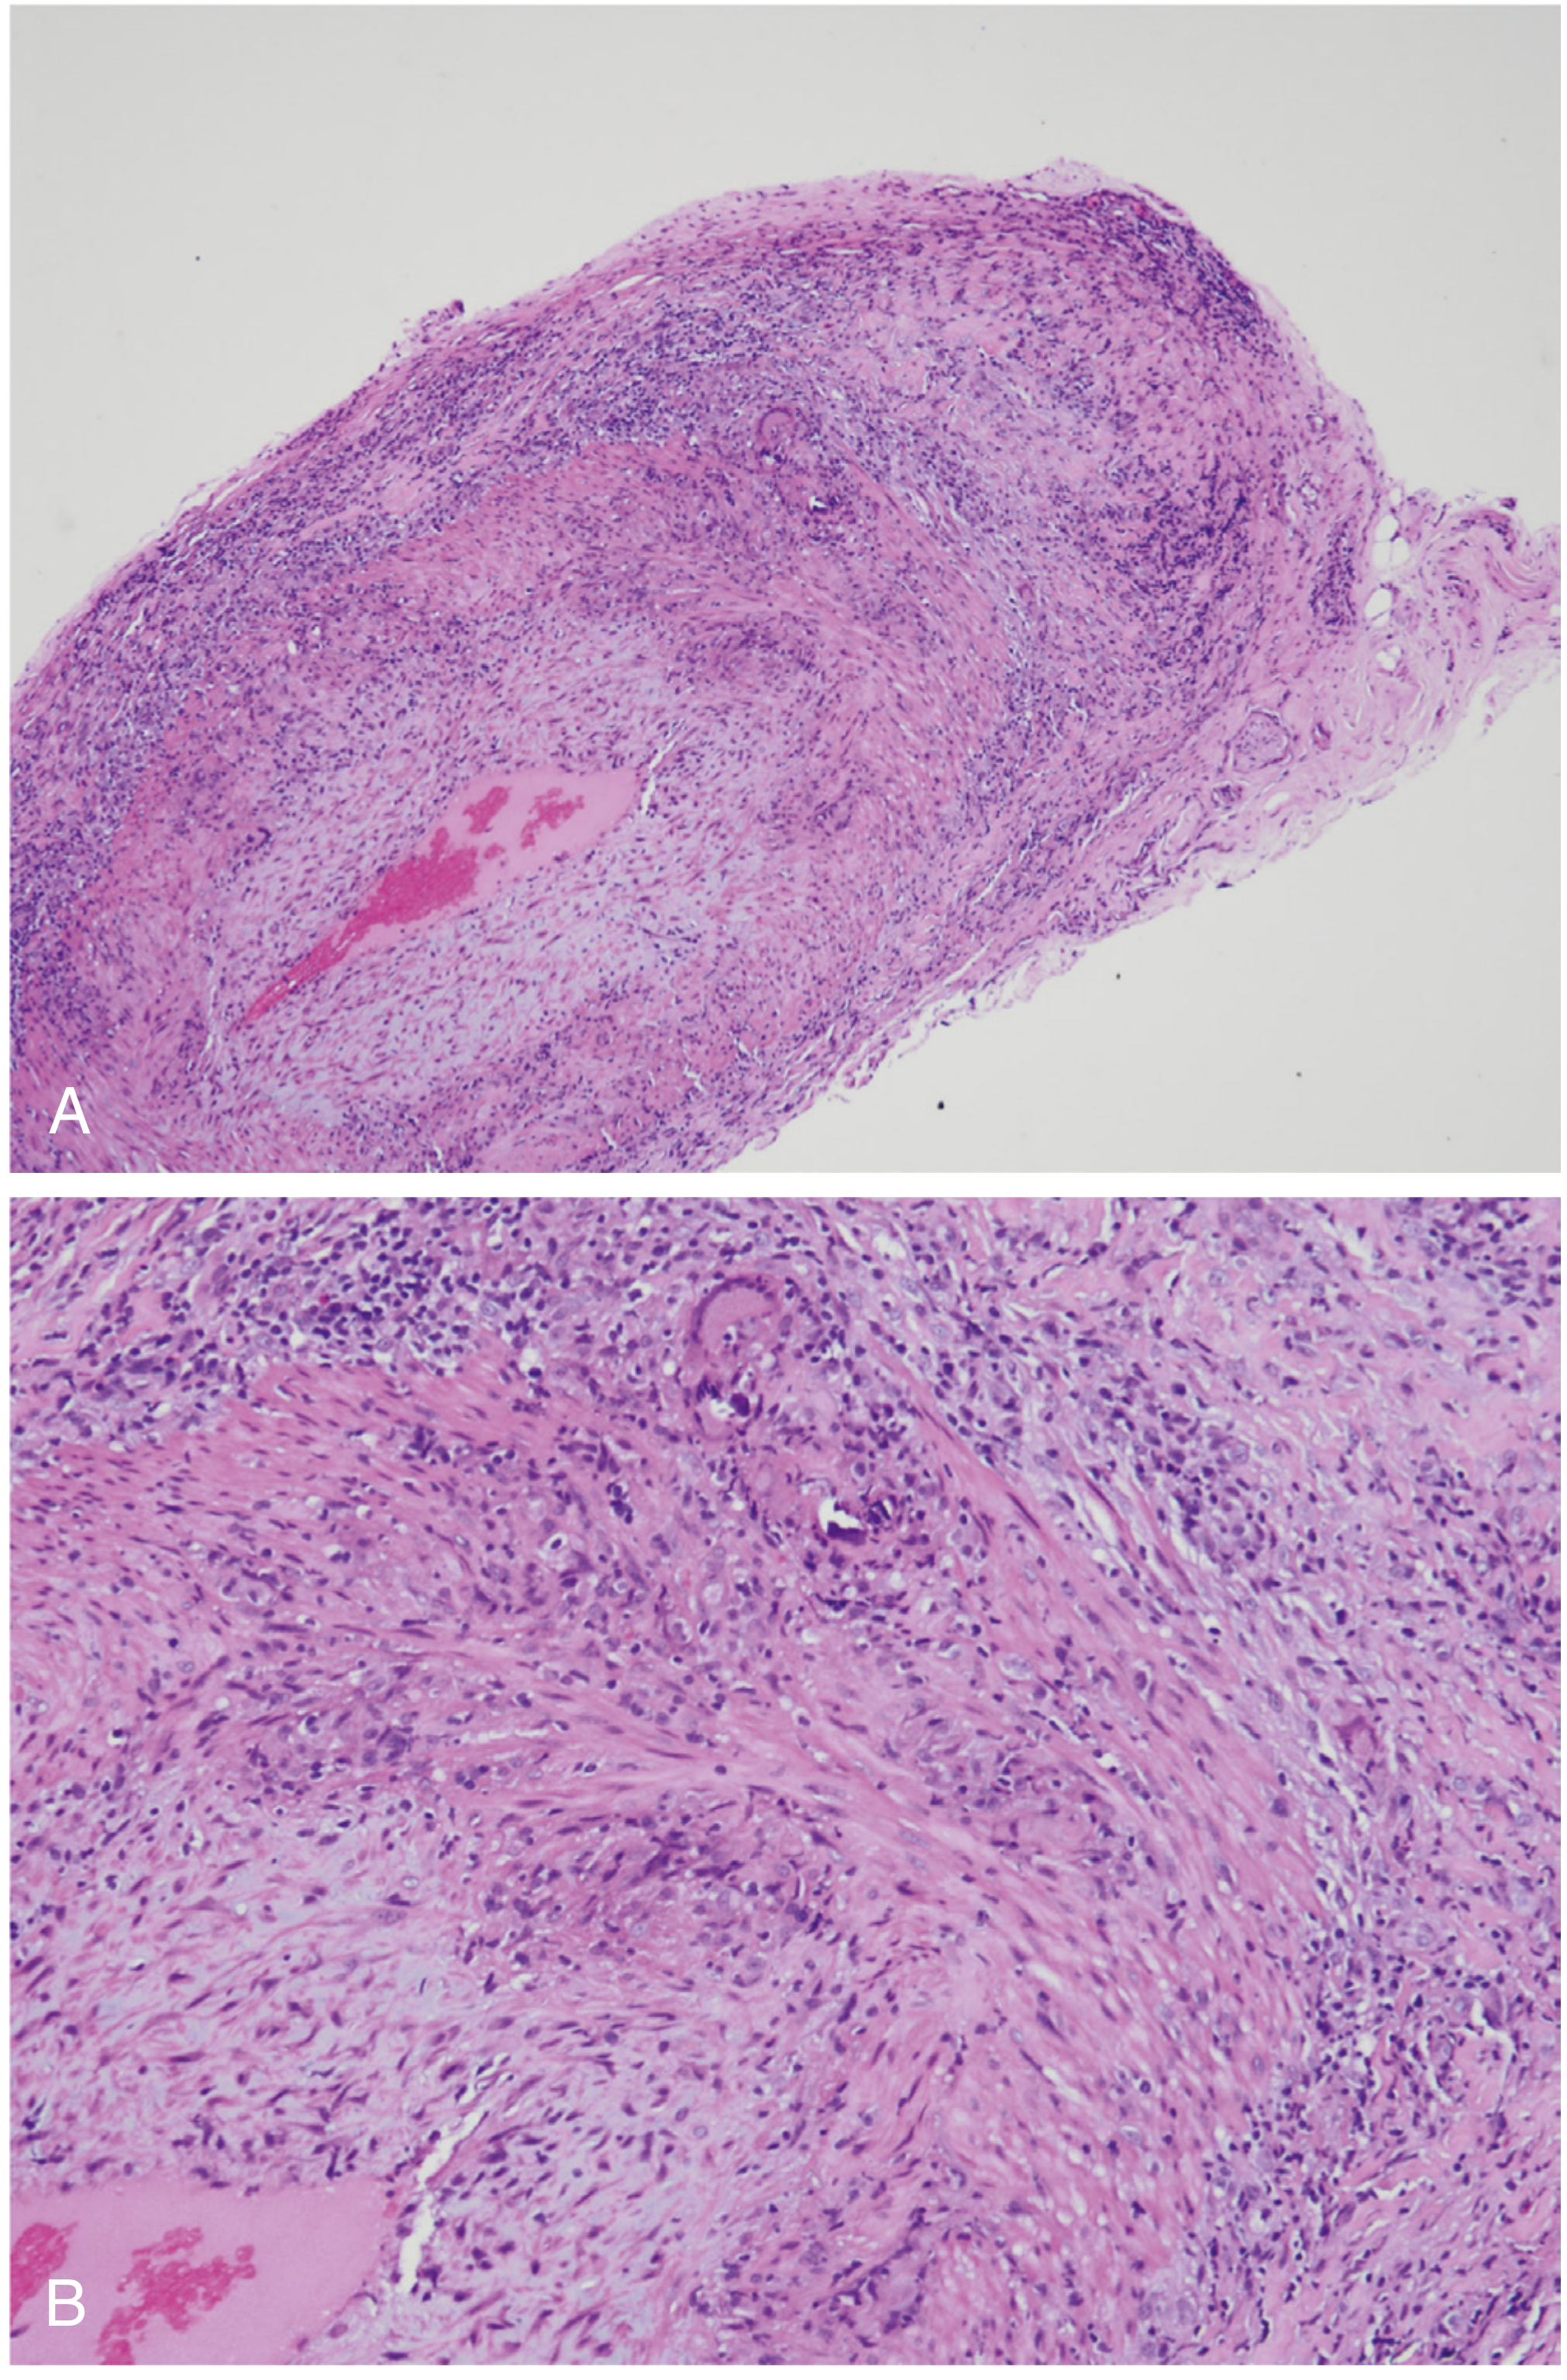
SECTION 2: DIAGNOSTIC APPROACH
Giant Cell Arteritis
ACR 1990 Classification Criteria (≥3 of 5 = sensitivity 93.5%, specificity 91.2%)
| Criterion | Definition |
|---|---|
| Age ≥50 at onset | Mandatory |
| New headache | New onset localized head pain |
| Temporal artery abnormality | Tenderness or decreased pulsation |
| ESR ≥50 mm/hr | By Westergren method |
| Abnormal artery biopsy | Vasculitis with mononuclear/granulomatous inflammation ± giant cells |
2022 ACR/EULAR Updated Criteria (Scoring System)
| Feature | Points |
|---|---|
| Morning stiffness in shoulders/neck | +2 |
| Sudden visual loss | +3 |
| Jaw or tongue claudication | +2 |
| New temporal headache | +2 |
| Scalp tenderness | +2 |
| Abnormal temporal artery exam | +2 |
| ESR ≥50 mm/hr OR CRP ≥10 mg/L | +3 |
| Positive TAB or halo sign on ultrasound | +5 |
| Bilateral axillary involvement | +2 |
| FDG-PET activity in aorta | +2 |
Labs
- ESR - elevated in >90% (often >100 mm/hr); most sensitive
- CRP - elevated; more specific for active disease than ESR
- Platelets - often elevated (reactive thrombocytosis)
- Hb - normocytic anemia of chronic disease
- LFTs - elevated ALP in 20-30%
- ANCA, ANA - negative
Imaging
| Modality | Role in GCA |
|---|---|
| Temporal artery ultrasound | "Halo sign" (dark hypoechoic rim around vessel) - specificity 78-100%; non-invasive first-line |
| MRI/MRA | Vessel wall enhancement; sensitivity 73-97%; useful for large-vessel involvement |
| CT angiography | 71% sensitive, 85.7% specific; rapid; good for aortic/large branch assessment |
| FDG-PET | Detects metabolically active vessel wall inflammation; useful for extracranial large-vessel disease |
| Conventional angiography | Rarely used; replaced by CTA/MRA |
Biopsy
- Temporal artery biopsy (TAB) = gold standard
- Minimum 2 cm segment required (skip lesions common)
- Biopsy can be negative in 10-20% (sampling error) - do NOT delay treatment waiting for biopsy
- Both sides may be biopsied if one side negative and suspicion remains high
Takayasu Arteritis
ACR 1990 Classification Criteria (≥3 of 6 = sensitivity/specificity >90%)
| Criterion |
|---|
| Age at onset <40 years |
| Limb claudication |
| Decreased brachial pulse(s) |
| BP difference >10 mmHg between arms |
| Bruit over subclavian or aorta |
| Arteriographic abnormalities (stenosis/occlusion/aneurysm not due to atherosclerosis) |
Angiographic Classification (Lupi-Herrera, modified)
| Type | Vessels Involved | Prevalence |
|---|---|---|
| Type I | Aortic arch + branches only | 8% |
| Type II | Descending thoracic + abdominal aorta | 11% |
| Type III | Aortic arch + descending + abdominal (most common) | 65% |
| Type IV | Pulmonary arteries + any of above | 15% |
Imaging
- CTA or MRA - preferred (avoids radiation of repeat conventional angiography)
- MRA preferred for monitoring (no radiation, shows vessel wall edema = active inflammation)
- FDG-PET - useful diagnostically; reliability as disease activity marker not fully established
- MRI shows T2 mural hypersignal = active wall inflammation:
Polyarteritis Nodosa
ACR 1990 Classification Criteria (≥3 of 10)
| Criterion |
|---|
| Weight loss ≥4 kg |
| Livedo reticularis |
| Testicular pain/tenderness |
| Myalgia, weakness, or leg tenderness |
| Mononeuropathy or polyneuropathy |
| Diastolic BP >90 mmHg |
| Elevated BUN or creatinine (not from glomerulonephritis) |
| Hepatitis B virus (surface antigen or antibody) |
| Arteriographic abnormality (microaneurysms/occlusions) |
| Biopsy: granulocytes ± monocytes in arterial wall |
Key Labs
- ANCA: NEGATIVE (distinguishes from ANCA-associated vasculitis)
- HBsAg, HBsAb - check for hepatitis B (20% of PAN)
- HCV serology - can cause similar picture
- ESR, CRP elevated
- Renal function (elevated if renal artery involved - not glomerulonephritis)
- Urinalysis - normal or minimal proteinuria; NO red cell casts (no GN)
Imaging
- CT angiography / conventional angiography - shows multiple microaneurysms and stenoses at bifurcations of renal, mesenteric, and hepatic arteries - pathognomonic
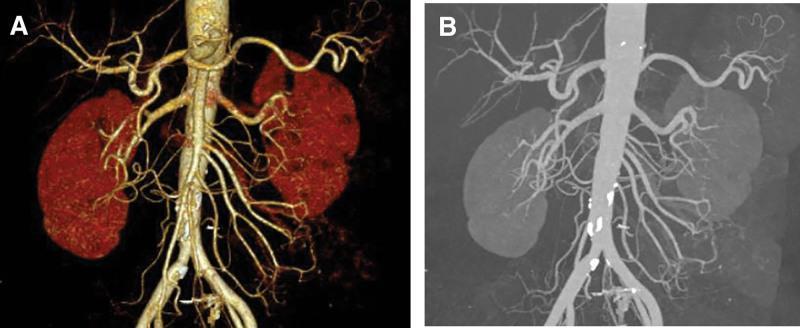
SECTION 3: CLINICAL PRESENTATION
Giant Cell Arteritis - Clinical Features
| System | Manifestation | Notes |
|---|---|---|
| Constitutional | Fever, fatigue, weight loss, malaise | Very common |
| Head/cranial | New-onset temporal headache (constant, severe, boring) | Most common symptom |
| Jaw | Jaw claudication (pain on chewing) - very specific | Pain from masseter ischemia |
| Vision | Amaurosis fugax → sudden, permanent visual loss | Most feared complication; from anterior ischemic optic neuropathy (AION) |
| Scalp | Scalp tenderness; palpable tender temporal artery | Classic |
| Girdle | PMR: bilateral shoulder + hip girdle morning stiffness | 40-60% have PMR |
| Tongue/lingual | Red, sore, or gangrenous tongue | Lingual artery involvement |
| Aortic | Aortic aneurysm (thoracic); limb claudication | Extracranial large-vessel GCA |
| Skin | Scalp necrosis; livedo reticularis; alopecia | Less common |
- Any visual symptoms (amaurosis fugax, diplopia, blurred vision) → START STEROIDS IMMEDIATELY
- Visual loss can be BILATERAL and PERMANENT within hours
Takayasu Arteritis - Two Phases
Phase 1 - "Pre-pulseless" / Inflammatory Phase
- Fever, malaise, fatigue, anorexia, weight loss
- Skin rash, myalgia, arthralgia
- Elevated ESR/CRP
- Lasts months to years; may be subtle → diagnosis often delayed
Phase 2 - "Pulseless" / Occlusive Phase
- Absent or asymmetric pulses (subclavian most common → absent radial pulse)
- BP difference >10 mmHg between arms
- Claudication (upper limb > lower limb)
- Bruit over subclavian, carotid, aorta
- Hypertension (renal artery stenosis → renovascular HTN)
- Neurologic: lightheadedness, syncope, vertigo, hemiparesis (carotid/vertebral involvement)
- Ocular: blurring, diplopia, "visual claudication," retinal vein/artery thrombosis
- Characteristic posture: "face-down" to avoid neck extension compressing carotid/vertebral flow
- Abdominal aorta: renovascular or intestinal ischemia
Polyarteritis Nodosa - Clinical Features
| System | Manifestation |
|---|---|
| Constitutional | Fever, weight loss, malaise |
| Renal | Hypertension (renal artery vasculitis); renal infarction; NO glomerulonephritis |
| Nervous | Mononeuritis multiplex (foot drop, wrist drop) - very characteristic |
| GI | Abdominal pain, GI bleeding, bowel infarction (mesenteric artery) |
| Skin | Livedo reticularis, palpable purpura, skin ulcers, nodules |
| Musculoskeletal | Myalgia, arthralgia |
| Cardiac | Coronary arteritis → MI, heart failure |
| Testicular | Testicular pain/tenderness (testicular artery) |
| Lungs | SPARED - this is a key feature |
SECTION 4: CLASSIFICATION & DISEASE PHASES
Disease Activity Assessment
GCA/PMR - Disease Activity
| Phase | Features |
|---|---|
| Active | Symptoms + elevated ESR/CRP; abnormal imaging |
| Remission | Symptom-free + normalized inflammatory markers |
| Relapse | Return of symptoms ± rising ESR/CRP during or after tapering |
- GCA relapse rate: ~40-50% during steroid taper
- PMR Disease Activity Score (PMR-AS) - quantifies activity; incorporates VAS pain, morning stiffness, ESR, CRP, physician global assessment
- ITAS (Indian Takayasu Activity Score) and BVAS (Birmingham Vasculitis Activity Score) used for TAK and other vasculitides
Takayasu - Kerr Criteria for Active Disease (any one of):
- New/worsening features of vascular ischemia/inflammation
- New angiographic lesions
- Elevated ESR
- Constitutional symptoms (fever, arthralgia, etc.)
When to Escalate Therapy
- Failure to achieve remission on standard steroids
- Repeated relapses during taper
- Development of major organ-threatening complications
- Intolerance of glucocorticoid side effects
SECTION 5: MANAGEMENT
Giant Cell Arteritis
Induction (Active Disease)
| Situation | Treatment |
|---|---|
| Without visual symptoms | Prednisone 40-60 mg/day orally |
| With visual symptoms / visual loss | IV methylprednisolone 500-1000 mg/day × 3 days → then oral prednisone 60 mg/day |
| First-line adjunct (now approved) | Tocilizumab (IL-6 receptor blocker) 162 mg SC weekly + prednisone |
Key Evidence - GiACTA Trial (Rheumatology, 2016)
- TCZ weekly + 26-week prednisone taper: 56% sustained remission at 52 weeks
- vs. placebo + prednisone taper: only 14-18% sustained remission
- Cumulative prednisone dose halved with TCZ - Rheumatology 2-Volume Set (Elsevier 2022)
Maintenance / Tapering
- Begin tapering after 1 month of symptom control
- Target prednisone 7.5-10 mg/day over 9-12 months
- Total duration: minimum 1-2 years (often 2+ years)
- Monitor ESR/CRP monthly during taper
- Methotrexate 7.5-15 mg/week - steroid-sparing agent; reduces total glucocorticoid dose and relapse rate
Refractory / Relapsing GCA
- Increase prednisone; add or intensify tocilizumab
- Abatacept (CTLA4-Ig) - showed better relapse-free survival in RCT
- Cyclophosphamide, azathioprine - used but data mixed
- Anti-TNF agents (infliximab, etanercept) - NOT reliably effective for GCA
Takayasu Arteritis
Induction
- Prednisone 1 mg/kg/day (max 60 mg/day)
- For refractory: add methotrexate, azathioprine, or mycophenolate mofetil
- Tocilizumab - small trials; evidence mixed; used for refractory cases
Surgical/Interventional Management
- Revascularization (angioplasty, stenting, bypass grafting) for critical stenoses
- Optimal timing: during quiescent phase - surgery during active disease has higher complication rates
- Pre-pregnancy intervention for renal artery involvement recommended before conception
Polyarteritis Nodosa
Non-HBV-Associated PAN
| Phase | Treatment |
|---|---|
| Induction | Prednisone 1 mg/kg/day ± cyclophosphamide (IV or oral) for severe/organ-threatening disease |
| Maintenance | Prednisone taper + azathioprine or methotrexate |
HBV-Associated PAN
- Antiviral therapy (entecavir or tenofovir) + short-course steroids (to control initial inflammation) ± plasma exchange
- Avoid prolonged immunosuppression in HBV-PAN (promotes viral replication)
Glucocorticoid Side Effect Monitoring
| System | Complication | Prevention/Monitoring |
|---|---|---|
| Bone | Osteoporosis, fractures | Calcium + Vitamin D from day 1; bisphosphonate if T-score < -1.5 |
| GI | Peptic ulcer | Proton pump inhibitor (PPI) |
| Glucose | Steroid-induced diabetes | Monitor fasting glucose/HbA1c |
| Eyes | Cataracts, glaucoma | Annual ophthalmology review |
| Infection | PCP pneumonia risk | Co-trimoxazole prophylaxis if on high-dose steroids ≥4 weeks |
| Adrenal | Adrenal suppression | Sick-day rules; slow taper |
| Cardiovascular | Hypertension, dyslipidemia | Monitor BP, lipids |
| Psychiatric | Mood changes, psychosis | Monitor; may need dose reduction |
SECTION 6: SPECIAL CONSIDERATIONS
Pregnancy
Takayasu Arteritis in Pregnancy
- Pregnancy does NOT increase disease activity relapse risk overall
- However, vascular damage causes complications: pre-eclampsia (45%), pre-term delivery (16%), IUGR (40% of neonates)
- Aortic valve disease or aortic/renal artery aneurysm = high risk for maternal mortality
- Renal artery angioplasty/bypass BEFORE pregnancy reduces adverse outcomes
- Monitor central aortic blood pressure during delivery; cautious use of epidural anesthesia
- Overall favorable neonatal outcome in 85% - Firestein & Kelley's Textbook of Rheumatology
GCA and Pregnancy
- Extremely rare in reproductive-age women (disease of elderly)
PAN and Pregnancy
- New-onset PAN mimics pre-eclampsia → diagnosis often delayed
- New onset most common in 3rd trimester or postpartum
- Manage with corticosteroids + immunosuppressives
- Better outcomes during established remission
Safe Medications in Pregnancy
- Prednisolone - generally safe (low placental transfer)
- Azathioprine - used when benefit outweighs risk (Category D)
- Methotrexate - CONTRAINDICATED (teratogenic, abortifacient)
- Cyclophosphamide - CONTRAINDICATED in 1st trimester
- Tocilizumab - avoid (insufficient safety data)
Vaccinations
| Vaccine | Recommendation |
|---|---|
| Pneumococcal (PCV20/PPSV23) | Before or at initiation of therapy |
| Influenza (inactivated) | Annual |
| COVID-19 | Recommended |
| Zoster (Shingrix - recombinant) | Recommended (especially with GCA given VZV link) |
| Live vaccines | Avoid on immunosuppressives (MMR, live Zoster, Yellow Fever) |
Osteoporosis Prevention
- Calcium 1000-1200 mg/day + Vitamin D 800-1000 IU/day
- Baseline DEXA scan → bisphosphonate (alendronate, risedronate, zoledronate) if T-score < -1.5 or -2.5 on high-dose steroids
- Monitor DEXA every 1-2 years
Comorbidities to Monitor
| Comorbidity | Relevant to |
|---|---|
| Aortic aneurysm | GCA (thoracic) and TAK - annual imaging surveillance |
| Cardiovascular disease | All - accelerated by chronic inflammation + steroids |
| Hypertension | TAK (renovascular), PAN - control rigorously |
| Cataracts / glaucoma | All on long-term steroids |
| Hepatitis B | PAN - screen all; HBV-PAN = different treatment |
SECTION 7: HIGH-YIELD REVISION TABLE + KEY REFERENCES
Quick Comparison - High-Yield Table
| Feature | GCA | TAK | PAN |
|---|---|---|---|
| Age | >50 yr | <40 yr | Any (peak 40-60) |
| Sex | F>M (2:1) | F>>M (8:1) | M>F (slight) |
| Vessels | Temporal, aortic arch | Aorta, subclavian, renal | Renal, mesenteric, coronary |
| Lungs | Spared | Spared | Spared |
| ANCA | Negative | Negative | Negative |
| Glomerulonephritis | No | No | No (renal artery vasculitis only) |
| HBV association | No | No | Yes (20%) |
| ESR | Very high (>100) | Elevated | Elevated |
| Biopsy site | Temporal artery | Aortic/large branches | Medium artery |
| Histology | Granulomatous, giant cells | Granulomatous, giant cells | Fibrinoid necrosis, no granuloma |
| Skip lesions | Yes | Yes | Yes |
| Imaging | Temporal US, TAB, FDG-PET | CTA, MRA, FDG-PET | Angiography (microaneurysms) |
| First-line treatment | Prednisone 60 mg + Tocilizumab | Prednisone 1 mg/kg | Prednisone ± Cyclophosphamide |
| Feared complication | Blindness (AION) | Aortic aneurysm, stroke | Bowel infarction, renal failure |
| PMR association | 40-60% | No | No |
Key Learning Points (High-Yield for Exams)
- GCA: Age >50, ESR >50, temporal headache + jaw claudication + visual symptoms = emergency → start high-dose steroids IMMEDIATELY - do NOT wait for biopsy
- Halo sign on temporal artery ultrasound = dark hypoechoic rim = vessel wall edema = active GCA
- Tocilizumab is now first-line approved in combination with prednisone for GCA (GiACTA trial)
- TAK = "Pulseless disease" in young women; BP difference >10 mmHg between arms is a diagnostic criterion
- PAN = ANCA-negative, HBV-associated, microaneurysms on angiography, lungs SPARED, NO GN
- Mononeuritis multiplex = classic neurological feature of PAN (foot drop, wrist drop from individual nerve ischemia)
- GCA biopsy: minimum 2 cm; skip lesions make shorter biopsies unreliable; treat BEFORE waiting for results
- MRA preferred over CTA for follow-up monitoring in TAK (no repeated radiation exposure)
- Steroid-sparing agents: Methotrexate for GCA/TAK; Azathioprine for PAN maintenance
- Osteoporosis prevention starts on Day 1 of steroid therapy (calcium + vitamin D ± bisphosphonate)
- Methotrexate is CONTRAINDICATED in pregnancy - use azathioprine if needed
- PMR-GCA overlap: PMR responds to low-dose prednisone (10-20 mg); GCA requires 40-60 mg; failing PMR doses = look for GCA
Key References
- Firestein & Kelley's Textbook of Rheumatology - Chapter 89 (GCA, PMR, TAK)
- Andrews' Diseases of the Skin - Chapter 35 (cutaneous vasculitis)
- Current Surgical Therapy 14e - Takayasu's Arteritis surgical management
- Rheumatology 2-Volume Set (Elsevier 2022) - Large-vessel vasculitis & tocilizumab evidence
- GiACTA Trial (Stone et al., NEJM 2017) - Tocilizumab for GCA
- ACR/EULAR 2022 Classification Criteria - Updated GCA scoring
- ACR 1990 Criteria - TAK classification (sensitivity/specificity >90% with ≥3 of 6)
You're preparing for an OSCE exam on abdominal X-ray interpretation and aiming to maximize your score. Please provide: 1) A concise, exam-ready checklist of key findings to assess on an abdominal X-ray (e.g., bowel gas patterns, free air under diaphragm, obstruction signs, constipation, stool burden, calcifications, organ outlines, lines/tubes, technique quality). 2) A step-by-step interpretation algorithm you can apply during the station (systematic approach, common pitfalls, time management). 3) A set of high-yield practice questions with model answers mirroring typical OSCE prompts (including abnormal vs normal examples and how you would document your findings succinctly). 4) Tips for common OSCE scoring criteria (communication, image acquisition notes, differential diagnoses, and concise reporting). 5) Quick-reference mnemonics and a printable one-page guide you can study before the exam. Assume standard upright abdominal radiographs; specify any assumptions if different in your curriculum.
abdominal X-ray small bowel obstruction dilated loops valvulae conniventes
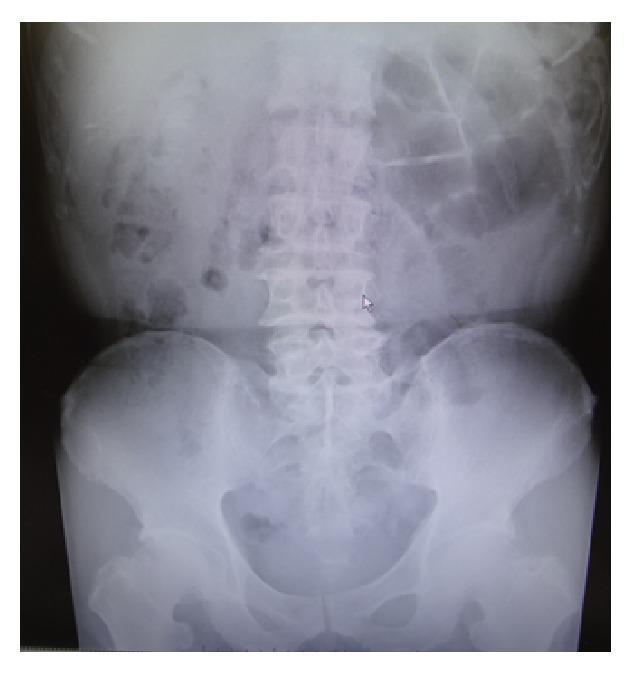
This diagnostic image is an upright abdominal radiograph (X-ray) of an adult patient. The primary finding is the presence of multiple dilated loops of small bowel, most prominently clustered in the upper-left and middle abdominal quadrants. Clear air-fluid levels are visible within these dilated segments, a characteristic sign of bowel obstruction. The valvulae conniventes are identifiable across the lumen of the dilated loops, supporting the classification as small bowel rather than large bowel. No obvious free air is seen under the diaphragm, suggesting the absence of gastrointestinal perforation. The lumbar spine and pelvic girdle are visible and serve as anatomical landmarks. This image illustrates key radiological features of a mechanical small bowel obstruction, which clinically in this case was secondary to an internal hernia through a mesenteric defect.
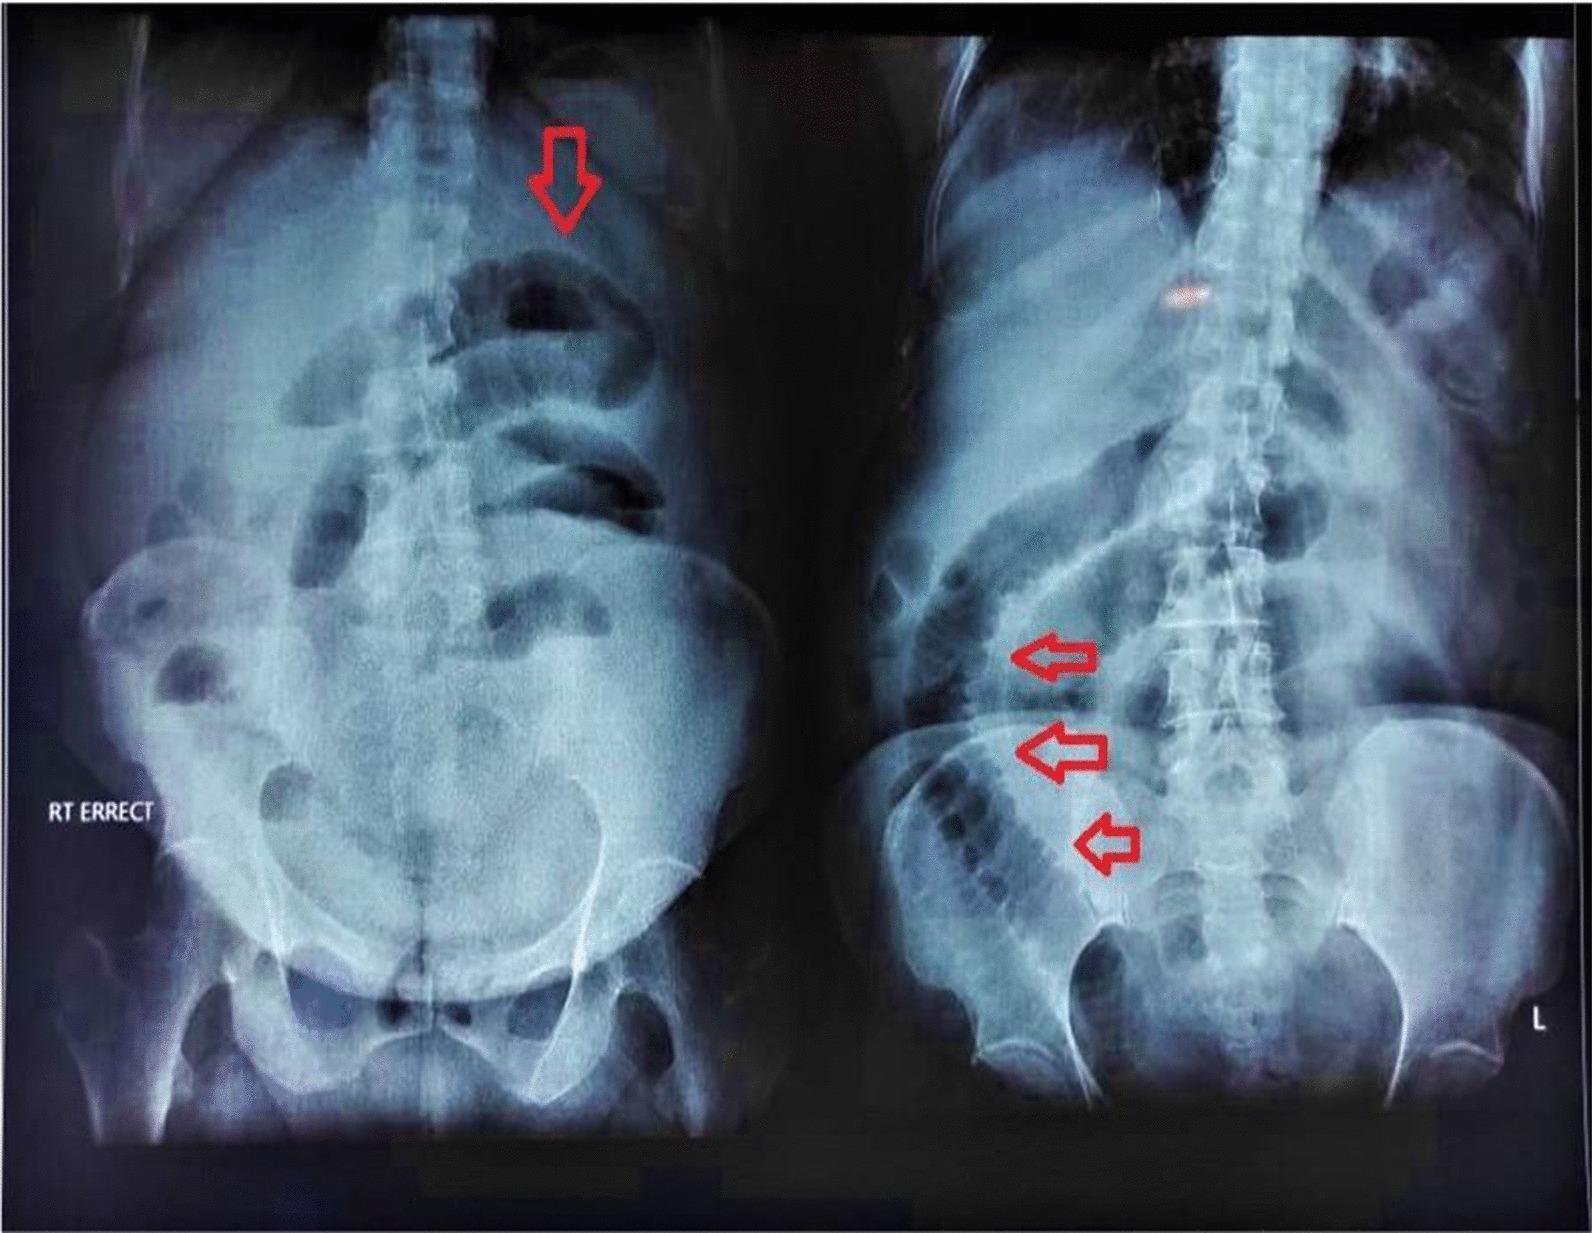
This diagnostic image consists of two views from an erect abdominal X-ray (AXR) demonstrating signs of small bowel obstruction. The radiograph displays multiple centrally located, dilated loops of small intestine. Key anatomical and pathological features are highlighted by red arrows: the jejunal loops are identifiable by the presence of valvulae conniventes (plicae circulares), which appear as thin, transverse radiopaque lines extending across the entire diameter of the bowel lumen. In contrast, the distal small bowel loops, representing the ileum, appear relatively 'featureless' with an absence of prominent mucosal folds. The presence of these dilated loops (exceeding the 3 cm rule) suggests a mechanical obstruction or adynamic ileus. The image serves as a clinical example for differentiating small bowel segments based on mucosal patterns and identifying radiographic markers of intestinal distension and subacute obstruction.
This diagnostic image is an upright plain film abdominal radiograph (X-ray) demonstrating signs of a small bowel obstruction. The radiograph shows multiple dilated loops of small bowel, primarily localized in the left upper and middle abdominal quadrants. Key diagnostic features include the presence of several distinct air-fluid levels within these dilated loops, indicated by white arrows. The valvulae conniventes (plicae circulares) are visible, confirming the loops are small intestine rather than large bowel. The distal bowel appears relatively gasless. Visible anatomical landmarks include the lumbar spine, the bony pelvis, and the bilateral hip joints. There is no clear evidence of pneumoperitoneum (free intraperitoneal air) under the diaphragm. This clinical presentation is highly suggestive of a mechanical bowel obstruction, which contextually was later identified as being secondary to an incarcerated obturator hernia.
large bowel obstruction distended colon haustra abdominal X-ray
normal abdominal X-ray bowel gas pattern liver spleen kidneys outlines
abdominal X-ray calcification renal stone urinary tract calculi
sigmoid volvulus coffee bean sign large bowel X-ray
This abdominal erect X-ray (radiography) demonstrates a classic 'Coffee Bean sign,' pathognomonic for sigmoid volvulus. The diagnostic hallmark is a massively dilated colonic loop originating from the pelvis and extending into the upper abdomen, occupying a large portion of the abdominal cavity. The 'coffee bean' appearance is created by the thick inner wall where the two loops of the obstructed bowel meet (the 'crease' of the bean) and the thinner, gas-distended outer walls. The loop shows a lack of haustral markings and a mottled internal texture consistent with a mix of air and fecal matter. Visible secondary features include elevation of the left hemidiaphragm due to increased intra-abdominal pressure and displacement of other abdominal structures. This image serves as a primary educational example for diagnosing large bowel obstruction caused by torsion of the sigmoid colon on its mesentery, often seen in clinical presentations of acute abdominal pain and distension.
This abdominal X-ray (supine anteroposterior projection) demonstrates significant pathology of the large bowel. The primary finding is a massively dilated loop of the sigmoid colon, presenting the classic 'coffee bean sign' (also known as the Frimann-Dahl sign). The dilated loop originates from the pelvis and extends into the upper abdominal quadrants, characterized by smooth, hairless walls and a thick central white line representing the opposed medial walls of the twisted sigmoid loop. The bowel gas pattern reveals a transition from the pelvic girdle toward the mid-abdomen, where the distended loop displaces other abdominal viscera. Anatomical landmarks including the lumbar spine, sacrum, and iliac crests are visible, although partly obscured by the overlying gaseous distension. This radiographic appearance is pathognomonic for sigmoid volvulus, a form of large bowel obstruction caused by torsion of the sigmoid colon around its mesenteric axis. The image serves as a key educational example for identifying acute abdominal emergencies and differentiating sigmoid from cecal volvulus based on bowel loop morphology and orientation.
Abdominal X-Ray (AXR) Interpretation - Complete OSCE Guide
SECTION 1: EXAM-READY CHECKLIST ("BSCORE-CTE")
| Letter | Category | What to Look For |
|---|---|---|
| B | Background / Technical quality | Patient name, DOB, date/time, L/R marker, projection (AP supine, erect, lateral decubitus), exposure, rotation, coverage (symphysis pubis to diaphragm) |
| S | Solid organs | Liver size/outline, spleen outline, kidneys (size ~3 vertebral bodies, smooth contour), psoas shadows, bladder |
| C | Calcifications | Gallstones (RUQ), renal/ureteric stones (along ureter line), AAA (eggshell calcification of aortic wall), pancreatic calcification, phleboliths (pelvis, oval with lucent centre) |
| O | Obstruction / Bowel gas pattern | Small bowel vs large bowel dilation; normal/abnormal gas distribution; air-fluid levels (erect); bowel wall thickening; absence of gas |
| R | Retroperitoneum / Bones | Spine (scoliosis, vertebral collapse, lytic/sclerotic lesions), ribs, pelvis (hip OA, fractures, Paget's disease, sacroiliac joints) |
| E | Extra-luminal gas / Emergencies | Free air under diaphragm (pneumoperitoneum), portal venous gas (liver), pneumatosis intestinalis (gas in bowel wall), Rigler's sign |
| C | Calcifications (missed) | Review again systematically after first pass - easy to miss renal stones overlying transverse processes |
| T | Tubes, lines, drains | NG tube position (should cross midline into stomach), urinary catheter, surgical drains, vascular lines, stents, clips, prostheses |
| E | Extras / Soft tissue | Abdominal wall masses, hernias (gas below inguinal ligament), subcutaneous emphysema, foreign bodies |
Bowel Size Normal Limits ("3-6-9 Rule")
| Bowel Segment | Normal Maximum Diameter |
|---|---|
| Small bowel | < 3 cm |
| Large bowel | < 6 cm |
| Caecum | < 9 cm (perforation risk above this) |
Differentiating Small vs Large Bowel Dilation
| Feature | Small Bowel | Large Bowel |
|---|---|---|
| Position | Central | Peripheral (picture frame) |
| Calibre (abnormal) | >3 cm (up to 5 cm) | >6 cm (caecum >9 cm = danger) |
| Mucosal folds | Valvulae conniventes - thin, cross entire diameter | Haustra - thick, only partially cross |
| Gas column | Multiple loops | Few, large loops |
| Solid content | Usually no faecal matter | Faecal shadow present |
| Number of loops | Many | Few |
- Grainger & Allison's Diagnostic Radiology
SECTION 2: STEP-BY-STEP INTERPRETATION ALGORITHM
The 5-Minute OSCE AXR Protocol
STEP 1 (30 sec): IDENTIFY & CONFIRM
├─ Read label: Patient name, DOB, date, projection
├─ Confirm adequate exposure (vertebral bodies just visible through bowel gas)
├─ Check rotation (spinous processes midline between pedicles)
└─ Check coverage (diaphragm to symphysis pubis)
STEP 2 (60 sec): EMERGENCY SCAN
├─ FREE AIR: Look under BOTH hemidiaphragms (right = liver, easier to see)
├─ MASSIVE DILATION: Is there a giant bowel loop? (volvulus?)
└─ PORTAL VEIN GAS: Branching lucencies reaching liver periphery?
STEP 3 (90 sec): BOWEL GAS PATTERN
├─ Count gas distribution (stomach, small bowel, large bowel, rectum)
├─ Measure any dilated loops
├─ Characterise folds (valvulae vs haustra)
├─ Look for air-fluid levels (upright = confirms obstruction)
├─ Check for absent distal gas (complete obstruction)
└─ "String of beads" sign? → fluid-filled SBO
STEP 4 (60 sec): SOLID ORGANS
├─ Liver: enlarged (>5 vertebral body widths), outline, hepatomegaly
├─ Spleen: enlarged (>tip of 9th rib), splenomegaly
├─ Kidneys: size (3 vertebral bodies each), smooth outline
├─ Psoas shadows: bilateral symmetric? Loss = retroperitoneal pathology
└─ Bladder: visible as soft tissue density in pelvis
STEP 5 (60 sec): CALCIFICATIONS
├─ RUQ/Gallbladder fossa → gallstones (10-15% radio-opaque)
├─ Renal tract (PUJ, ureter, VUJ) → urolithiasis
├─ Midline pelvic → phleboliths (round, lucent centre = benign)
├─ Paraaortic → AAA (eggshell calcification, >3 cm = aneurysm)
└─ Epigastrium → pancreatic calcification (chronic pancreatitis)
STEP 6 (30 sec): BONES & SOFT TISSUE
├─ Lumbar spine: scoliosis, disc spaces, vertebral bodies
├─ Pelvis/hips: fractures, OA, Paget's, lytic lesions
└─ Soft tissue: subcutaneous gas, masses, hernias
STEP 7 (30 sec): LINES & EXTRAS
├─ NG tube: should cross midline → left (stomach)
├─ Clips/stents/foreign bodies
└─ Pacemaker, vascular grafts
STEP 8 (15 sec): SYNTHESISE
└─ State main finding → differential diagnosis → immediate management
Common Pitfalls to Avoid
| Pitfall | How to Avoid |
|---|---|
| Missing free air (right-side easier) | Always look BOTH sides of diaphragm |
| Calling haustra "valvulae" (or vice versa) | Valvulae = full width, thin; Haustra = partial, thick |
| Confusing phleboliths with stones | Phleboliths: round, lucent centre, pelvis; Ureteric stones: follow ureter course |
| Missing a calcification behind vertebrae | Specifically look at each transverse process |
| Not noting absent rectal gas in obstruction | Absent sigmoid/rectal gas = complete LBO |
| Calling >3 cm small bowel "large bowel" | Position + fold type + clinical context |
| Missing NG tube in bronchus | ALWAYS trace NG tube below diaphragm and left of midline |
| Misidentifying sigmoid volvulus as paralytic ileus | "Coffee bean" pointing to RUQ = sigmoid; both volvulus and ileus have massive dilation but no haustra in volvulus |
SECTION 3: HIGH-YIELD OSCE PRACTICE QUESTIONS & MODEL ANSWERS
Q1 - NORMAL AXR
"This is an AP supine abdominal radiograph dated [date] of [patient]. Technical quality: adequate exposure with vertebral bodies visible; no rotation; coverage from diaphragm to symphysis pubis.Bowel gas pattern: Gas is present in the stomach, a normal distribution of small bowel loops that do not exceed 3 cm, and large bowel gas visible peripherally with no loop exceeding 6 cm. Haustral markings are present in the large bowel. No dilated loops. No air-fluid levels on this supine film.No free air under the diaphragm. No pneumatosis intestinalis. No portal venous gas.Solid organs: Liver outline visible in the right upper quadrant - appears normal in size. Both psoas shadows are visible and symmetric. Kidneys not clearly delineated.Calcifications: No radio-opaque calculi, no aortic calcification, no gallstones identified.Bones: Lumbar vertebrae appear normal. No obvious lytic or sclerotic lesions. No hip fracture.Impression: Normal abdominal radiograph. No acute pathology identified."
Q2 - SMALL BOWEL OBSTRUCTION
"This erect AP abdominal radiograph shows multiple centrally located dilated loops of small bowel measuring greater than 3 cm in diameter. Valvulae conniventes are visible crossing the full width of the bowel lumen, confirming this is small bowel. Multiple air-fluid levels are present on the erect film. The large bowel contains little or no gas. There is no free subdiaphragmatic air.Interpretation: These findings are consistent with mechanical small bowel obstruction. Given the history of previous appendicectomy, the most likely cause is adhesions.Immediate management: IV access and fluids, NG tube (drip and suck), urinary catheter, bloods including FBC/U&E/lactate/amylase/group and save, surgical review. CT abdomen/pelvis with contrast to confirm and identify transition point."
Q3 - LARGE BOWEL OBSTRUCTION
"This AXR demonstrates peripheral distension of the large bowel with loops exceeding 6 cm. Haustral folds are visible, partially crossing the bowel lumen - confirming this is large bowel. The large bowel follows a frame-like peripheral distribution. Gas is seen from the caecum to [level of obstruction]. There is absence of gas in the rectum/sigmoid suggesting a distal obstruction. Small bowel may also be distended if the ileocaecal valve is incompetent.Interpretation: Features consistent with large bowel obstruction, most likely carcinoma of the sigmoid/descending colon in this age group. Diverticulitis is the second most common cause.Caution: Check caecal diameter - if >9 cm, perforation is imminent and requires urgent surgical referral.Management: CT colonography or water-soluble contrast enema to identify the obstruction level; surgical referral."
Q4 - SIGMOID VOLVULUS
"This AXR demonstrates a massively dilated loop of bowel arising from the pelvis and extending into the upper abdomen, pointing towards the right upper quadrant. The loop shows an absent haustral pattern and a thick white central line representing the two opposed walls of the twisted loop - this is the classic 'coffee bean' sign (Frimann-Dahl sign).Interpretation: These findings are pathognomonic of sigmoid volvulus. The apex pointing to the right upper quadrant distinguishes this from caecal volvulus (which points to the left upper quadrant).Management: This is a surgical emergency. Urgent flexible sigmoidoscopy for decompression if no signs of ischaemia/perforation. Emergency surgical resection if peritonitis develops. If recurs, elective sigmoid resection advised."
Q5 - PNEUMOPERITONEUM (Free Air)
"This erect film demonstrates free air under the right hemidiaphragm visible as a radiolucent crescent between the superior liver border and the right hemidiaphragm. Free air may also be seen under the left hemidiaphragm.Interpretation: This is pneumoperitoneum - a surgical emergency. The differential for free air includes: perforated peptic ulcer (most common in this context), perforated diverticulitis, perforated appendix, perforated colon cancer, iatrogenic (recent procedure).Note: Free air is best seen on an erect CXR (preferred over AXR). The patient should be erect or in left lateral decubitus for at least 10 minutes before imaging to allow air to rise. On supine AXR, use Rigler's sign (both sides of bowel wall visible) or cupola sign (crescentic gas below central diaphragm).Immediate management: This requires emergency surgical review. IV access, fluids, NBM, bloods, broad-spectrum antibiotics, urgent CT abdomen to confirm and plan surgery."
Q6 - CALCIFICATIONS (Renal Calculi)
"There is a radio-opaque calcification overlying the left renal tract, in keeping with a ureteric calculus. The calcification lies along the expected course of the ureter from the left renal pelvis to the bladder (lateral borders of L2-L4 transverse processes, then tracking medially over the left sacroiliac joint to the vesico-ureteric junction).Differential for pelvic calcifications: Phleboliths (round, lucent centre, project lateral to the ureter) vs ureteric stone (follow ureteric course).Note: Approximately 90% of renal tract calculi are radio-opaque (calcium oxalate/phosphate); pure uric acid stones are radiolucent.Management: CT KUB (non-contrast) is the definitive investigation - more sensitive than AXR. Urological review, analgesia, hydration."
Q7 - PARALYTIC ILEUS
"This AXR shows generalised distension of both small and large bowel without a clear transition point. Gas is present throughout the small and large bowel including the rectum. No air-fluid levels are present on the erect film that would suggest mechanical obstruction with a definite transition point.Interpretation: This pattern is consistent with paralytic ileus - common post-operatively, in peritonitis, severe metabolic disturbance, renal failure, or opioid use.Key distinction from mechanical obstruction: In paralytic ileus, gas is distributed throughout ALL bowel segments including the rectum. In mechanical obstruction, gas is absent distal to the transition point.Management: Conservative - NBM, NG tube, correct electrolytes (especially hypokalaemia), mobilisation, reduce opioids, review medications."
SECTION 4: OSCE SCORING CRITERIA & COMMUNICATION TIPS
What Examiners Mark
| Domain | How to Score Maximum Marks |
|---|---|
| Systematic approach | State your approach out loud before starting: "I'll use a systematic approach: technical quality, bowel gas, solid organs, calcifications, bones and extras." |
| Technical assessment | ALWAYS comment on quality, projection, date, and patient ID first - even if the image is clearly abnormal |
| Identification of key finding | Name the finding clearly: "There is free air under the right hemidiaphragm" - not "it looks abnormal" |
| Correct differential | Give 2-3 differentials for the main finding, ranked by likelihood |
| Clinical correlation | Relate findings to the clinical scenario given |
| Appropriate management | State immediate next steps: investigations + treatment |
| Communication | Speak clearly, avoid jargon, summarise at end ("In summary, this AXR shows...") |
Image Acquisition Notes (Technical Quality Checklist)
- Patient identification - name, DOB, date visible on the film
- Projection - AP supine (most common); erect AXR or erect CXR if free air suspected
- Exposure - vertebral bodies should be just visible through bowel gas; over-exposed = too dark; under-exposed = too white
- Coverage - from diaphragm (T10-T12) to symphysis pubis; both flanks included
Differential Diagnosis Framework by Finding
| Finding | Top Differentials |
|---|---|
| Free subdiaphragmatic air | Perforated peptic ulcer, perforated diverticulitis, perforated appendix, post-procedure, perforated colon cancer |
| Central small bowel dilation | Adhesions (most common in developed world), hernia, Crohn's stricture, gallstone ileus, intussusception, malignancy |
| Peripheral large bowel dilation | Carcinoma sigmoid colon (most common), diverticulitis, volvulus, pseudo-obstruction |
| "Coffee bean" sign | Sigmoid volvulus (→RUQ) vs Caecal volvulus (→LUQ) |
| Gasless abdomen | Complete obstruction with fluid-filled loops, severe peritonitis, early obstruction |
| Portal venous gas | Mesenteric ischaemia, severe infection, post-procedure (benign iatrogenic) |
| Calcifications RUQ | Gallstones (10-15% visible), porcelain gallbladder, calcified LN |
| Calcifications renal tract | Renal calculi, nephrocalcinosis, TB |
| Paraaortic calcification | AAA, aortic atherosclerosis |
| Pancreatic calcification | Chronic pancreatitis (often alcoholic) |
SECTION 5: MNEMONICS & ONE-PAGE QUICK REFERENCE GUIDE
Core Mnemonics
- Small bowel: 3 cm
- Large bowel: 6 cm
- Caecum: 9 cm (→ perforation risk)
- Valvulae conniventes = small bowel (span full Vidth)
- Across the full diameter (small bowel)
- Central position (small bowel)
- Haustra = large bowel (only Half crossing)
- Phleboliths (pelvic, benign)
- Aorta (AAA - paraaortic eggshell)
- Stones (renal, ureter, VUJ)
- Spleen (old infarcts)
- Fibroids (uterine, pelvic)
- Liver (old amoebic abscess, hydatid)
- Yellow (Gallbladder - gallstones, porcelain GB)
- Surgery (recent laparotomy/laparoscopy - up to 7 days)
- Abdominal hollow viscus perforation (ulcer, bowel)
- Fistula (entero-enteric)
- Endoscopy (recent colonoscopy/gastroscopy)
- Surgical adhesions (most common in developed world - 60-70%)
- Hernia (strangulated inguinal/femoral - most common in underdeveloped world)
- Intussusception / Inflammatory (Crohn's)
- Plug/Phytobezoar / Primary tumour / Previous radiation
- Diverticulitis
- Adharences (rare in large bowel)
- Volvulus (sigmoid > caecal)
- Inflammatory (IBD stricture)
- Disease - colonic carcinoma (most common!)
ONE-PAGE QUICK REFERENCE CARD
╔══════════════════════════════════════════════════════════════╗
║ AXR INTERPRETATION - OSCE QUICK GUIDE ║
╠══════════════════════════════════════════════════════════════╣
║ SYSTEMATIC APPROACH: BSCORE-CTE ║
║ Background (technical) → Solid organs → Calcifications → ║
║ Obstruction/gas → Retroperitoneum/bones → Extra-lum gas → ║
║ Calcifications (recheck) → Tubes/lines → Extras ║
╠══════════════════════════════════════════════════════════════╣
║ BOWEL SIZE: 3-6-9 RULE ║
║ Small bowel < 3cm | Large bowel < 6cm | Caecum < 9cm ║
╠══════════════════════════════════════════════════════════════╣
║ SMALL BOWEL LARGE BOWEL ║
║ Central position Peripheral (frame) ║
║ Valvulae (full width) Haustra (partial) ║
║ <3cm normal / >3cm dilated <6cm normal / >6cm dilated ║
║ Many loops Few, large loops ║
╠══════════════════════════════════════════════════════════════╣
║ KEY EMERGENCIES ║
║ Free air → Pneumoperitoneum → ERECT CXR → emergency surgery║
║ Coffee bean sign → Sigmoid volvulus → flex sigmoidoscopy ║
║ Caecum >9cm → impending perforation → URGENT surgery ║
║ Portal venous gas → mesenteric ischaemia → emergency CT ║
╠══════════════════════════════════════════════════════════════╣
║ CALCIFICATIONS ║
║ RUQ = Gallstones (10-15% opaque) or porcelain GB ║
║ Renal tract = Urolithiasis (90% opaque) or TB ║
║ Paraaortic = AAA (eggshell), atherosclerosis ║
║ Epigastrium = Chronic pancreatitis ║
║ Pelvis = Phleboliths (round, lucent centre = BENIGN) ║
╠══════════════════════════════════════════════════════════════╣
║ DIFFERENTIATING OBSTRUCTION vs ILEUS ║
║ Obstruction: dilated loops + NO gas distal to transition ║
║ Ileus: gas throughout ALL bowel including rectum ║
╠══════════════════════════════════════════════════════════════╣
║ COMMON OSCE DIAGNOSES ║
║ SBO: central dilated loops, VCs, air-fluid levels ║
║ LBO: peripheral loops, haustra, absent rectal gas ║
║ Sigmoid volvulus: coffee bean → RUQ ║
║ Caecal volvulus: bean → LUQ ║
║ Pneumoperitoneum: crescentic air under diaphragm ║
║ Ileus: diffuse gaseous distension, gas in rectum ║
╠══════════════════════════════════════════════════════════════╣
║ FINAL STATEMENT TEMPLATE (speak this aloud): ║
║ "This is [projection] dated [date] for [patient]. ║
║ Quality is [adequate/inadequate] because... ║
║ The key finding is [X] which is in keeping with [Y]. ║
║ Differentials include [A, B, C]. ║
║ I would [immediately / urgently] [management]." ║
╚══════════════════════════════════════════════════════════════╝
Radiology Images for Reference
Key Points for Maximum OSCE Score
- Always start with technical quality - examiners deduct marks if you skip straight to pathology
- State your systematic approach out loud before you start - signals to examiners that you are safe
- Quote exact measurements when describing bowel calibre: "loops measuring approximately 5 cm" is better than "dilated"
- Distinguish fold pattern (valvulae vs haustra) verbally - this is often a direct OSCE mark point
- Use "in keeping with" rather than "confirms" on imaging alone: "findings are in keeping with SBO"
- Name 2-3 differentials and rank by likelihood - "most likely adhesions given prior surgery"
- Always state the emergency management - "I would urgently request surgical review" or "this is a surgical emergency"
- On free air - mention that erect CXR is more sensitive than erect AXR for pneumoperitoneum
- On the caecum - always measure it if the large bowel looks distended - >9 cm is a direct clinical trigger
- End with a summary sentence every time - "In summary, this AXR demonstrates a mechanical SBO, most likely secondary to adhesions, requiring urgent surgical review and CT abdomen"
You're preparing for an OSCE and need a clear, exam-focused guide to calculating Early Warning Scores (EWS). Please provide: 1) A concise explanation of what EWS is, its purpose, and common scoring systems (e.g., NEWS/NEWS2), in plain language suitable for medical students. 2) Step-by-step calculation method with a concrete example using typical vital signs (HR, BP, RR, temperature, O2 saturation, level of consciousness). Show how to compute the total score and interpret it. 3) Clinical implications: what each score range means for patient escalation, monitoring frequency, and potential actions. 4) OSCE-specific tips: common scenarios, how to describe your reasoning aloud during station, and typical examiner prompts. 5/senario to be more confident
NEWS2 National Early Warning Score 2 scoring table parameters OSCE calculation 2024
https://blog.mentormerlin.com/nmc-osce-news2-chart
Early Warning Score (EWS) - Complete OSCE Guide
SECTION 1: WHAT IS EWS? (The Plain-Language Foundation)
The Core Concept
Why It Exists
- Patients rarely crash suddenly - they deteriorate gradually over hours, with measurable changes in vital signs
- Studies show that clinical deterioration is missed or acted on too late in up to 60% of in-hospital cardiac arrests
- EWS standardises the recognition and escalation process so a healthcare assistant, nurse, or junior doctor triggers the same response to the same set of findings
Common Systems
| System | Full Name | Used Where |
|---|---|---|
| NEWS2 | National Early Warning Score 2 | UK NHS standard (2017 - current) |
| NEWS | National Early Warning Score | UK (original 2012 version, now superseded) |
| MEWS | Modified Early Warning Score | Some trusts, older hospitals |
| PEWS | Paediatric EWS | Children - NOT NEWS2 |
| AVPU / GCS | Consciousness component | Component within EWS |
OSCE assumption: Unless told otherwise, use NEWS2 - it is the standard tested in UK medical and nursing OSCEs. NEWS2 was updated from NEWS in 2017 to better identify patients with hypercapnic respiratory failure (COPD) and to incorporate new-onset confusion.
SECTION 2: THE NEWS2 SCORING TABLE
The Six Parameters (+ Supplemental O2)
Complete NEWS2 Scoring Table
| Parameter | Score 3 | Score 2 | Score 1 | Score 0 | Score 1 | Score 2 | Score 3 |
|---|---|---|---|---|---|---|---|
| Respiration Rate (breaths/min) | ≤8 | - | 9-11 | 12-20 | - | 21-24 | ≥25 |
| SpO2 - Scale 1 (no COPD) | ≤91% | 92-93% | 94-95% | ≥96% | - | - | - |
| SpO2 - Scale 2 (COPD/hypercapnic; target 88-92%) | ≤83% | 84-85% | 86-87% | 88-92% | 93-94% | 95-96% | ≥97% |
| Supplemental O2 | - | +2 if on any O2 | - | Air | - | - | - |
| Systolic BP (mmHg) | ≤90 | 91-100 | 101-110 | 111-219 | - | - | ≥220 |
| Heart Rate (bpm) | ≤40 | - | 41-50 | 51-90 | 91-110 | 111-130 | ≥131 |
| Level of Consciousness (ACVPU) | - | - | - | A (Alert) | - | - | C/V/P/U (new confusion, voice, pain, unresponsive) = 3 |
| Temperature (°C) | ≤35.0 | - | 35.1-36.0 | 36.1-38.0 | 38.1-39.0 | ≥39.1 | - |
The ACVPU Scale (Consciousness)
| Score | Letter | Meaning |
|---|---|---|
| 0 | A | Alert - fully awake and orientated |
| 3 | C | New Confusion / delirium (new onset) |
| 3 | V | Responds to Voice only |
| 3 | P | Responds to Pain only |
| 3 | U | Unresponsive |
Key point: Any response other than Alert scores 3 - there is no "1" or "2" for consciousness in NEWS2. New confusion (C) was added in NEWS2 specifically because it is an early and sensitive marker of deterioration (including sepsis).
The Two SpO2 Scales - Critical Distinction
| Scale | Who Gets It | Why |
|---|---|---|
| Scale 1 | All patients EXCEPT those with confirmed hypercapnic respiratory failure | Normal target SpO2 ≥96%; being on O2 to push above 96% = abnormal |
| Scale 2 | Patients with confirmed hypercapnic (Type 2) respiratory failure (e.g., COPD) + prescribed target range 88-92% | These patients RETAIN CO2 - high O2 can blunt their respiratory drive; 88-92% is their NORMAL target |
OSCE tip: If the scenario says "known COPD on target sats 88-92%" → use Scale 2. If no such instruction → use Scale 1. You MUST state which scale you are using.
SECTION 3: STEP-BY-STEP CALCULATION (WITH WORKED EXAMPLES)
The 4-Step Method
STEP 1: Obtain all six vital signs
STEP 2: Compare each against the scoring table → assign 0/1/2/3
STEP 3: Add 2 if the patient is on supplemental oxygen
STEP 4: Add all scores → TOTAL NEWS2 score → look up clinical response
EXAMPLE A: Moderately Unwell Patient
| Parameter | Value | Table Look-up | Score |
|---|---|---|---|
| Respiratory Rate | 22 breaths/min | Range 21-24 → right side | 1 |
| SpO2 (Scale 1) | 94% | Range 94-95% | 1 |
| Supplemental O2 | Room air | Not on O2 | 0 |
| Systolic BP | 108 mmHg | Range 101-110 | 1 |
| Heart Rate | 102 bpm | Range 91-110 | 1 |
| Consciousness | Alert | A = 0 | 0 |
| Temperature | 38.5°C | Range 38.1-39.0 | 1 |
EXAMPLE B: Critically Ill Patient (Sepsis)
| Parameter | Value | Table Look-up | Score |
|---|---|---|---|
| Respiratory Rate | 28 breaths/min | ≥25 → | 3 |
| SpO2 (Scale 1) | 89% | ≤91% → | 3 |
| Supplemental O2 | 4L via nasal cannula | On supplemental O2 | +2 |
| Systolic BP | 88 mmHg | Range 91-100 = 2; ≤90 = 3 → 88 = ≤90 | 3 |
| Heart Rate | 118 bpm | Range 111-130 | 2 |
| Consciousness | New confusion | C = 3 | 3 |
| Temperature | 39.2°C | ≥39.1 | 2 |
EXAMPLE C: Low-Risk Patient
| Parameter | Value | Score |
|---|---|---|
| RR | 16 | 0 |
| SpO2 | 97% on air | 0 |
| Supplemental O2 | None | 0 |
| Systolic BP | 126 mmHg | 0 |
| HR | 78 bpm | 0 |
| Consciousness | Alert | 0 |
| Temperature | 37.2°C | 0 |
SECTION 4: CLINICAL IMPLICATIONS - ESCALATION FRAMEWORK
The NEWS2 Traffic Light System (RCP / NICE)
| Score | Risk Level | Colour | Monitoring Frequency | Clinical Response Required |
|---|---|---|---|---|
| 0 | None | - | Minimum 12-hourly | Continue routine monitoring |
| 1-4 | Low | Green | Minimum 4-6 hourly | Prompt assessment by ward nurse; consider need for change in care |
| 3 in any single parameter | Low-Medium | Amber | Minimum 1 hourly | Urgent review by ward-based doctor - identify cause, consider escalation |
| 5-6 | Medium | Amber | Minimum 1 hourly | Urgent review by ward doctor or acute team nurse - consider escalation to critical care team |
| ≥7 | High | Red | Continuous monitoring | Emergency assessment by critical care team (outreach/ICU); usually transfer to higher-dependency area |
- NICE MIB205; RCP NEWS2 Report 2017
The "Score 3 Anywhere" Rule - THE Most Important Rule for OSCE
ANY single parameter scoring 3 = mandatory urgent escalation, regardless of total score.
What to DO at Each Level
Score 0 (No risk)
- Continue routine monitoring
- Document and handover normally
Score 1-4 (Low risk - Green)
- Nurse-in-charge aware
- Increase observation frequency to 4-6 hourly
- Review precipitants (pain, dehydration, anxiety)
- Consider informing medical team if concerned or trending upward
Single Score 3 OR Total 5-6 (Medium risk - Amber)
- Immediately inform the ward doctor / SHO
- Increase monitoring to hourly
- Prepare for clinical review: have obs chart, medication list, current diagnosis ready
- Consider ABG, ECG, bloods (FBC, U&E, CRP, cultures, lactate)
- Think: Is this sepsis? Is there respiratory failure? Does patient need HDU?
Score ≥7 (High risk - Red)
- Emergency escalation - call MET/Crash team/Critical Care Outreach now
- Continuous monitoring
- IV access (x2 large bore), bloods including lactate, blood cultures, ABG
- Initiate Sepsis 6 bundle if infection suspected
- Prepare for possible ICU transfer
- Inform consultant / registrar
- SBAR handover to receiving team
The SBAR Tool (Use This When Escalating)
| Letter | Stands for | What to Say |
|---|---|---|
| S | Situation | "I'm calling about Mr. Smith in Bay 3, I'm concerned he is deteriorating" |
| B | Background | "He's 72, post-op day 2 bowel resection, known hypertensive" |
| A | Assessment | "His NEWS2 is 18. He has new confusion, is hypotensive at 88 systolic, SpO2 89% on 4L O2, RR 28, temp 39.2" |
| R | Recommendation | "I need you to come immediately - I believe this is sepsis and he needs emergency review" |
SECTION 5: OSCE-SPECIFIC TIPS, SCENARIOS & CONFIDENCE BUILDING
What Examiners Are Marking
| Domain | What They Look For |
|---|---|
| Safety | Do you recognise the emergency? Do you escalate correctly? |
| Accuracy | Can you correctly score each parameter? |
| Reasoning | Can you explain WHY each score is what it is? |
| Communication | SBAR-style escalation; clear, calm language |
| Holistic view | Do you note the trend (getting better/worse)? Do you consider clinical context? |
How to Describe Your Reasoning Aloud (Examiner Loves This)
"I am now assessing Mr. Ahmed's NEWS2. His respiratory rate is 24 breaths per minute - this falls in the 21-24 range, which scores 1. His SpO2 is 94% on room air - I will use Scale 1 as he does not have confirmed hypercapnic respiratory failure - 94% scores 1. He is breathing room air so no additional points for supplemental oxygen. His systolic blood pressure is 104 mmHg - this falls in the 101-110 range, which scores 1. Heart rate 96 - in the 91-110 range, scores 1. He is alert and orientated, so ACVPU is A, scoring 0. Temperature is 38.6°C - in the 38.1-39.0 range, scores 1. Adding these up: 1+1+0+1+1+0+1 = 6. A NEWS2 of 6 is medium risk. This requires urgent review by a ward-based doctor within one hour. I would inform the nurse-in-charge and the medical team using SBAR, and increase his observations to hourly. Given the elevated temperature and tachycardia, I am concerned about possible early sepsis and would want to initiate a sepsis screen."
Common OSCE Scenarios
SCENARIO 1: Pneumonia (Medium Risk)
| Vital Sign | Value | Score |
|---|---|---|
| RR | 24 | 1 |
| SpO2 (Scale 1) | 93% | 2 |
| Supplemental O2 | 2L NC | +2 |
| Systolic BP | 116 mmHg | 0 |
| HR | 105 bpm | 1 |
| ACVPU | Alert | 0 |
| Temperature | 38.7°C | 1 |
SCENARIO 2: COPD Exacerbation (Scale 2 Trap)
| Vital Sign | Value | Score |
|---|---|---|
| RR | 22 | 1 |
| SpO2 (Scale 2!) | 91% | 0 (within 88-92% target) |
| Supplemental O2 | 28% Venturi | +2 |
| Systolic BP | 142 mmHg | 0 |
| HR | 88 bpm | 0 |
| ACVPU | Alert | 0 |
| Temperature | 37.4°C | 0 |
SCENARIO 3: Post-Op Patient with New Confusion
| Vital Sign | Value | Score |
|---|---|---|
| RR | 18 | 0 |
| SpO2 (Scale 1) | 96% on air | 0 |
| Supplemental O2 | None | 0 |
| Systolic BP | 102 mmHg | 1 |
| HR | 95 bpm | 1 |
| ACVPU | New confusion (C) | 3 |
| Temperature | 36.8°C | 0 |
SCENARIO 4: Deteriorating Patient - Trend Recognition
| Time | Score |
|---|---|
| 08:00 | 2 |
| 12:00 | 3 |
| 16:00 | 5 |
| 20:00 | 7 |
5 Confidence-Building Frameworks for the OSCE Station
-
Don't panic if you make an arithmetic error - state your reasoning aloud. Examiners give method marks. Say "let me recheck that addition" and recalculate.
-
Always state which O2 scale you are using and WHY - this alone can earn 2-3 marks.
-
The "total + single 3" double-check - after calculating the total, always ask: "Does any single parameter score 3? If yes, escalate urgently regardless of total."
-
If the patient looks well but NEWS2 is high - say "clinical appearance can be deceptive and NEWS2 reflects objective physiology. I would escalate based on the objective score."
-
If the total is low but you're clinically worried - say "NEWS2 is a screening tool, not the whole picture. If I am clinically concerned despite a low score, I would still escalate and document my clinical reasoning."
ONE-PAGE QUICK REFERENCE CARD
╔══════════════════════════════════════════════════════════════╗
║ NEWS2 OSCE QUICK REFERENCE GUIDE ║
╠══════════════════════════════════════════════════════════════╣
║ PARAMETER │ SCORE 3 │ SCORE 2 │ SCORE 1 │ SCORE 0 ║
║ RR (br/min) │ ≤8 / ≥25 │ 21-24 │ 9-11 │ 12-20 ║
║ SpO2 Scale 1 │ ≤91% │ 92-93% │ 94-95% │ ≥96% ║
║ SpO2 Scale 2 │ ≤83% │ 84-85% │ 86-87% │ 88-92% ║
║ (Scale 2: 93-94=1, 95-96=2, ≥97=3 - HIGH is BAD in COPD) ║
║ Supplemental O2 │ +2 points if on ANY oxygen ║
║ Systolic BP │≤90/≥220 │ 91-100 │101-110 │111-219 ║
║ HR (bpm) │ ≤40/≥131 │ 111-130 │ 41-50, │ 51-90 ║
║ │ │ │ 91-110 │ ║
║ ACVPU │ C/V/P/U=3 │ - │ - │ A=0 ║
║ Temp (°C) │ ≤35.0 │ ≥39.1 │35.1-36.0 │36.1-38 ║
║ │ │ │ │38.1-39=1║
╠══════════════════════════════════════════════════════════════╣
║ SCORE │ RISK │ MONITORING │ ACTION ║
║ 0 │ None │ 12-hourly │ Routine monitoring ║
║ 1-4 │ Low │ 4-6 hourly │ Nurse assessment, consider ║
║ │ │ │ escalation ║
║ Any 3 │ L-Med │ 1-hourly │ Urgent ward DOCTOR review ║
║ 5-6 │ Medium │ 1-hourly │ Urgent review → consider CCT ║
║ ≥7 │ HIGH │ CONTINUOUS │ EMERGENCY: Critical care team║
╠══════════════════════════════════════════════════════════════╣
║ THE GOLDEN RULES: ║
║ 1. Any single score of 3 = URGENT escalation (always) ║
║ 2. State SpO2 scale used + reason (COPD vs not) ║
║ 3. +2 for ANY supplemental oxygen (don't forget!) ║
║ 4. Confusion (new) = score 3, not 1 ║
║ 5. Trend matters - rising scores = earlier escalation ║
╠══════════════════════════════════════════════════════════════╣
║ MNEMONIC: "ROOST-C" (the 6 parameters + O2) ║
║ R - Respiratory rate ║
║ O - O2 saturations (which scale?) ║
║ O - On supplemental oxygen? (+2) ║
║ S - Systolic blood pressure ║
║ T - Temperature ║
║ C - Consciousness (ACVPU) ║
║ (+Heart rate) ║
╠══════════════════════════════════════════════════════════════╣
║ ESCALATION SCRIPT (SBAR): ║
║ "I'm calling about [name] in [bay]. I'm concerned about ║
║ deterioration. [Background]. Their NEWS2 is [X]. I ║
║ recommend urgent review because [reason]. Can you come ║
║ now / within [timeframe]?" ║
╚══════════════════════════════════════════════════════════════╝
Summary of Common OSCE Mistakes (and How to Fix Them)
| Mistake | Fix |
|---|---|
| Forgetting the +2 for supplemental O2 | Ask yourself "Is the patient on any oxygen?" before totalling |
| Using Scale 1 for a COPD patient | Read the scenario carefully for "confirmed hypercapnic respiratory failure" / "target sats 88-92%" |
| Scoring new confusion as 1 | New confusion (C in ACVPU) = 3, not 1 - there is no middle ground |
| Not saying which scale you used | Always verbalise: "I am using Scale 1/2 because..." |
| Failing to escalate a single score of 3 | After totalling, always scan for any individual 3 |
| Calculating correctly but not knowing what to DO | Memorise the four escalation tiers and at least one concrete action per tier |
| Being vague about escalation | Name the specific person: "I would call the ward SHO / MET team / critical care outreach" |
sample history in secondary survey each letter has mean?
SAMPLE / AMPLE History in the Secondary Survey
What Is the Secondary Survey?
- Obtain a focused, relevant history of the patient and injury
- Perform a systematic head-to-toe physical examination to identify all significant injuries
- Rosen's Emergency Medicine; Tintinalli's Emergency Medicine
The SAMPLE Mnemonic - Every Letter Explained
| Letter | Stands For | What to Ask | Why It Matters |
|---|---|---|---|
| S | Signs & Symptoms | What is the patient experiencing right now? Pain (location, character, severity, radiation, onset)? Nausea, shortness of breath, dizziness? | Identifies the chief complaint and guides examination priorities |
| A | Allergies | Any allergies to medications, food, latex, contrast dye? What type of reaction (rash, anaphylaxis, intolerance)? | Prevents administration of a drug that could cause anaphylaxis - critical before giving any IV medications including analgesia or antibiotics |
| M | Medications | Current prescribed medications, over-the-counter drugs, supplements, herbal remedies? Doses? When last taken? | Anticoagulants (warfarin, NOACs) increase bleeding risk; beta-blockers mask tachycardia in shock; steroids suppress immune/stress response; insulin/diabetic meds affect glucose management |
| P | Past Medical/Surgical History | Previous illnesses, hospitalisations, surgeries? Chronic conditions (diabetes, heart disease, COPD, renal failure)? | Comorbidities alter physiological response and management - a diabetic may not mount a fever; a patient on dialysis handles fluids differently |
| L | Last Oral Intake | When did the patient last eat or drink? What and how much? | Determines anaesthetic risk - aspiration risk during intubation or emergency surgery; full stomach = rapid sequence induction |
| E | Events / Environment | What happened leading up to this? Mechanism of injury? Did the collapse precede the incident (e.g., syncopal episode before a car crash)? Anything unusual in the environment? | Identifies mechanism, guides injury prediction pattern, and may reveal whether the injury caused a medical event (e.g., MI → crash) or vice versa |
AMPLE vs SAMPLE
| AMPLE | = | Allergies - Medications - Past history - Last meal - Events |
|---|
Both versions are correct and accepted. SAMPLE is more comprehensive and preferred in many OSCE contexts because it explicitly prompts you to document the current complaint. AMPLE is the version specifically named in Rosen's Emergency Medicine and Tintinalli's Emergency Medicine.
Where SAMPLE Fits in the Trauma Sequence
Scene Safety
↓
PRIMARY SURVEY (ABCDE / <C>ABCDE)
- Airway + C-spine
- Breathing
- Circulation + haemorrhage control
- Disability (GCS, pupils, BM)
- Exposure
↓
Resuscitation running in parallel
↓
SECONDARY SURVEY
├─ SAMPLE / AMPLE history ← YOU ARE HERE
└─ Head-to-toe physical examination
- Head & face
- Neck & C-spine
- Chest
- Abdomen
- Pelvis
- Extremities
- Back (log roll)
- Neurological
↓
Adjuncts (bloods, imaging, ECG)
↓
Definitive care
Worked OSCE Example
| Letter | Question | Patient's Answer | Clinical Action |
|---|---|---|---|
| S | "Where does it hurt? Any difficulty breathing?" | Right chest pain, worse on breathing; right leg pain | Examine right chest (pneumothorax? rib fractures?); examine right leg (open fracture?) |
| A | "Any allergies to medications or anything else?" | Penicillin → rash | Avoid amoxicillin; use alternative antibiotic (e.g., clindamycin for open fracture prophylaxis) |
| M | "What regular medications do you take?" | Rivaroxaban (NOAC) for AF | High bleeding risk; contact haematology - may need reversal agent (Andexanet alfa); avoid IM injections |
| P | "Any medical conditions or previous operations?" | Atrial fibrillation; previous splenectomy 5 years ago | Asplenic patient = high risk of overwhelming post-splenectomy infection; ensure vaccinations checked; low threshold for antibiotics |
| L | "When did you last eat or drink?" | Full meal 2 hours ago | Aspiration risk - if intubation/surgery needed, RSI mandatory; inform anaesthetist |
| E | "What happened? Did anything happen just before the crash?" | Felt "dizzy" then woke up on the road | Possible syncopal episode BEFORE crash → primary cardiac or neurological event caused the RTC; need ECG, cardiac monitoring, neuro assessment; injury is secondary |
Key OSCE Scoring Points
| What Examiners Look For | How to Deliver It |
|---|---|
| Systematic order | Go through each letter in order - do not skip |
| Allergy follow-up | Always ask the type of reaction, not just "do you have allergies?" |
| Last meal follow-up | Note the time AND content - relevant for anaesthetic planning |
| Events - ask about pre-event symptoms | "Did you feel anything before it happened?" distinguishes medical cause from mechanical injury |
| Documenting clearly | State findings as you go: "No known drug allergies - documented. Currently on rivaroxaban - documented." |
| Relating findings to management | After each letter, briefly state the implication: "Patient is on warfarin, so I need to check a coagulation screen and contact haematology." |
Quick Memory Card
╔══════════════════════════════════════════════════════╗
║ SAMPLE HISTORY - SECONDARY SURVEY ║
╠══════════════════════════════════════════════════════╣
║ S - Signs & Symptoms ║
║ Current complaint, pain (SOCRATES), severity ║
║ ║
║ A - Allergies ║
║ Drug, food, latex → ask TYPE of reaction ║
║ ║
║ M - Medications ║
║ Prescribed, OTC, supplements, doses, timing ║
║ ⚠ Anticoagulants / beta-blockers / steroids ║
║ ║
║ P - Past Medical / Surgical History ║
║ Chronic illness, previous surgery, admissions ║
║ ║
║ L - Last Oral Intake ║
║ When + what → aspiration / anaesthetic risk ║
║ ║
║ E - Events / Environment ║
║ Mechanism of injury, pre-event symptoms ║
║ Did a medical event CAUSE the injury? ║
╠══════════════════════════════════════════════════════╣
║ RULE: Only performed AFTER primary survey complete ║
║ RULE: Never delay life-saving treatment for SAMPLE ║
║ RULE: If patient unconscious → paramedics, family, ║
║ medic alert bracelet, previous notes ║
╚══════════════════════════════════════════════════════╝
Sources: Rosen's Emergency Medicine: Concepts and Clinical Practice; Tintinalli's Emergency Medicine: A Comprehensive Study Guide; Bailey and Love's Short Practice of Surgery 28e

what is mean by anc?
ANC - Absolute Neutrophil Count
What it means
How to Calculate It
- WBC = 3000 cells/µL
- Neutrophils = 20%, Bands (immature neutrophils) = 5%
- ANC = (20 + 5) / 100 × 3000 = 750 cells/µL → Moderate neutropenia
ANC Reference Ranges
| ANC Level | Classification | Clinical Significance |
|---|---|---|
| > 1500 cells/µL | Normal | Full infection-fighting capacity |
| 1000 - 1500 | Mild neutropenia | Slightly increased infection risk |
| 500 - 1000 | Moderate neutropenia | Significant infection risk - monitor closely |
| < 500 cells/µL | Severe neutropenia | HIGH risk - any fever = medical emergency |
| < 100 cells/µL | Profound neutropenia | Extreme risk - life-threatening |
- Roberts and Hedges' Clinical Procedures in Emergency Medicine; Rosen's Emergency Medicine
Why the Slide Says "ANC < 500 + Fever = Obtain Cultures + Empiric Antibiotics"
Why ANC < 500 is the danger threshold
Why fever is the key trigger
- Single temperature ≥ 38.3°C, OR
- Sustained temperature ≥ 38.0°C for ≥ 1 hour
The Protocol When ANC < 500 + Fever
| Step | Action | Reason |
|---|---|---|
| 1 | Draw ≥ 2 sets of blood cultures BEFORE antibiotics | Identify the organism |
| 2 | Urine culture, CXR, other relevant cultures | Find the source |
| 3 | Start empiric broad-spectrum IV antibiotics immediately | Cannot wait for culture results - 10% of patients will die if delayed |
| 4 | Admit to hospital | 20-30% require HDU/ICU level care |
Connecting This to Your Pancytopenia Slide
| Cell Line Affected | Result | Monitored By |
|---|---|---|
| RBCs reduced | Anaemia → fatigue, pallor | Haemoglobin |
| Platelets reduced | Thrombocytopenia → petechiae, bleeding | Platelet count |
| WBCs/Neutrophils reduced | Neutropenia → infections, fever | ANC |
Quick Summary Card
ANC = Absolute Neutrophil Count
Normal: > 1500 cells/µL ✓
Mild: 1000-1500 ⚠
Moderate: 500-1000 ⚠⚠
Severe: < 500 🔴 DANGER
ANC < 500 + FEVER = EMERGENCY
→ Blood cultures × 2
→ Other cultures (urine, sputum)
→ EMPIRIC IV ANTIBIOTICS NOW
→ Admit
Formula:
ANC = (% neutrophils + % bands) / 100 × WBC

please help me with this
ureteric renal calculus CT KUB stone urinary tract
Case Scenario No. 3 - Complete Worked Answer
First: Reading the Dipstick Results
| Parameter | Result | Normal? | Significance |
|---|---|---|---|
| Color | Dark Yellow | Borderline | Concentrated urine - likely dehydration |
| Appearance | Cloudy | Abnormal | Blood, cells, crystals, or infection |
| pH | 6.0 | Normal (4.5-8.0) | No acid-base abnormality |
| Specific Gravity | 1.015 | Normal (1.003-1.030) | Mildly concentrated |
| Nitrite | Negative | Normal | No gram-negative bacteria |
| Protein | Negative | Normal | No glomerular disease |
| Blood | 3+ | ABNORMAL | Significant haematuria |
| Leukocyte Esterase | Negative | Normal | No significant white cells (no UTI) |
| Ketones | Negative | Normal | |
| Glucose | Negative | Normal | No diabetes |
| Bilirubin | Negative | Normal | No liver disease |
Q1: What is Your Interpretation of the Urine Multi-Dipstick Testing?
Full Answer:
- Blood 3+ - significant haematuria (either microscopic or beginning to become visible)
- Cloudy appearance - consistent with the presence of blood cells/particles in urine
- Dark yellow, concentrated urine - patient is dehydrated (likely from pain/vomiting/poor intake), which can concentrate blood, making it appear more prominent
- Negative nitrite + negative leukocyte esterase - effectively rules out a bacterial UTI as the primary cause
- Negative protein - makes glomerulonephritis less likely as the primary cause
Important note: The dipstick detects heme - it cannot distinguish between intact red blood cells, free haemoglobin (haemolysis), and myoglobin (rhabdomyolysis). Confirmation with urine microscopy is essential to confirm true haematuria (>3-5 RBCs per high-power field). - Campbell-Walsh-Wein Urology; Symptom to Diagnosis: An Evidence-Based Guide
Q2: Provisional Diagnosis and Differential Diagnosis
Provisional Diagnosis: Ureteric Colic Secondary to Urolithiasis (Kidney/Ureteric Stone)
Clinical Reasoning - Why This Fits Perfectly:
| Clinical Feature | How It Points to Urolithiasis |
|---|---|
| Excruciating lower abdominal / loin pain | Stone causes ureteric spasm as it migrates |
| Comes in waves (colicky) | Classic visceral colicky pain from ureteric peristalsis against the obstruction |
| Not relieved by aspirin, Tylenol, position | Hallmark of ureteric colic - no position provides relief (unlike peritonitis, which is worse on movement) |
| Second sleepless night | Severe, unremitting pain |
| Never experienced before | New episode, not recurrent UTI |
| Blood 3+ on dipstick | Stone scrapes urothelium as it moves → haematuria |
| No nitrites / no leukocytes | Not a simple UTI |
| Dark yellow / concentrated urine | Dehydration (common in colic - nausea, poor intake, sweating from pain) |
Differential Diagnosis for Haematuria + Lower Abdominal Pain
| Diagnosis | Key Supporting Features | Key Differentiating Points |
|---|---|---|
| Urolithiasis (Most Likely) | Colicky pain, waves, no position relief, haematuria, no fever/leukocytes | CT KUB will show stone |
| Urinary Tract Infection (UTI) | Dysuria, frequency, urgency, fever | Leukocytes + nitrites positive on dipstick - here BOTH negative |
| Glomerulonephritis | Hypertension, proteinuria, oedema, dysmorphic RBCs, RBC casts | Protein negative here; no systemic features |
| Bladder/Renal Tumour | Painless haematuria, older patient, smoker | Usually painless; needs cystoscopy to exclude |
| Trauma | History of injury | No trauma in this case |
| Coagulopathy / anticoagulants | Drug history, bruising, bleeding elsewhere | No medications mentioned |
| Renal tuberculosis | Sterile pyuria, chronic symptoms, TB contact | No leukocytes, acute presentation |
| Appendicitis | RIF pain, fever, elevated WBC, rebound tenderness | Pain location/character different |
| AAA (Aortic Aneurysm) | Older patient, pulsatile mass, tearing pain | Must exclude in older males |
The absence of fever, leukocyturia, and nitrites strongly argues against infection. The colicky, wave-like quality of pain unrelieved by position is the pathognomonic hallmark of ureteric colic. - Comprehensive Clinical Nephrology 7e; Symptom to Diagnosis 4e
Q3: Three Investigations Most Helpful for the Next Step
Investigation 1: Non-Contrast CT KUB (CT Urography) - FIRST LINE
- Most sensitive and specific investigation for ureteric/renal stones
- Detects stones of all compositions (including radiolucent uric acid stones that X-ray misses)
- Identifies the exact location, size, and number of stones
- Detects hydronephrosis (backup of urine above the stone = kidney at risk)
- Identifies the transition point (where stone is stuck)
- Rules out other dangerous causes of acute abdominal pain (AAA, appendicitis, ovarian pathology)
- Results available within minutes in emergency settings
- No contrast needed - avoids allergy/renal risk
- Has replaced intravenous urography (IVU) as the gold standard
"Unenhanced helical CT scanning has replaced contrast intravenous urography (IVU) as a diagnostic test for acute ureteral colic because it is more sensitive and specific for ureteral stones and ureteral obstruction." - Comprehensive Clinical Nephrology 7e
Investigation 2: Urine Microscopy, Culture and Sensitivity (MC&S)
- Confirms true haematuria (>3-5 RBCs per HPF) vs haemoglobinuria or myoglobinuria (dipstick detects all three - can't distinguish)
- Looks for RBC morphology:
- Dysmorphic/crenated RBCs → glomerular (kidney) origin
- Normal-shaped RBCs → lower urinary tract / mechanical (stone)
- Looks for RBC casts → glomerulonephritis
- Looks for crystals (oxalate, uric acid, struvite, cystine) → type of stone
- Looks for WBCs and bacteria → occult infection alongside stone
- Culture rules out concurrent UTI (stones can be infected - "infected stone" requires urgent treatment)
"The critical step in the evaluation of hematuria is the examination of a freshly voided urine sample that includes microscopic assessment." - Campbell-Walsh-Wein Urology
Investigation 3: Kidney Ultrasound (Renal Ultrasonography)
- Detects hydronephrosis (dilation of collecting system due to obstruction) - key finding for ureteric obstruction
- Identifies large renal stones (echogenic foci with shadowing)
- Useful when CT is unavailable, contraindicated (pregnancy, radiation-sensitive), or as a quick bedside assessment
- Can assess renal perfusion (Doppler)
- Preferred first-line in pregnancy and children
- Lower sensitivity than CT for small ureteric stones but identifies obstruction reliably
"Ultrasonography is the first-line imaging modality for pregnant women and patients younger than 14 years." - Comprehensive Clinical Nephrology 7e
Bonus (Often Expected): Serum Blood Tests
| Blood Test | Reason |
|---|---|
| U&E + Creatinine | Assess renal function - is the obstructed kidney failing? |
| Serum calcium | Hypercalcaemia is a common cause of calcium stones |
| Serum uric acid | Elevated in uric acid stone disease (gout) |
| FBC | Leukocytosis would suggest infected stone/sepsis |
| Serum phosphate + PTH | If calcium elevated → rule out hyperparathyroidism |
| CRP | Inflammation/infection marker |
Summary Diagram
45-year-old male
Colicky lower abdominal pain (waves)
Not relieved by ANY position or analgesia
Dipstick: Blood 3+, rest NORMAL
↓
PROVISIONAL DIAGNOSIS: URETERIC COLIC
(Stone obstructing ureter → ureteric spasm → haematuria)
↓
┌────────────────────────────────────────────┐
│ THREE KEY INVESTIGATIONS │
│ │
│ 1. CT KUB (non-contrast) │
│ → Locate, size, and type of stone │
│ → Detect hydronephrosis │
│ → Rule out other diagnoses │
│ │
│ 2. Urine MC&S (microscopy) │
│ → Confirm true haematuria │
│ → RBC morphology / casts / crystals │
│ → Rule out concurrent infection │
│ │
│ 3. Renal Ultrasound │
│ → Hydronephrosis │
│ → Large stones │
│ → Safer in pregnancy/children │
└────────────────────────────────────────────┘
↓
+ Bloods: U&E, Ca, Uric Acid, FBC, CRP
why u exclude the niphritic ?
Why Nephritic Syndrome Is Lower on the Differential (But Not Fully Excluded)
What Nephritic Syndrome Requires (Full Tetrad)
| Feature | Mechanism |
|---|---|
| Haematuria | Glomerular basement membrane disruption → RBCs leak into urine |
| Oliguria + Azotaemia | Reduced GFR from glomerular inflammation |
| Proteinuria | Increased glomerular permeability (usually subnephrotic, <3.5g/day) |
| Hypertension | Sodium and water retention from reduced GFR |
"Nephritic syndrome is characterized by hematuria, oliguria with azotemia, proteinuria, and hypertension." - Robbins, Cotran & Kumar Pathologic Basis of Disease
Now Apply the Tetrad to This Patient
| Nephritic Feature | Present in This Case? | Evidence From the Case |
|---|---|---|
| Haematuria | ✅ YES | Blood 3+ on dipstick |
| Oliguria / Azotaemia | ❌ NOT MENTIONED | No mention of reduced urine output or renal failure |
| Proteinuria | ❌ ABSENT | Protein = NEGATIVE on dipstick |
| Hypertension | ❌ NOT MENTIONED | No blood pressure recorded or mentioned |
| Oedema | ❌ NOT MENTIONED | No facial/peripheral oedema |
| Recent infection | ❌ NOT MENTIONED | No pharyngitis, skin infection, or recent illness (relevant for post-streptococcal GN) |
The Single Most Important Exclusion: Protein is NEGATIVE
The Other Key Clues That Point Away from Nephritic
| Clinical Feature | Why It Argues Against Nephritic |
|---|---|
| Colicky, wave-like pain | Nephritic pain (if any) is a dull bilateral flank ache from renal capsule stretching - NOT colicky waves |
| Pain unrelieved by any position | Classic ureteric colic hallmark - nephritic GN does not cause this type of pain |
| Concentrated, dark yellow urine (SG 1.015) | Dehydration from pain/vomiting - kidneys still concentrating → GFR likely preserved |
| Cloudy appearance | More consistent with cells/debris from mechanical trauma (stone) than glomerular bleeding |
| No systemic features | No rash, joint pain, oedema, recent sore throat - no clues toward lupus, IgA, or post-streptococcal GN |
How Glomerular vs Non-Glomerular Haematuria Differ
| Feature | Glomerular (Nephritic) | Non-Glomerular (Stone/Mechanical) |
|---|---|---|
| Urine colour | Brown / tea-coloured (RBCs oxidised in tubules) | Red / pink / blood-tinged |
| Proteinuria | Present (usually) | Absent or minimal |
| RBC morphology (microscopy) | Dysmorphic / crenated RBCs, acanthocytes | Normal-shaped RBCs |
| RBC casts | Present = pathognomonic for GN | Absent |
| Pain character | Dull bilateral flank ache, or painless | Colicky, unilateral, severe, waves |
| Hypertension | Common | Not expected acutely |
| Oedema | May be present | Absent |
So What Is the Correct Position on Nephritic Syndrome?
| Should it be on the differential? | YES - haematuria with Blood 3+ always includes glomerulonephritis in the list |
| Is it the most likely diagnosis? | NO - protein negative, colicky pain, no systemic features make it unlikely |
| How do you definitively exclude it? | Urine microscopy (no dysmorphic RBCs, no RBC casts) + serum creatinine normal + blood pressure normal |
The Corrected Differential Diagnosis - Ranked
| Rank | Diagnosis | Reason |
|---|---|---|
| 1st | Urolithiasis (ureteric colic) | Colicky pain + haematuria + no protein + no infection |
| 2nd | Bladder/renal tumour | Haematuria (usually painless, but must exclude) |
| 3rd | Glomerulonephritis / Nephritic syndrome | Blood 3+ warrants keeping this on list - excluded by protein negative, colicky pain, no systemic features |
| 4th | UTI | Leukocytes and nitrites negative makes this unlikely |
| 5th | Trauma | No history of injury |
Summary
You were right to question the exclusion. Nephritic syndrome belongs on the differential whenever you see haematuria. In this case, the negative protein, colicky pain pattern, and absence of systemic features push it to a lower priority - but urine microscopy looking for dysmorphic RBCs and RBC casts, plus a serum creatinine and blood pressure measurement, are the investigations that would formally exclude it.

what do u think here?
Case Scenario No. 4 - Full Analysis
The Critical Finding: The Contradiction
| Parameter | Result |
|---|---|
| Color | RED |
| Appearance | Clear |
| Blood | NEGATIVE |
| Everything else | Negative |
RED urine + NEGATIVE blood on dipstick = NOT haematuria.
The Most Important Rule in Urinalysis
"A negative result on dipstick examination virtually excludes haematuria."
- Brenner & Rector's The Kidney
"After centrifugation, the red colour persists only in the urine sediment with haematuria. By contrast, a red supernatant that contains no RBCs on microscopic analysis typically represents a benign condition."
- Rosen's Emergency Medicine
What Causes Red Urine With Negative Dipstick for Blood?
| Cause | Source | Notes |
|---|---|---|
| Beetroot (Beeturia) | Food | Most common cause of red heme-negative urine; affects ~14% of people who eat beets |
| Berries (blackberries, blueberries) | Food | Anthocyanin pigments |
| Rhubarb | Food | |
| Food colouring/dyes | Food/drinks | Artificial red dyes |
| Phenazopyridine | Medication (UTI pain relief) | Turns urine orange-red |
| Rifampin | Antibiotic | Orange-red urine |
| Nitrofurantoin | Antibiotic | Brown-yellow |
| Chloroquine / Hydroxychloroquine | Antimalarial | |
| Porphyria | Metabolic disease | Urine turns red-brown on standing |
| Urate crystals | Dehydration | Pink/red "brick dust" |
- Rosen's Emergency Medicine (Box 85.7: Causes of Red-Coloured Urine)
Now Apply This to the Clinical Context
The Story Has Red Flags for Malingering / Fabrication
| Clinical Clue | Significance |
|---|---|
| Second day on new job | Clear motivation - seeking compensation/sick leave |
| "No one saw her fall" | Unwitnessed - cannot be verified |
| She "convinced" her supervisor | Self-reported injury, not witnessed |
| She brought the urine specimen herself | She had time and opportunity to tamper with it |
| Pain "began after" the fall | Retrospective attribution |
| Urine is RED but dipstick is NEGATIVE | The single most important clue - fabricated haematuria |
| Urine is CLEAR | Real haematuria would make urine turbid or at least slightly cloudy |
| All other parameters completely normal | Normal pH, SG, protein, leukocytes - healthy urine |
The Interpretation
The Diagnosis
Primary: Malingering / Factitious Haematuria (Fabricated Red Urine)
A real haematuria sample would be:
- Blood POSITIVE on dipstick (extremely sensitive - detects as little as 1-2 RBCs/HPF)
- Possibly turbid/cloudy, not clear
- May contain protein (if glomerular)
- Confirmed by RBCs on microscopy
How to Confirm This Clinically
| Step | Investigation | Expected Finding |
|---|---|---|
| 1 | Urine microscopy (spin the urine) | Zero red blood cells - confirming no true haematuria |
| 2 | Repeat urine sample - supervised / directly observed collection | Normal clear yellow urine with negative blood |
| 3 | Urine centrifugation | Red supernatant after spinning → pigment (not blood, which stays in sediment) |
| 4 | Urine culture | Negative (as expected) |
| 5 | Clinical examination | Lower abdominal examination - may be completely normal |
Summary Comparison: True Haematuria vs This Case
| Feature | True Haematuria | This Case |
|---|---|---|
| Urine colour | Red/brown/pink | Red |
| Dipstick blood | POSITIVE | NEGATIVE |
| Urine appearance | Cloudy (if heavy) | Clear |
| Protein | May be present (GN) | Negative |
| Leukocytes | May be present (UTI) | Negative |
| After centrifugation | Red sediment | Red supernatant |
| Microscopy | RBCs present | No RBCs |
The Bottom Line
This patient does NOT have haematuria. The red colour of the urine is caused by an exogenous pigment - almost certainly something the patient deliberately added to simulate blood. The dipstick is highly sensitive for blood and its negative result virtually excludes any haem-containing substance (RBCs, haemoglobin, myoglobin).
diagnostic approach to af with ecg
atrial fibrillation ECG irregularly irregular absent P waves fibrillatory baseline
This diagnostic image displays a single-lead electrocardiogram (ECG) rhythm strip, divided into three continuous segments of 10 seconds each, totaling a 30-second recording. The first segment (0-10s) exhibits significant baseline wandering and disorganized electrical activity, characterized by erratic morphology that obscures distinct P waves and QRS complexes, which may represent artifact or severe arrhythmia. The subsequent segments (10-30s) demonstrate a more stable baseline with visible, narrow QRS complexes. However, the rhythm remains irregularly irregular with absent P waves, replaced by subtle fibrillatory waves in certain sections. A red annotation box labeled 'Irreg sequence/possible AF' highlights the clinical suspicion of Atrial Fibrillation. This image is used in medical education to illustrate the challenges of ECG interpretation, specifically differentiating between motion artifacts, uninterpretable signals, and pathological arrhythmias like Atrial Fibrillation or Atrial Tachycardia.
This Comparison Chart illustrates electrocardiography (ECG) waveforms in a single patient during both atrial fibrillation (AF) and sinus rhythm (SR). (a) A 5-second ECG strip showing AF characterized by an irregularly irregular rhythm, absent P waves, and fine fibrillatory oscillations of the baseline. (b) An extracted average beat from the AF strip, revealing a clear T wave and a subsequent U wave that was previously obscured by fibrillatory noise. (c) A 5-second ECG strip showing SR with a regular rhythm, identifiable P waves preceding each QRS complex, and visible U waves. (d) An extracted average beat from the SR strip showing clear P, T, and U wave morphologies. The comparison demonstrates that U waves maintain similar morphology across both rhythms, though they are often indistinguishable in raw AF recordings without signal processing. Scale bars indicate 0.5 mV and 0.5 s. This image is relevant for cardiology students and clinicians studying ventricular repolarization and advanced ECG signal analysis.
A series of sequential electrocardiogram (ECG) rhythm strips showing Lead II tracings over a seven-day clinical course, illustrating fluctuating cardiac rhythms and conduction disturbances. Day 3 displays a rapid, irregularly irregular rhythm with absent P-waves and undulating fibrillatory baseline, diagnostic of atrial fibrillation with rapid ventricular response (RVR). Day 5 shows spontaneous conversion to sinus rhythm with identifiable P-waves and a more regular rate. Tracings from Day 8 highlight significant rhythm instability, including a slow escape rhythm with widened, unusual QRS morphologies and ST-segment deviations, followed by a transition back to a tachycardic, irregular wide-complex rhythm. Day 9 demonstrates a return to a more regular sinus rhythm with distinct P-waves preceding each QRS complex. This timeline serves as a clinical illustration of paroxysmal atrial fibrillation, conversion pauses, and the management of rhythm and rate control in a symptomatic patient.
atrial fibrillation rapid ventricular response 12 lead ECG classic teaching
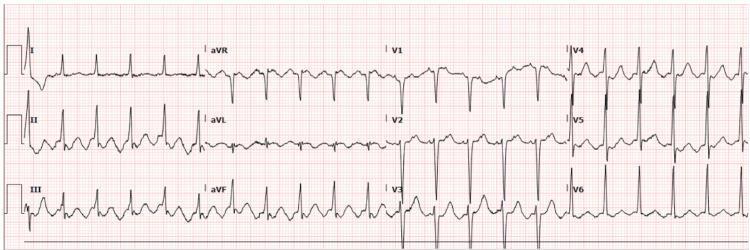
This diagnostic image is a standard 12-lead electrocardiogram (ECG) demonstrating a supraventricular tachyarrhythmia. The most prominent finding is a classic 'sawtooth' pattern of atrial activity, most visible in inferior leads II, III, and aVF, characteristic of atrial flutter. The ventricular rate is rapid and irregularly irregular, indicating atrial flutter with variable conduction. The QRS complexes are narrow (measured at 85 ms), indicating a supraventricular origin of the rhythm. There is no evidence of acute ST-segment elevation or depression, and T-wave morphology appears normal across all leads. The QTc is reported as 377 ms, within normal physiological limits. This visual serves as a clinical teaching tool for identifying typical atrial flutter with rapid ventricular response (RVR) and distinguishing it from other tachyarrhythmias such as atrial fibrillation or ventricular tachycardia. It is relevant for cardiology training and acute care medicine.
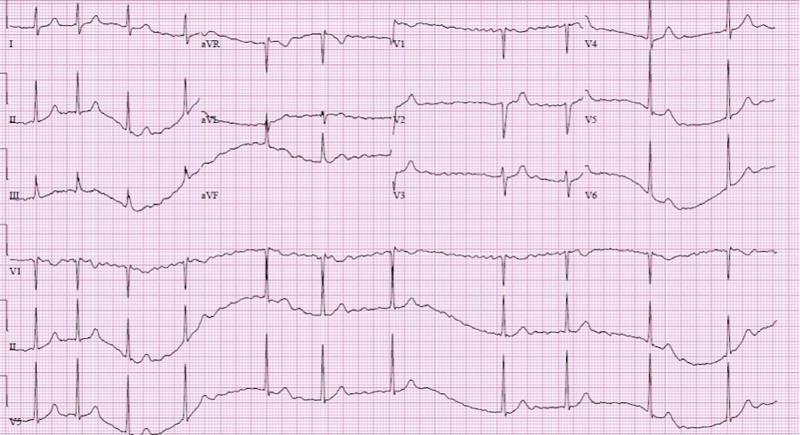
This diagnostic image is a 12-lead electrocardiogram (ECG) printed on standard pink grid paper, demonstrating a classic presentation of atrial fibrillation (AF). The primary finding is an irregularly irregular rhythm, characterized by varying R-R intervals across all leads. There is a complete absence of discernible, organized P waves; instead, the baseline shows fine, fibrillatory oscillations, most visible in leads V1 and II. The ventricular rate is controlled (normal rate), suggesting this is not a rapid ventricular response (RVR) at this moment. The QRS complexes are narrow, indicating normal intraventricular conduction. T waves in the precordial leads (V1-V6) show varied morphologies, including some flattening or inversion, particularly in V1-V3, while ST segments remain relatively isoelectric without acute elevations or depressions. This ECG is representative of common cardiac dysrhythmias and serves as a teaching tool for recognizing disorganized atrial activity and irregular ventricular conduction in clinical cardiology.
normal sinus rhythm ECG P wave QRS comparison diagram
Diagnostic Approach to Atrial Fibrillation (AF) with ECG
PART 1: WHAT IS AF?
- Fuster and Hurst's The Heart, 15th Edition
PART 2: ECG DIAGNOSIS OF AF - THE 3 HALLMARKS
The Classic AF 12-Lead ECG
The 3 Diagnostic ECG Criteria (All Must Be Present)
| # | Criterion | What You See | Why It Happens |
|---|---|---|---|
| 1 | Absent P waves | No distinct upright P waves before QRS in any lead | Disorganised atrial activity replaces the single SA node impulse |
| 2 | Fibrillatory (f) waves | Chaotic, irregular oscillations of the baseline - best seen in V1 and lead II | Hundreds of re-entrant circuits producing constant low-amplitude electrical noise |
| 3 | Irregularly irregular R-R intervals | Distance between each QRS is NEVER the same - no pattern | AV node receives random impulses - conducts unpredictably |
Memory rule: In AF - No Ps, wavy baseline, totally irregular R-R. If you can march out a regular R-R anywhere on the strip, reconsider the diagnosis.
ECG Features - Step by Step Systematic Reading
STEP 1: Rate
→ Count QRS complexes in a 10-second strip × 6
→ AF with controlled ventricular rate: 60-100 bpm
→ AF with rapid ventricular response (RVR): >100 bpm ← haemodynamically significant
→ AF with slow ventricular rate: <60 bpm (often AV block + AF)
STEP 2: Rhythm
→ Are R-R intervals regular? NO → irregularly irregular ← AF hallmark
→ Compare several consecutive R-R intervals - ALL different
STEP 3: P waves
→ Look in leads II, V1 (clearest P wave leads)
→ Are there distinct P waves before each QRS? NO
→ Is there a wavy/chaotic baseline? YES → fibrillatory waves
STEP 4: QRS Complex
→ Narrow (<120 ms) = normal conduction through ventricles
→ Wide (>120 ms) = aberrant conduction (BBB) or pre-excitation (WPW)
⚠ Wide complex irregular AF = consider WPW - dangerous!
STEP 5: ST & T waves
→ Look for ST depression or elevation (acute MI can precipitate AF)
→ T wave changes (ischaemia, electrolyte imbalance)
STEP 6: Overall interpretation
→ State: "This ECG shows AF with [controlled/rapid] ventricular response
of approximately [X] bpm, with no evidence of acute ST changes."
Fibrillatory Waves - Coarse vs Fine
| Type | Appearance | Common Cause |
|---|---|---|
| Coarse f waves | Large, clearly visible oscillations >1 mm | Rheumatic mitral disease, early AF |
| Fine f waves | Barely visible oscillations <1 mm | Longstanding AF, LA fibrosis, elderly |
PART 3: NORMAL SINUS RHYTHM vs AF - COMPARISON
| Feature | Normal Sinus Rhythm | Atrial Fibrillation |
|---|---|---|
| Rate | 60-100 bpm | Variable |
| Rhythm | Regular | Irregularly irregular |
| P waves | Present, upright in II, aVF | Absent |
| PR interval | 120-200 ms, consistent | Not measurable |
| Baseline | Flat isoelectric | Chaotic fibrillatory waves |
| QRS | Narrow, uniform | Narrow (usually); wide if BBB/WPW |
| R-R intervals | All equal | All different |
AF vs Look-alike Rhythms (Differential on ECG)
| Rhythm | Key Distinguishing Feature |
|---|---|
| AF | Irregularly irregular + no P waves + fibrillatory baseline |
| Atrial Flutter | Regular "sawtooth" pattern at 300 bpm; ventricular rate regular (2:1, 3:1 block) |
| MAT (Multifocal Atrial Tachycardia) | Irregular but P waves ARE present - ≥3 different P wave morphologies |
| Sinus arrhythmia | P waves present, slight R-R variation linked to breathing |
| AF with complete heart block | AF baseline (irregular f waves) BUT ventricular rhythm is REGULAR (escape) |
| AF + WPW | Wide, bizarre, very rapid irregular QRS - life-threatening - avoid AV nodal blockers |
PART 4: CLASSIFICATION OF AF
| Type | Definition | Clinical Relevance |
|---|---|---|
| First detected | First ever documented episode | Don't know if paroxysmal or persistent yet |
| Paroxysmal | Terminates spontaneously within 7 days | Self-limiting; still needs anticoagulation if CHA₂DS₂-VASc ≥2 |
| Persistent | Lasts >7 days or needs cardioversion | Requires intervention to restore rhythm |
| Long-standing persistent | Continuous AF >12 months | Rhythm control still possible but harder |
| Permanent | AF accepted; no further rhythm control attempted | Rate control + anticoagulation only |
PART 5: CAUSES OF AF (Mnemonic - "PIRATES")
| Letter | Causes |
|---|---|
| P | Pulmonary - PE, pneumonia, COPD, sleep apnoea |
| I | Ischaemia / Infarction (MI can trigger AF) |
| R | Rheumatic heart disease (mitral stenosis - most common valvular cause) |
| A | Alcohol ("holiday heart syndrome"), Anaemia |
| T | Thyrotoxicosis (hyperthyroidism >16% incidence of AF) |
| E | Electrolyte disturbance (hypokalaemia, hypomagnesaemia) |
| S | Structural - hypertension (most common overall), HF, cardiomyopathy, post-surgery |
Also: Lone AF = AF with no identifiable cause (diagnosis of exclusion, typically young patients)
PART 6: CLINICAL FEATURES & DIAGNOSTIC WORKUP
Symptoms
| Symptom | Mechanism |
|---|---|
| Palpitations | Fast, irregular heart rate |
| Dyspnoea | Loss of atrial "kick" (20-30% of CO) → reduced cardiac output |
| Fatigue | Reduced CO, irregular filling |
| Dizziness / presyncope | Reduced cerebral perfusion |
| Chest discomfort | Rapid rate → ischaemia in underlying CAD |
| Stroke / TIA | Thrombus from left atrial appendage (LAA) embolising to brain |
| Asymptomatic | ~33% of AF patients - "silent AF" - diagnosed incidentally |
Investigations After ECG Confirmation
| Investigation | What You're Looking For |
|---|---|
| Bloods: TFTs | Thyrotoxicosis - reversible cause |
| Bloods: FBC | Anaemia, infection |
| Bloods: U&E, Mg²⁺ | Electrolyte disturbance |
| Bloods: LFTs, coagulation | Pre-anticoagulation baseline |
| Echocardiogram (TTE) | Structural heart disease, LA size, LV function, valvular disease, pericardial effusion |
| TOE (transoesophageal echo) | Exclude LAA thrombus before cardioversion if <3 weeks anticoagulation |
| Holter monitor / event recorder | Paroxysmal AF - capture intermittent episodes |
| CXR | Cardiomegaly, pulmonary oedema, lung pathology |
| Exercise ECG | Rate response, ischaemia |
| Sleep study | Obstructive sleep apnoea |
PART 7: STROKE RISK - CHA₂DS₂-VASc SCORE
| Feature | Points |
|---|---|
| C - Congestive heart failure | 1 |
| H - Hypertension | 1 |
| A₂ - Age ≥75 years | 2 |
| D - Diabetes mellitus | 1 |
| S₂ - Stroke/TIA/thromboembolism history | 2 |
| V - Vascular disease (MI, PVD, aortic plaque) | 1 |
| A - Age 65-74 years | 1 |
| Sc - Sex category (Female) | 1 |
| Maximum | 9 |
-
Score 0 (male) / 1 (female) → No anticoagulation
-
Score ≥1 (male) / ≥2 (female) → Anticoagulate (DOAC preferred over warfarin)
-
Braunwald's Heart Disease; Fuster and Hurst's The Heart
PART 8: MANAGEMENT OVERVIEW (The 3 Pillars)
┌─────────────────────────────────────────────────────┐
│ 3 PILLARS OF AF MANAGEMENT │
├─────────────────┬───────────────┬───────────────────┤
│ 1. ANTICOAGULATION│ 2. RATE CONTROL│ 3. RHYTHM CONTROL │
│ │ │ │
│ Prevent stroke │ Control HR │ Restore sinus │
│ (LAA thrombus) │ (60-100 bpm) │ rhythm │
│ │ │ │
│ DOACs (1st line)│ Beta-blockers │ Pharmacological: │
│ - Apixaban │ Diltiazem/ │ - Flecainide │
│ - Rivaroxaban │ Verapamil │ - Amiodarone │
│ - Dabigatran │ Digoxin │ - Sotalol │
│ │ (2nd line) │ │
│ Warfarin if │ │ Electrical: │
│ valvular AF │ │ - DC cardioversion│
│ (mechanical │ │ │
│ valve / MS) │ │ Ablation: │
│ │ │ - PV isolation │
└─────────────────┴───────────────┴───────────────────┘
QUICK REFERENCE ECG REVISION CARD
╔══════════════════════════════════════════════════════════╗
║ AF - ECG DIAGNOSTIC CRITERIA ║
╠══════════════════════════════════════════════════════════╣
║ 1. NO P waves (replaced by chaotic f waves) ║
║ 2. IRREGULARLY IRREGULAR R-R intervals ║
║ 3. Fibrillatory baseline (best in V1 and lead II) ║
║ 4. QRS usually NARROW (wide = BBB or WPW!) ║
╠══════════════════════════════════════════════════════════╣
║ RATE CLASSIFICATION ║
║ Controlled: 60-100 bpm ║
║ RVR (fast): >100 bpm ← haemodynamic compromise risk ║
║ Slow: <60 bpm ← check for AV block ║
╠══════════════════════════════════════════════════════════╣
║ ⚠ DANGER: Wide complex + irregular + very fast ║
║ → Consider AF + WPW (pre-excitation) ║
║ → DO NOT give adenosine, verapamil, digoxin! ║
║ → Can cause VF → use DC cardioversion ║
╠══════════════════════════════════════════════════════════╣
║ CAUSES: PIRATES ║
║ Pulmonary / Ischaemia / Rheumatic / Alcohol / ║
║ Thyrotoxicosis / Electrolytes / Structural ║
╠══════════════════════════════════════════════════════════╣
║ CHA₂DS₂-VASc ≥1 (male) / ≥2 (female) → DOAC ║
╚══════════════════════════════════════════════════════════╝

WHAT IS THE RIGHT
Answer: mMRC grade 3, GOLD stage 3 ✅ (the option already selected in your screenshot is correct)
Step 1: mMRC Dyspnea Grade
| Grade | Description |
|---|---|
| 0 | Breathless only with strenuous exercise |
| 1 | Breathless hurrying on level ground / walking up slight hill |
| 2 | Walks slower than peers due to breathlessness, or stops for breath at own pace on level ground |
| 3 | "I stop for breath after walking about 100 yards (~91 meters) or after a few minutes on level ground" |
| 4 | Too breathless to leave the house, or breathless when dressing |
- Symptom to Diagnosis: An Evidence-Based Guide, 4th Ed.
Step 2: GOLD Stage (based on post-bronchodilator FEV1 % predicted)
| GOLD Stage | Severity | FEV1 (% predicted) |
|---|---|---|
| GOLD 1 | Mild | ≥80% |
| GOLD 2 | Moderate | 50-79% |
| GOLD 3 | Severe | 30% ≤ FEV1 < 50% |
| GOLD 4 | Very Severe | <30% |
- Rosen's Emergency Medicine; The Washington Manual of Medical Therapeutics
Confirming the diagnosis of COPD itself
Conclusion
three steps of pain control in palliative care
cancer pain analgesic ladder
WHO cancer pain analgesic ladder non-opioid weak opioid strong opioid
WHO 3-step analgesic ladder for palliative cancer pain
| Step | Pain severity | Main treatment | Examples |
|---|---|---|---|
| 1 | Mild pain | Non-opioid ± adjuvant | Paracetamol, NSAID such as ibuprofen or naproxen |
| 2 | Mild to moderate pain, or pain persists after step 1 | Weak opioid ± non-opioid ± adjuvant | Codeine or tramadol |
| 3 | Moderate to severe pain, or pain persists after step 2 | Strong opioid ± non-opioid ± adjuvant | Morphine is the standard first-line strong opioid; alternatives include oxycodone, hydromorphone, fentanyl, or methadone in selected patients |
Core practical principles
- Give analgesia by mouth when possible.
- Give it by the clock, regularly, rather than only when pain becomes severe.
- Give breakthrough/rescue medication for episodic pain, usually a short-acting opioid if the patient is on step 3.
- Add adjuvants according to pain mechanism at every step:
- Neuropathic pain: gabapentin, pregabalin, duloxetine, amitriptyline.
- Bone metastasis pain: NSAID if appropriate, corticosteroid, radiotherapy, bisphosphonate or denosumab where indicated.
- Raised intracranial pressure, capsular liver pain, nerve compression: corticosteroid may help.
- Prevent and treat opioid adverse effects. Start a stimulant laxative with regular opioid therapy; consider an antiemetic during initiation.
Start with a non-opioid for mild pain, escalate to a weak opioid for persistent or moderate pain, then use a strong opioid, usually morphine, for severe pain. At every step, use appropriate adjuvants and regular dosing with breakthrough rescue analgesia.
i am now studying sore throat and there is pharngitis , quinsy tonsilitis , kindly show me the anatomy that i need to do examination
oropharynx anatomy palatine tonsils soft palate uvula anterior posterior tonsillar pillars labelled diagram
peritonsillar abscess tonsillitis
oropharyngeal examination tonsillitis peritonsillar abscess anatomy tonsillar pillars uvula authoritative
Labelled educational anatomical diagram of the open mouth and oropharynx for clinical examination: lips, tongue, hard palate, soft palate, uvula, right and left palatine tonsils, anterior tonsillar pillars (palatoglossal arches), posterior tonsillar pillars (palatopharyngeal arches), posterior pharyngeal wall, and the peritonsillar space above and lateral to one tonsil. Include an inset showing a unilateral peritonsillar abscess (quinsy) with soft-palate swelling and uvula deviated to the opposite side.
Oropharyngeal anatomy for sore-throat examination
Structures you must identify
-
Hard palate
Anterior bony roof of the mouth. -
Soft palate
Posterior mobile part of the palate. Examine for erythema, asymmetrical bulging, and swelling. -
Uvula
Midline projection from the soft palate.- Normally central.
- In a right-sided quinsy, the swollen right peritonsillar area pushes the uvula to the left, away from the abscess.
-
Palatine tonsils
On each lateral wall of the oropharynx. Look for:- Size and symmetry
- Erythema
- Exudate
- Ulceration
- Tonsilloliths
- Unilateral enlargement or medial displacement
-
Anterior tonsillar pillar / palatoglossal arch
The fold running from soft palate to the side of the tongue. It forms the anterior boundary of the tonsil. -
Posterior tonsillar pillar / palatopharyngeal arch
The fold running from the soft palate posteriorly. It forms the posterior boundary of the tonsil. -
Tonsillar fossa
The space between the anterior and posterior pillars where the palatine tonsil sits. -
Posterior pharyngeal wall
Inspect for erythema, exudate, ulcers, petechiae, or a posterior wall bulge. A bulge can suggest a retropharyngeal process. -
Peritonsillar space
Potential space between the tonsillar capsule and pharyngeal constrictor musculature. This is where pus collects in peritonsillar abscess, or quinsy. The tonsils lie between the palatoglossal and palatopharyngeal arches. AAFP anatomy overview
What each condition looks like
| Condition | Main anatomical findings |
|---|---|
| Pharyngitis | Diffuse red posterior pharyngeal wall and/or soft palate. Tonsils may be normal or mildly inflamed. |
| Tonsillitis | Bilateral tonsillar erythema, enlargement and possible white exudate. Tonsillar pillars can also be inflamed. Uvula usually remains central. |
| Quinsy / peritonsillar abscess | Usually unilateral swelling of the soft palate and anterior tonsillar pillar, with the tonsil pushed inferomedially and the uvula displaced away from the affected side. |
Quinsy pattern to memorise
Unilateral severe sore throat + trismus + muffled “hot-potato” voice + drooling + soft-palate bulge + uvula deviated to the opposite side = peritonsillar abscess until proven otherwise.
OSCE mouth and throat examination sequence
- Ask about pain, dysphagia, odynophagia, voice change, drooling and breathing difficulty.
- Inspect externally for neck swelling and cervical lymphadenopathy.
- Ask the patient to open their mouth and say “ahh.”
- Use a light and tongue depressor only if necessary.
- Inspect in order:
- lips and oral mucosa
- tongue
- hard palate
- soft palate
- uvula position
- right and left tonsils
- tonsillar pillars
- posterior pharyngeal wall
- Palpate cervical lymph nodes.
- If quinsy is possible, assess airway urgency: ability to swallow secretions, drooling, stridor, respiratory effort, and degree of trismus.