
Fundus diagram of PVR changes in Retinal detachment
proliferative vitreoretinopathy PVR fundus retinal detachment
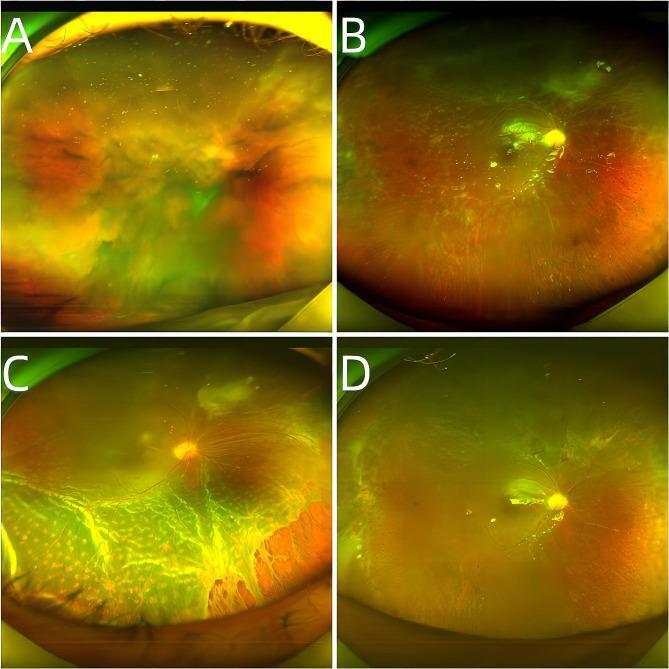
This set of four wide-field fundus photographs (labeled A-D) illustrates the progression and surgical management of Acute Retinal Necrosis (ARN) complicated by Rhegmatogenous Retinal Detachment (RRD) and Proliferative Vitreoretinopathy (PVR). Image A shows significant vitreous haze and opacity (vitritis) typical of early ARN, obscuring the posterior pole. Image B, following pars plana vitrectomy (PPV) and silicone oil tamponade, reveals widespread retinal necrosis and significant retinal vascular occlusion (vasculitis). Image C displays the fundus after silicone oil removal, characterized by severe inferior retinal detachment with extensive PVR, visible tractional bands, and retinal holes. Image D demonstrates the postoperative result after a second vitrectomy, showing a reattached, flat retina with residual peripheral proliferation and pigmentary changes from prior laser photocoagulation. This comparison highlights common complications of ARN, including PVR-induced tractional detachment following surgical intervention.
![This composite educational resource illustrates clinical and demographic aspects of Proliferative Vitreoretinopathy (PVR). Panel A shows a color fundus photograph of a human eye with severe PVR, characterized by vitreous opacification, visible epiretinal fibrous proliferation, and radial star folds causing significant retinal distortion. Panel B presents a corresponding B-scan ultrasonogram (diagnostic ultrasound) of the posterior segment, demonstrating high-amplitude echoing from thick preretinal membranes and a characteristic funnel-shaped tractional retinal detachment (closed configuration). Panel C provides a patient demographics table correlating sex, age, and clinical diagnosis (Retinal Detachment [RD], Epiretinal Membrane [ERM], or Macular Hole [MH]) with PVR severity levels (None, Mild, Severe) and exosome particle concentrations. The image serves to teach the correlation between clinical presentation, imaging findings, and laboratory biomarkers in advanced vitreoretinal disease.](https://cdn.orris.care/cdss_images/pmc_clinical_VQA_0ae69eaf886a30f854e29800bdf7e9897e56cf10db810ffce6443476acb5a64c.jpg)
This composite educational resource illustrates clinical and demographic aspects of Proliferative Vitreoretinopathy (PVR). Panel A shows a color fundus photograph of a human eye with severe PVR, characterized by vitreous opacification, visible epiretinal fibrous proliferation, and radial star folds causing significant retinal distortion. Panel B presents a corresponding B-scan ultrasonogram (diagnostic ultrasound) of the posterior segment, demonstrating high-amplitude echoing from thick preretinal membranes and a characteristic funnel-shaped tractional retinal detachment (closed configuration). Panel C provides a patient demographics table correlating sex, age, and clinical diagnosis (Retinal Detachment [RD], Epiretinal Membrane [ERM], or Macular Hole [MH]) with PVR severity levels (None, Mild, Severe) and exosome particle concentrations. The image serves to teach the correlation between clinical presentation, imaging findings, and laboratory biomarkers in advanced vitreoretinal disease.
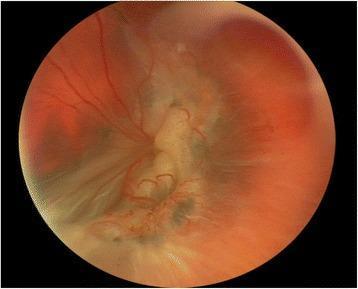
This color fundus photograph of a left eye demonstrates severe ocular pathology, characterized by total retinal detachment and advanced proliferative vitreoretinopathy (PVR). The retinal tissue exhibits a significant loss of normal transparency, appearing opaque, pale, and thickened with prominent corrugations and folds. The normal red-orange fundus reflex is obscured by this elevated, fibrotic tissue. Central and posterior regions show extensive tractional changes and epiretinal membrane contraction, which distort the normal vascular architecture and completely obscure the macula and foveal landmarks. Tortuous retinal vessels are visible on the surface of the detached retina, some showing signs of displacement. The overall clinical picture represents an end-stage manifestation of complex retinal disease, such as X-linked retinoschisis complicated by chronic rhegmatogenous retinal detachment and failed surgical repairs. This image serves as a clinical example of Grade C or D PVR where intraocular scarring has led to profound structural distortion and total detachment.
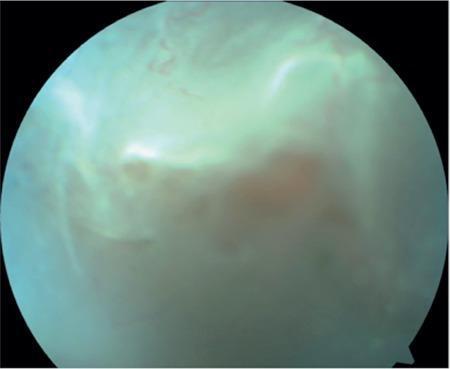
This clinical diagnostic image is a preoperative fundus photograph of the left eye in a patient with Stickler syndrome. The image demonstrates a rhegmatogenous retinal detachment associated with Grade C2 proliferative vitreoretinopathy (PVR). The retinal surface exhibits a hazy, mottled texture with a characteristic bluish-green hue and increased reflectivity, particularly in the superior quadrants, indicative of retinal folds and subretinal fluid accumulation. There is a notable lack of distinct retinal vasculature due to the significant vitreous opacity and membranous changes in the periphery. A central reddish-brown area is visible, suggesting a region of significant retinal thinning or a retinal hole that allows for visualization of the underlying choroidal pigment. The overall appearance captures the chronic nature of the detachment with irregular contours and evidence of contractile PVR membranes that distort the normal anatomical landmarks of the posterior pole.
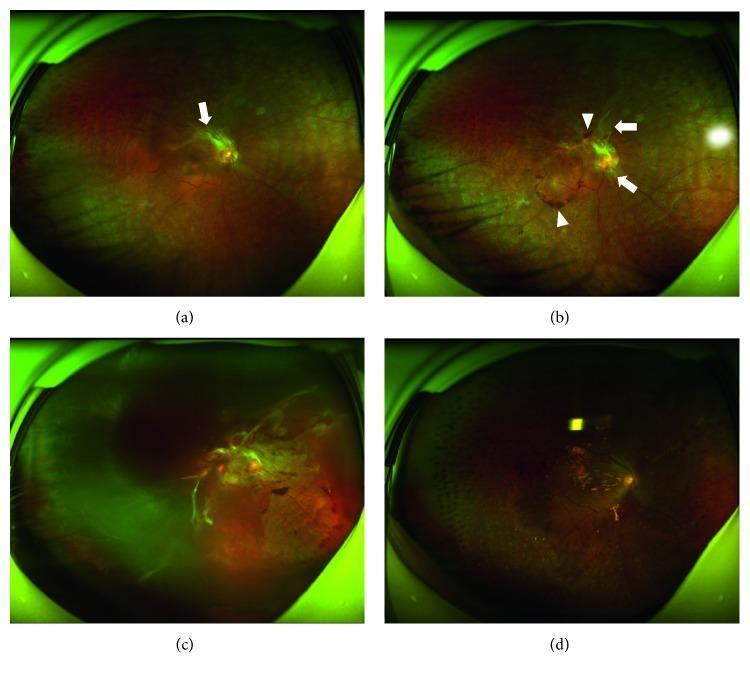
This set of four fundus images (a-d) illustrates the clinical progression of proliferative vitreoretinopathy (PVR) or proliferative diabetic retinopathy over time. Image (a) shows early signs of neovascularization, with fibrovascular proliferation (arrow) near the superior vascular arch. Image (b) demonstrates rapid advancement 4 weeks later, with increased proliferation (arrows) and new retinal hemorrhages (arrowheads). Image (c) displays a severe complication at 9 weeks, characterized by tractional retinal detachment (TRD) and extensive vitreous hemorrhage, obscuring macular details. Image (d) shows the postoperative appearance after vitrectomy, indicating retinal reattachment but significant architectural distortion. The series serves as an educational timeline for medical professionals to identify early vascular proliferation and the catastrophic risks of progression to tractional detachment. Key educational concepts include neovascularization, fibrovascular membranes, vitreoretinal traction, and surgical intervention in advanced retinopathy.
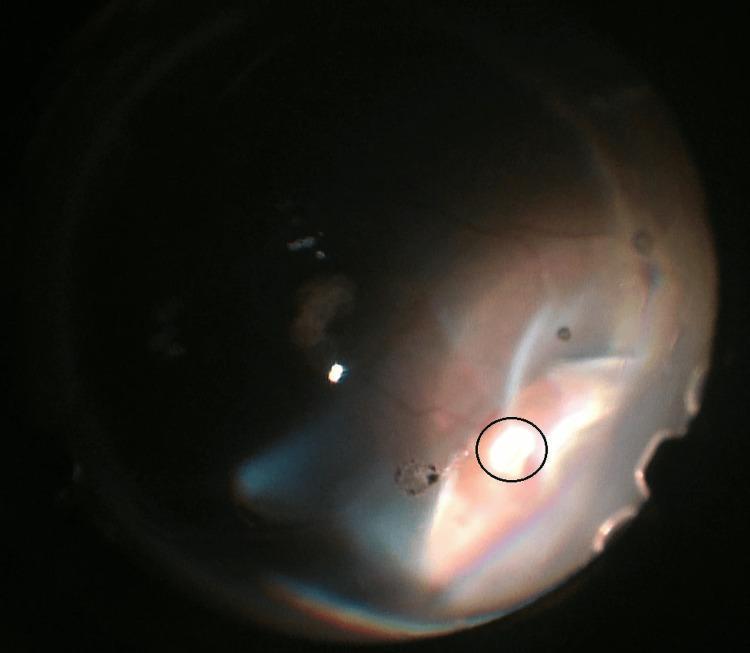
This clinical diagnostic image is an intraoperative fundus photograph demonstrating a rhegmatogenous retinal detachment (RRD) with a significant primary pathology highlighted. Encircled in black is a large, irregularly shaped retinal tear. The defect appears as a well-defined, bright discontinuity in the retinal tissue, revealing the underlying reddish-orange choroid. Associated with this tear is evidence of incarcerated vitreous, appearing as a focal point of traction. The surrounding retina is diffusely pale, opaque, and elevated, characteristic of a bullous retinal detachment. Subtle haziness across the posterior segment suggests subretinal fluid accumulation and mild proliferative vitreoretinopathy (PVR) changes. The imaging illustrates the critical relationship between a full-thickness retinal break and the subsequent development of extensive detachment. This visual is highly relevant for ophthalmology training, specifically in identifying surgical landmarks during pars plana vitrectomy for complex retinal repairs.
Key PVR Fundus Findings
- Panel A (Fundus photo): Severe PVR with vitreous opacification, epiretinal fibrous proliferation, and radial star folds causing retinal distortion
- Panel B (B-scan ultrasound): High-amplitude echoes from thick preretinal membranes and funnel-shaped tractional retinal detachment (closed configuration)
- Panel C: Clinical correlation with PVR severity grades and biomarkers
- Opaque, pale, thickened retinal tissue with prominent corrugations and folds
- Loss of normal red-orange fundus reflex
- Extensive tractional changes and epiretinal membrane contraction
- Tortuous, displaced retinal vessels
- Complete obscuration of macula and foveal landmarks
- Bluish-green hue and increased reflectivity indicating retinal folds
- Subretinal fluid accumulation
- Mottled texture from membranous changes
- Central reddish-brown area showing retinal thinning/hole
- Chronic detachment with irregular contours from contractile PVR membranes
- A: Early vitreous haze and opacity
- B: Post-vitrectomy with retinal necrosis and vascular occlusion
- C: Severe inferior detachment with extensive PVR and tractional bands
- D: Postoperative reattachment after second vitrectomy with residual proliferation
Give me drawn diagram for grade c A pVR changes on fundus chart
Fundus diagram showing Grade C-A PVR (proliferative vitreoretinopathy) changes. Draw a circular fundus chart with: posterior pole in center showing macula and optic disc, equatorial and peripheral zones. Grade C-A PVR features include: epiretinal membrane with radial retinal folds, star folds radiating outward, mild vitreous haze, retinal corrugations, some tractional changes in peripheral retina, distorted vasculature, subretinal fluid accumulation areas. Use color to distinguish normal retina (red-orange), detached areas (pale/gray), PVR membranes (white/gray), and retinal folds (darker lines). Label key structures and PVR features clearly.
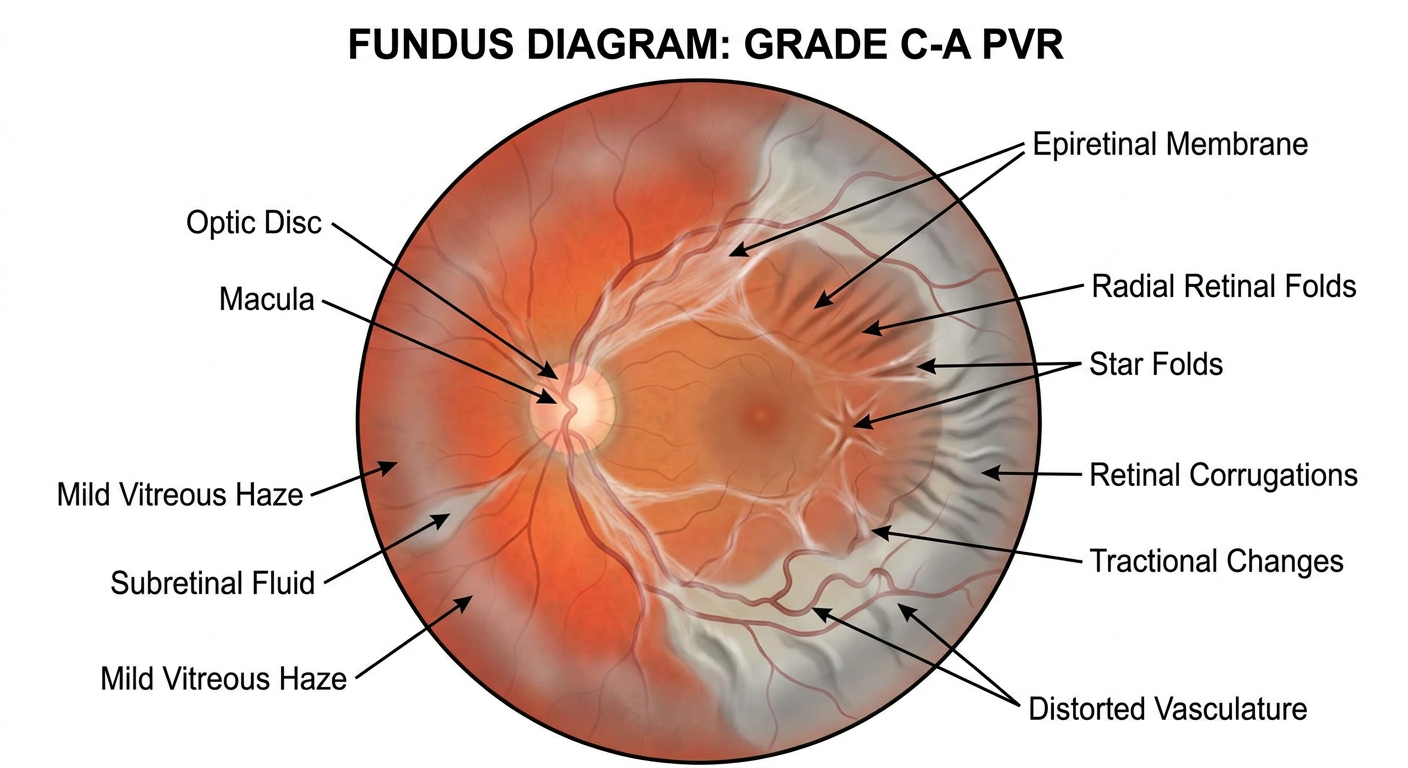
- Optic disc - landmark in superior nasal quadrant
- Macula - central posterior pole
- Epiretinal membrane - translucent fibrous layer over retina (gray overlay)
- Radial retinal folds - spoke-like corrugations radiating from center outward
- Star folds - concentrated folds in specific quadrants creating geometric pattern
- Vitreous haze - mild opacity reducing clarity
- Retinal corrugations - wavy surface texture from membrane contraction
- Distorted vasculature - vessels pushed and distorted by traction
- Mild tractional changes - peripheral retina showing early contractile changes
- Color differentiation:
- Red-orange = normal attached retina
- Pale gray = areas of mild detachment/thinning
- White/light gray = PVR membranes
- Dark lines = retinal folds and creases
Draw me diagram of Total RD with disc hazily seen with PVR changes grade C - A on amsler dubois chart
Amsler Dubois fundus chart diagram showing Total Retinal Detachment with Grade C-A PVR changes. Draw circular fundus chart divided into quadrants (superior nasal, superior temporal, inferior nasal, inferior temporal). Show: completely detached pale gray retina covering entire posterior pole, optic disc hazily visible through haze and membranes in superior nasal quadrant (appearing faint/obscured), extensive Grade C-A PVR features including epiretinal membranes with prominent radial star folds radiating in multiple directions, retinal corrugations and creases, white/translucent contractile membranes visible over retina surface, distorted tortuous retinal vessels, vitreous opacification creating diffuse haze, subretinal fluid accumulation throughout, no normal red-orange fundus reflex visible. Use pale gray/white for detached retina, darker gray for membranes, faint outline for hazy disc, label quadrants and key structures clearly on Amsler grid format.
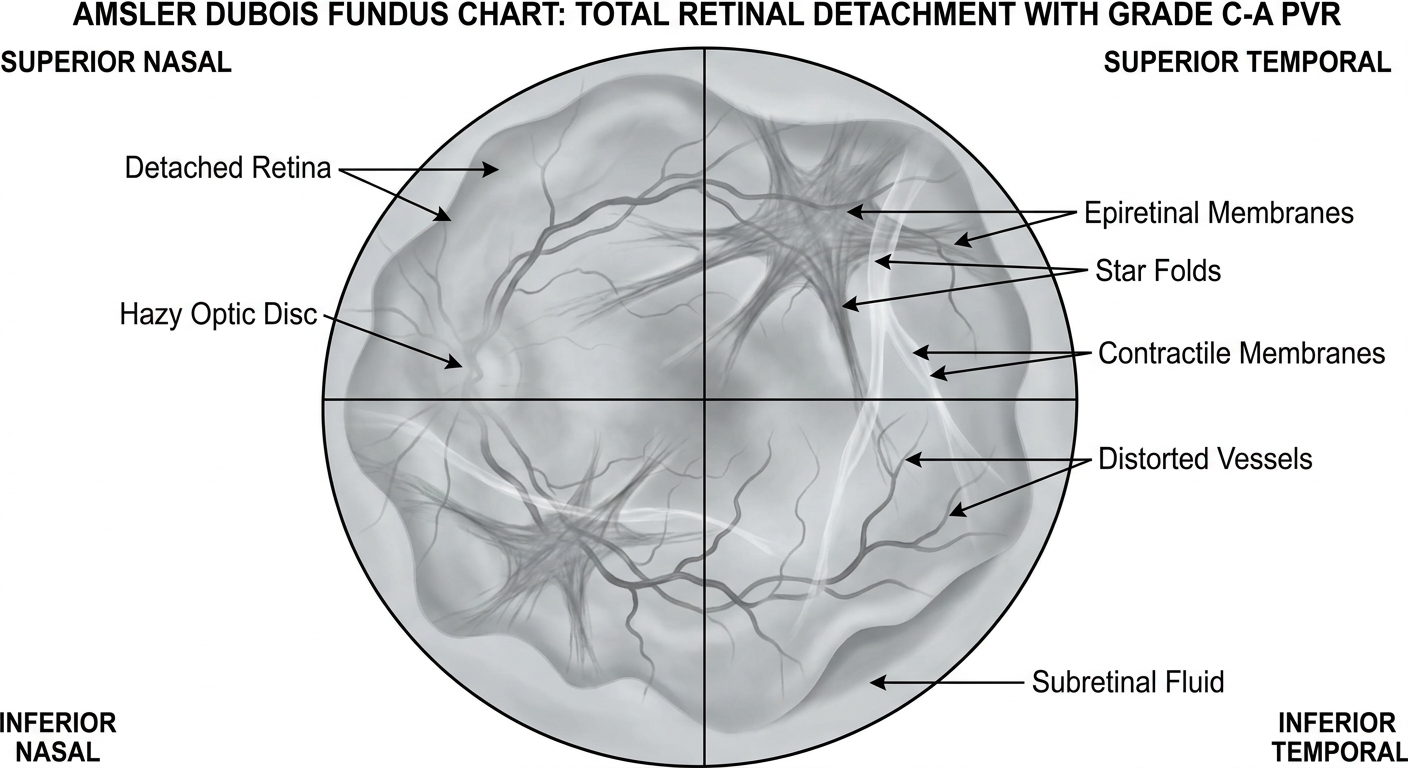
- Total retinal detachment - entire retina elevated and pale gray throughout all quadrants
- Loss of red-orange reflex - opacified pale appearance due to subretinal fluid accumulation
- Optic disc hazily seen - faintly visible in superior nasal quadrant, obscured by vitreous haze and PVR membranes
- Epiretinal membranes - white/translucent fibrous layers covering retinal surface
- Radial star folds - prominent spoke-like creases radiating from posterior pole outward
- Retinal corrugations - wavy, wrinkled surface texture from membrane contraction
- Circumscribed distribution - PVR changes primarily anterior to equator (C classification)
- Vitreous haze - diffuse opacity reducing fundus visibility
- Distorted vasculature - tortuous, displaced retinal vessels pushed by tractional forces
- Corrugated appearance - characteristic pattern of contractile membrane activity
- Superior Nasal (SN) - includes hazy optic disc
- Superior Temporal (ST)
- Inferior Nasal (IN)
- Inferior Temporal (IT)
Use proper color coding according to amsler dubois chart
Amsler Dubois fundus chart with proper color coding for Total Retinal Detachment with Grade C-A PVR. Draw circular fundus divided into 4 quadrants (superior nasal, superior temporal, inferior nasal, inferior temporal). Use Amsler Dubois standard colors: pale yellowish-gray for completely detached retina throughout all quadrants, optic disc location in superior nasal quadrant shown as faint pale circle with haziness obscuring it, white/light gray epiretinal membranes with radial star folds creating spoke patterns, darker gray areas for PVR contractile membranes, retinal vessel distortion with tortuous paths, macula area in center showing elevation and pallor, vitreous haze depicted as diffuse gray overlay. Quadrant borders clearly marked. Label: Optic Disc (faintly), Macula, Superior Nasal, Superior Temporal, Inferior Nasal, Inferior Temporal, PVR membranes, Retinal folds, and indicate Grade C-A classification.
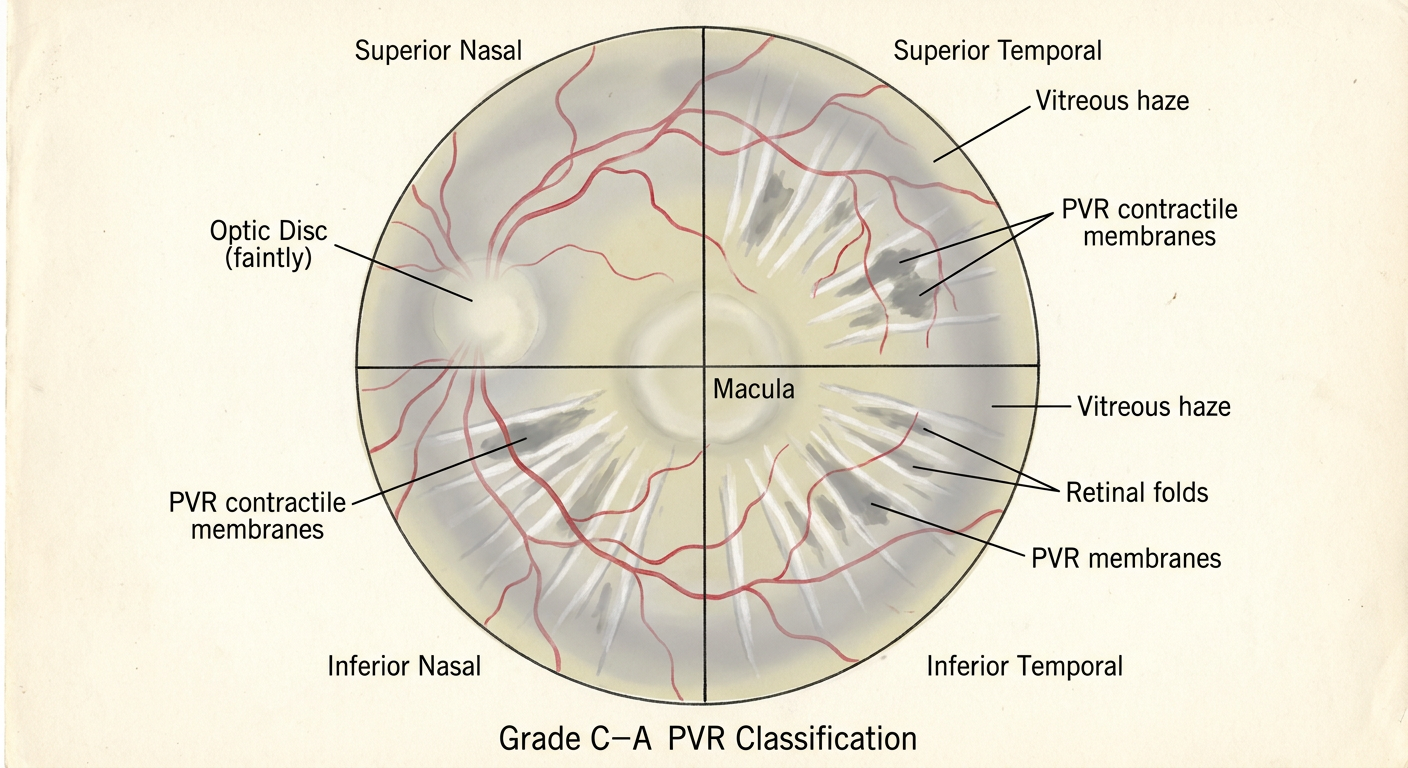
- Complete elevation of neurosensory retina in all quadrants
- Optic disc hazily visible as faint pale circle in superior nasal quadrant
- Loss of normal red-orange fundus reflex
- Macular area shows central elevation with pallor
- White/light gray membranes - epiretinal fibrotic proliferation
- Radial star folds - spoke-like retinal creases radiating outward from macula
- Darker gray zones - contractile PVR membranes showing anterior circumscribed distribution
- Distorted vasculature - tortuous retinal vessels displaced by tractional forces
- Superior Nasal (SN) - Contains hazy optic disc, PVR membrane involvement
- Superior Temporal (ST) - Detached retina with fold patterns
- Inferior Nasal (IN) - Elevated pale retina with corrugations
- Inferior Temporal (IT) - Complete detachment with visible folds
No this is not standard chart. Help me with standard chartand color coding
Amsler Dubois chart standard color coding quadrants fundus diagram
Amsler Dubois fundus chart standard template quadrants color
https://pmc.ncbi.nlm.nih.gov/articles/PMC9675514
- Red = Blood vessels, hemorrhages
- Blue = Retinal edema, vitreous haze
- Yellow = Detached retina, intraretinal edema, subretinal deposits
- Brown = RPE, uveal tissue, pigment beneath detached retina, chorioretinal atrophy
- Green = Retinal breaks, holes, tears
- Black = Outlines, atrophic scars, buckle edges
Standard Amsler Dubois fundus chart for Total Retinal Detachment with Grade C-A PVR. Draw three concentric circles (inner=equator, middle=ora serrata, outer=pars plana junction). Optic disc as small circle nasal to center macula. Four quadrants marked with Roman numerals (I-IV). Color coding: YELLOW for completely detached retina throughout all quadrants, BLUE for vitreous haze and opacity obscuring disc, WHITE/LIGHT GRAY epiretinal membranes with radial star folds, RED for distorted tortuous retinal blood vessels, BROWN for pigment epithelium and choroidal details beneath detached retina, GREEN for retinal breaks/folds edges. Optic disc shown faintly hazily visible. Macula area elevated and pale yellow. Grade C-A PVR classification labeled. Include quadrant markers (I superior temporal, II superior nasal, III inferior nasal, IV inferior temporal). Label: Optic Disc (faint), Macula, Detached Retina (yellow), PVR Membranes, Retinal Folds.
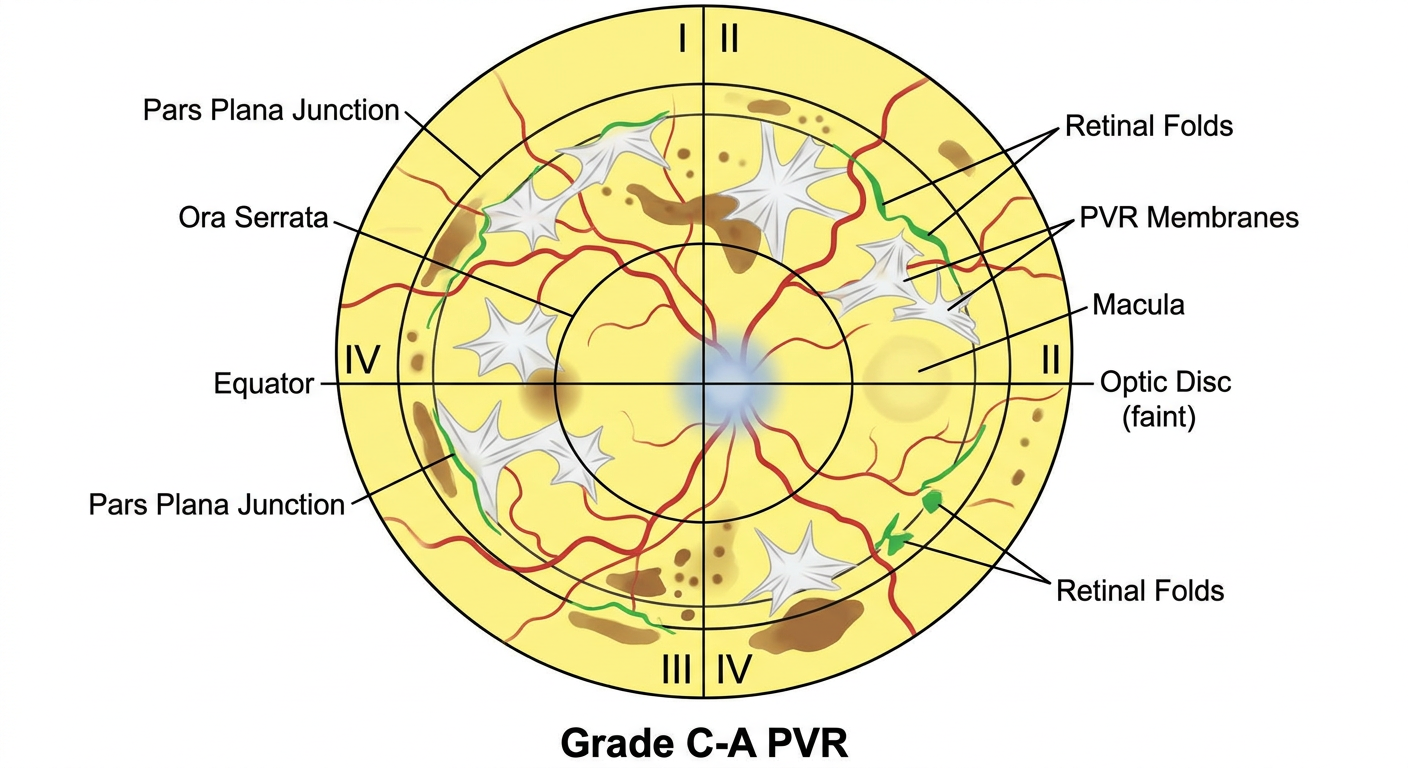
- YELLOW - Completely detached neurosensory retina throughout all quadrants
- BLUE - Vitreous haze and opacity obscuring the optic disc hazily
- RED - Distorted tortuous retinal blood vessels displaced by PVR traction
- BROWN - RPE and pigment beneath detached retina, choroidal details
- GREEN - Retinal fold edges and breaks
- WHITE/LIGHT GRAY - Epiretinal PVR membranes and radial star folds
- Three concentric circles:
- Inner = Equator
- Middle = Ora serrata
- Outer = Pars plana/pars plicata junction
- Quadrants marked (I-IV with Roman numerals)
- Optic disc - shown hazily visible in nasal quadrant
- Macula - central area, elevated and pale from complete detachment
- Radial star folds radiating from posterior pole
- Anterior circumscribed membrane involvement (C classification)
- Retinal corrugations and contractile changes
- Partial posterior involvement (-A indicates early posterior extension)
Vladimir thaller ka ek article hai on magic sutures vo mujhe clear aur crisp krke samjhao
Vladimir Thaller "Magic sutures" article
retinal detachment suture technique
https://pmc.ncbi.nlm.nih.gov/articles/PMC8452743/
PMID: 32963313
Core idea
Aisa defect jo pehle wide aur difficult closure jaisa lag raha tha, suture tighten karne par narrow ho jata hai aur direct closure possible ho sakta hai.
- flap/graft ki zarurat kam ho sakti hai
- single-stage reconstruction possible hota hai
- operation time aur additional scars kam ho sakte hain
Isko “magic” kyun kehte hain?
Technique ko simple visualization mein samjho
- Wound base se suture start hota hai.
- Suture deep tissue aur orbicularis muscle se pass karke subcutaneous plane mein aata hai.
- Wahi plane mein suture wound ke across le jaya jata hai.
- Opposite side par subcutaneous plane aur muscle se wapas wound base mein nikalta hai.
- Knot tie aur bury kiya jata hai.
Conventional suture vs Magic suture
| Feature | Conventional deep suture | Magic suture |
|---|---|---|
| Direction | Defect ke short axis ke parallel | Nearest lid-margin tangent ke parallel |
| Main effect | Wound edges ko approximate karta hai | Defect geometry ko reshape karke narrow karta hai |
| Tension vector | Wound geometry-based | Lid-margin safety-based |
| Scar orientation | Variable | Usually lid margin ke perpendicular |
Important clinical principle
- Eye protection
- Eyelid function: blink, closure, lid position
- Cosmetic contour
One-line exam answer
POSAS scoring system ke compenents ko kaise assess karenge vo mujhe short aur crisp way mein samjhao
"Patient and Observer Scar Assessment Scale"
POSAS 3.0 observer patient scale components assessment official
Scar ko 2 angles se assess karte hain: patient kya feel karta hai and doctor ko scar kaisa dikhta/feel hota hai.
1. Patient Scale: patient se poochho
- Pain: scar mein dard?
- Itch: khujli?
- Colour: normal surrounding skin ke comparison mein colour abnormal?
- Stiffness: tight ya hard lagta hai?
- Thickness: scar mota/raised lagta hai?
- Irregularity: surface uneven, ugly ya abnormal lagti hai?
End mein patient ka overall opinion bhi 1-10.
2. Observer Scale: clinician dekhe aur palpate kare
- Vascularity: red/pink/purple kitna hai?
- Pigmentation: hypo- ya hyperpigmented hai?
- Thickness: raised/depressed kitna hai? Palpate karein.
- Relief: surface smooth hai ya elevated/depressed/uneven?
- Pliability: pinch karke dekhein, soft/mobile hai ya stiff/adherent?
- Surface area: original wound area ke comparison mein scar area kitna hai?
Yaad rakhne ka shortcut
- Patient: Pain, Itch, Colour, Stiffness, Thickness, Irregularity
- Observer: Vascularity, Pigmentation, Thickness, Relief, Pliability, Surface area