

Patient having severe lower limb cramps male patient age 35yrs vitals stable no chest pain what could be the diagnosis
hypokalemia ECG changes prominent U wave flattened T wave
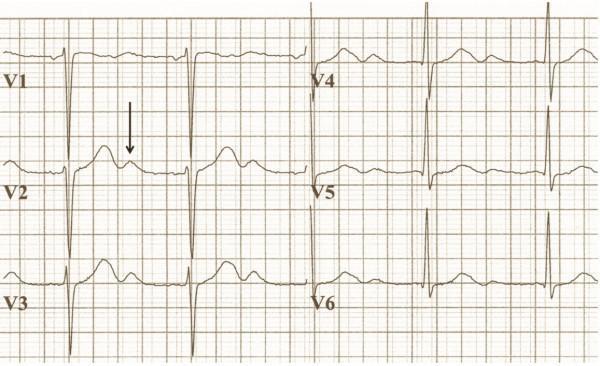
This diagnostic image is a 6-lead electrocardiogram (ECG) trace focusing on the precordial leads (V1-V6). The tracing demonstrates classic features associated with hypokalemia, specifically in a clinical context of a 2.7 mM/l potassium level. In leads V1, V2, and V3, there is visible ST-segment depression and a reduction in T-wave amplitude. A prominent, marked U-wave is indicated by a black arrow in lead V2, following the T-wave. The right precordial leads (V4-V6) show tall R-waves with high voltage, meeting the voltage criteria for left ventricular hypertrophy (LVH). The combination of high-amplitude QRS complexes and the characteristic repolarization abnormalities (U-waves, ST depression, and flattened T-waves) provides a key educational example of how electrolyte imbalances and structural heart changes manifest on a standard ECG. This is an intermediate-level resource for cardiology and internal medicine training, illustrating the diagnostic findings of severe hypokalemia and hypertensive heart disease morphology.
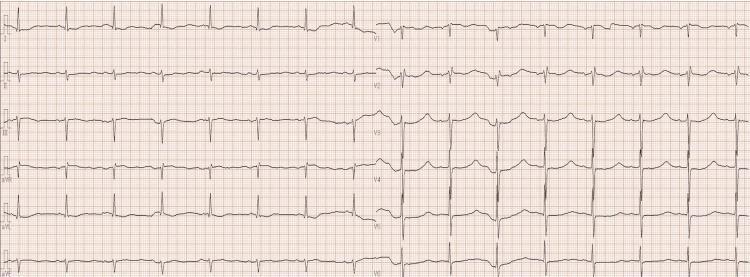
This diagnostic image is a 12-lead electrocardiogram (ECG) recorded on standard grid paper. The tracing demonstrates hallmark visual findings associated with severe hypokalemia. Key electrocardiographic features include significant T-wave flattening across multiple leads, most notably in leads I, II, aVF, V5, and V6, where the T-waves appear almost isoelectric. There is a corresponding appearance of prominent, positive U-waves, which are particularly distinct in the precordial leads V3 through V6. In these leads, the U-wave amplitude is nearly equal to or exceeds the amplitude of the preceding flattened T-wave, creating a characteristic 'camel-hump' morphology or a false impression of a prolonged QT interval (often referred to as a QU interval). The rhythm is sinus, and the primary educational focus is the recognition of electrolyte-induced repolarization abnormalities. This ECG is clinically significant for identifying severe potassium depletion, such as that caused by diuretic use or pseudo-aldosteronism.
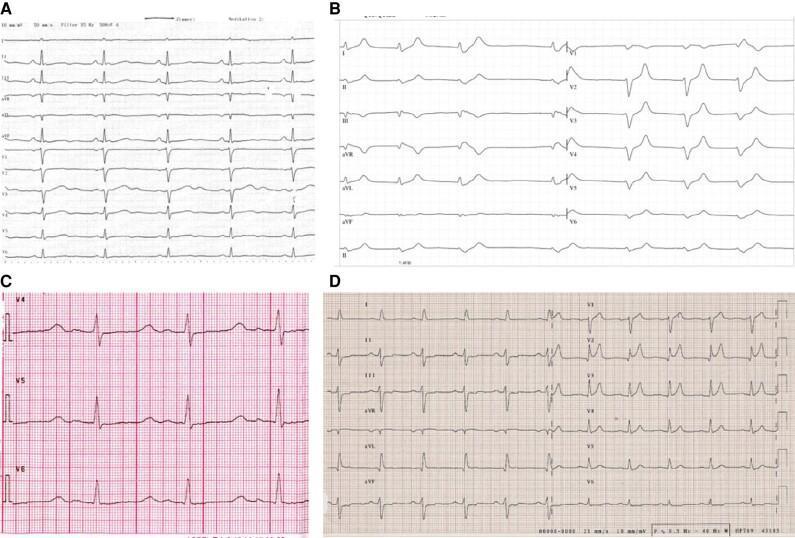
This diagnostic graphic illustrates various electrocardiogram (ECG) manifestations of electrolyte disturbances across four panels. Panel A demonstrates hypokalemia, characterized by flattened T waves and prominent U waves, which can lead to a pseudoprolonged QT interval. Panel B shows hyperkalemia, highlighted by classic tall, peaked 'tented' T waves and narrow QRS complexes. Panel C displays hypocalcemia, primarily showing a prolongation of the ST segment leading to a lengthened QT interval while T wave morphology remains relatively preserved. Panel D represents hypercalcemia, which is characterized by a shortened ST segment and a correspondingly shortened QT interval. The collection serves as an educational comparison chart for clinicians and medical students to recognize pathognomonic rhythm strip changes associated with potassium and calcium imbalances. Key educational concepts include repolarization abnormalities, interval duration changes, and the visual differentiation of metabolic derangements in a clinical cardiology context.
ECG Analysis + Differential Diagnosis
What the ECG Shows
- Regular sinus rhythm with P waves preceding each QRS
- Prominent, broad U waves visible in precordial leads (V1-V6) - the most striking finding
- Flattened or low-amplitude T waves in multiple leads
- ST-segment depression in precordial leads
- Apparent prolonged QU interval (T and U waves merging, giving the appearance of a long QT)
- QRS morphology preserved - no bundle branch block
- No significant ST elevation, no Q waves of infarction
Primary Diagnosis: Hypokalemia (Low Serum Potassium)
| Feature | This Patient |
|---|---|
| Age/Sex | 35M - working age, high risk for GI losses |
| Symptom | Severe lower limb cramps |
| Vitals | Stable |
| No chest pain | Rules against ACS |
| ECG | Prominent U waves, flat T waves, ST depression |
How Hypokalemia Causes Muscle Cramps
"Fatigue, myalgias, and muscular weakness or cramps of the lower extremities are common. Smooth muscle function may also be affected... Severe hypokalemia may lead to complete paralysis, hypoventilation, or rhabdomyolysis."
ECG Changes in Hypokalemia (Reference)
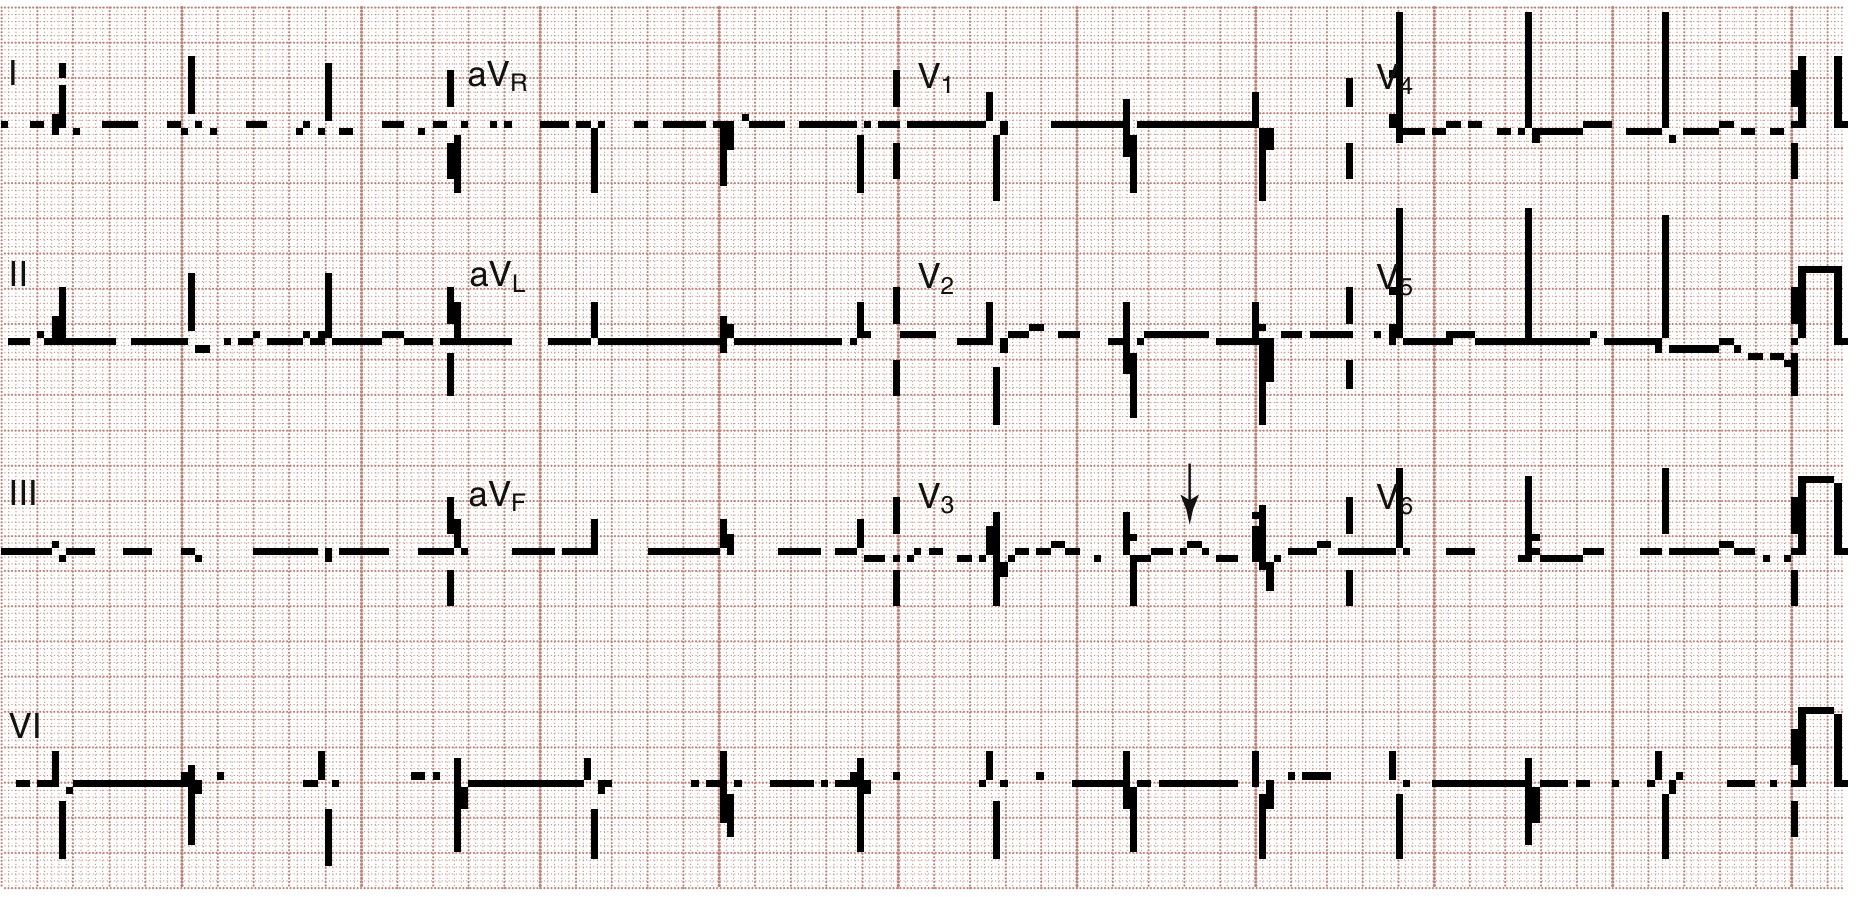
"ECG changes associated with hypokalemia include flattening or inversion of the T wave, a prominent U wave, ST-segment depression, and a prolonged QU interval. Severe K+ depletion may result in a prolonged PR interval, decreased voltage, and widening of the QRS complex."
Differential Diagnoses to Consider
| Diagnosis | For | Against |
|---|---|---|
| Hypokalemia | ECG classic pattern, lower limb cramps, stable vitals | - |
| Hypomagnesemia | Can cause cramps + similar ECG; often co-exists | Usually accompanies hypokalemia, not sole cause |
| Hypocalcemia | Cramps/tetany, prolonged QT | QT prolongation without U waves; Chvostek/Trousseau signs expected |
| Peripheral arterial disease | Leg cramps | Age 35, no chest pain, no claudication pattern described |
| ACS (NSTEMI) | ST depression on ECG | No chest pain, stable vitals, cramps > ischemia pattern |
| Rhabdomyolysis | Severe muscle symptoms | Would expect pain, dark urine, elevated CK |
Immediate Workup Required
- Serum electrolytes STAT - K+, Mg2+, Na+, Cl-, Ca2+ (hypomagnesemia often accompanies and perpetuates hypokalemia)
- Serum creatinine + BUN - rule out renal cause
- ABG or venous blood gas - acid-base status (metabolic alkalosis points to GI loss/diuretics)
- Spot urine K+ - <15 mEq/L = appropriate conservation (extra-renal loss); >25 mEq/L = renal wasting
- CK level - if rhabdomyolysis suspected
- Blood glucose - exclude DKA (can cause hypokalemia via acidosis)
- Continuous cardiac monitoring - until K+ corrected (risk of ventricular arrhythmia)
Common Causes to Investigate in This 35-Year-Old
- GI losses: vomiting, diarrhea, laxative abuse
- Diuretic use (thiazide, loop diuretics)
- Poor oral intake / prolonged fasting
- Excessive sweating (heat exposure, heavy labor)
- Primary hyperaldosteronism (especially if hypertensive)
- Refeeding syndrome
- Alcoholism
Management
- Oral KCl if mild-moderate (K+ 2.5-3.5 mEq/L) and patient can tolerate PO - 40 mEq every 4 hours
- IV KCl if severe (<2.5 mEq/L), symptomatic arrhythmia, or unable to take PO
- Max 40 mEq/L peripheral vein; max rate 10-20 mEq/hr
- Correct hypomagnesemia simultaneously - hypokalemia is refractory to replacement without Mg2+ correction
- Monitor ECG continuously during IV replacement
- Treat the underlying cause
Washington Manual of Medical Therapeutics - "Hypomagnesemia should also be sought in all hypokalemic patients and corrected to allow effective K+ repletion."