
Explain glycogenlolysis in simle way
glycogenolysis pathway diagram
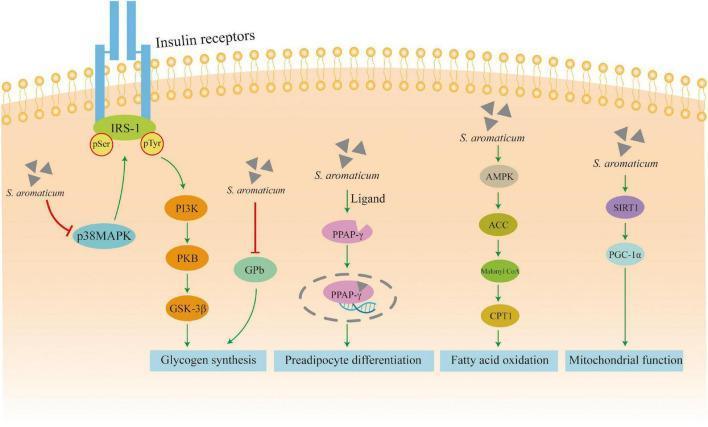
This pathophysiology diagram illustrates the metabolic signaling pathways influenced by Syzygium aromaticum (clove) in the context of hypoglycemic activity and type 2 diabetes management. The diagram depicts five primary intracellular cascades: 1) Insulin signaling: S. aromaticum inhibits p38MAPK (reducing IRS-1 pSer) and promotes IRS-1 pTyr, activating the PI3K/PKB/GSK-3β pathway to increase glycogen synthesis. 2) Glycogenolysis inhibition: Direct inhibition of glycogen phosphorylase b (GPb). 3) Adipogenesis: S. aromaticum acts as a ligand for PPAR-̳, translocating it to the nucleus to regulate preadipocyte differentiation. 4) Lipid metabolism: Activation of the AMPK/ACC pathway leads to Malonyl CoA production and CPT1 activation, promoting fatty acid oxidation. 5) Mitochondrial biogenesis: Activation of the SIRT1/PGC-1̱ pathway to enhance mitochondrial function. The visual uses standard signaling conventions, including green arrows for activation and red T-bars for inhibition, to describe pharmacological mechanisms at the molecular level.
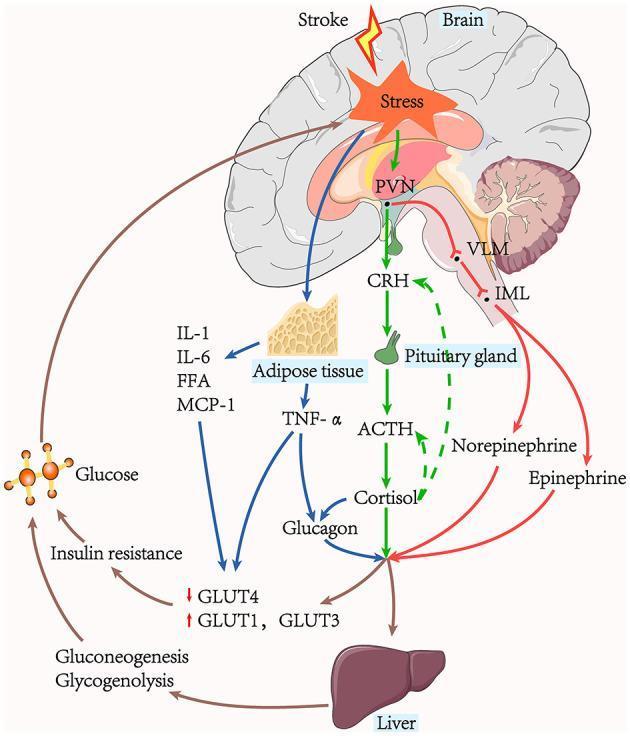
This pathophysiology diagram illustrates the complex physiological pathways leading to stress-induced hyperglycaemia (SIH) following an acute ischaemic stroke. The flowchart details two primary neuroendocrine axes: the Hypothalamic-Pituitary-Adrenal (HPA) axis and the sympathoadrenal system. Originating from the paraventricular nucleus (PVN) in the brain, the HPA axis triggers the release of Corticotropin-Releasing Hormone (CRH), stimulating the pituitary gland to release Adrenocorticotropic Hormone (ACTH), which results in cortisol production. Simultaneously, the neural pathway via the Ventrolateral Medulla (VLM) and Intermediolateral nucleus (IML) leads to the release of norepinephrine and epinephrine. These hormones, along with glucagon (stimulated by cortisol and TNF-α from adipose tissue), act on the liver to promote hepatic gluconeogenesis and glycogenolysis. The resulting elevated blood glucose contributes to insulin resistance, characterized by decreased GLUT4 and increased GLUT1 and GLUT3 expression. The diagram highlights a 'vicious cycle' where hyperglycaemia and pro-inflammatory factors (IL-1, IL-6, FFA, MCP-1) further exacerbate the initial brain stress response. This resource is suitable for medical education regarding metabolic complications in critical care and neurology.
What is Glycogenolysis?
Why Does It Happen?
- Blood sugar drops (fasting, between meals)
- You need sudden energy (exercise, fight-or-flight)
- Stress hormones are released
- Glucagon - released by the pancreas when blood glucose is low
- Epinephrine (adrenaline) - released during stress/exercise
The Simple Steps
This is like snipping beads off a necklace, one at a time, from the end.
- Transfer 3 units to another chain (4:4 transferase activity)
- Release the last branch unit as free glucose
- Glucose-1-phosphate → Glucose-6-phosphate (via phosphoglucomutase)
- In the liver: Glucose-6-phosphatase removes the phosphate → free glucose is released into the blood
- In muscle: No phosphatase, so glucose-6-phosphate goes straight into glycolysis for local energy
Visual Pathway
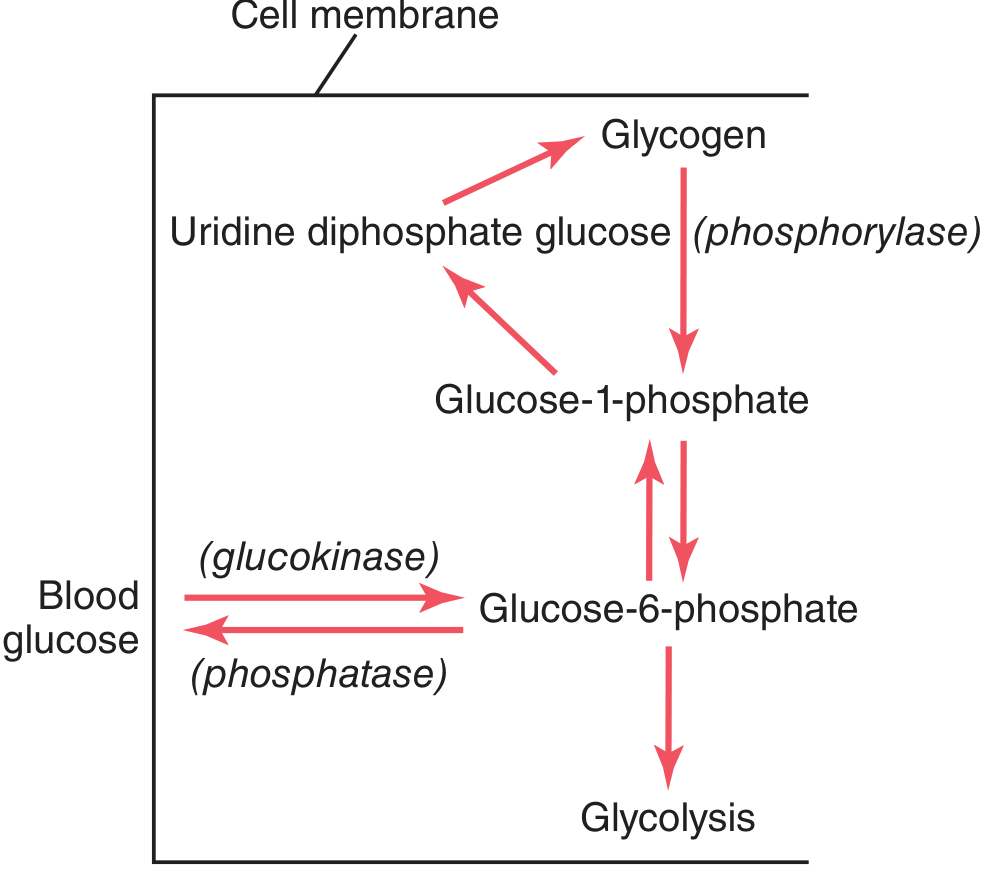
Detailed Breakdown Diagram
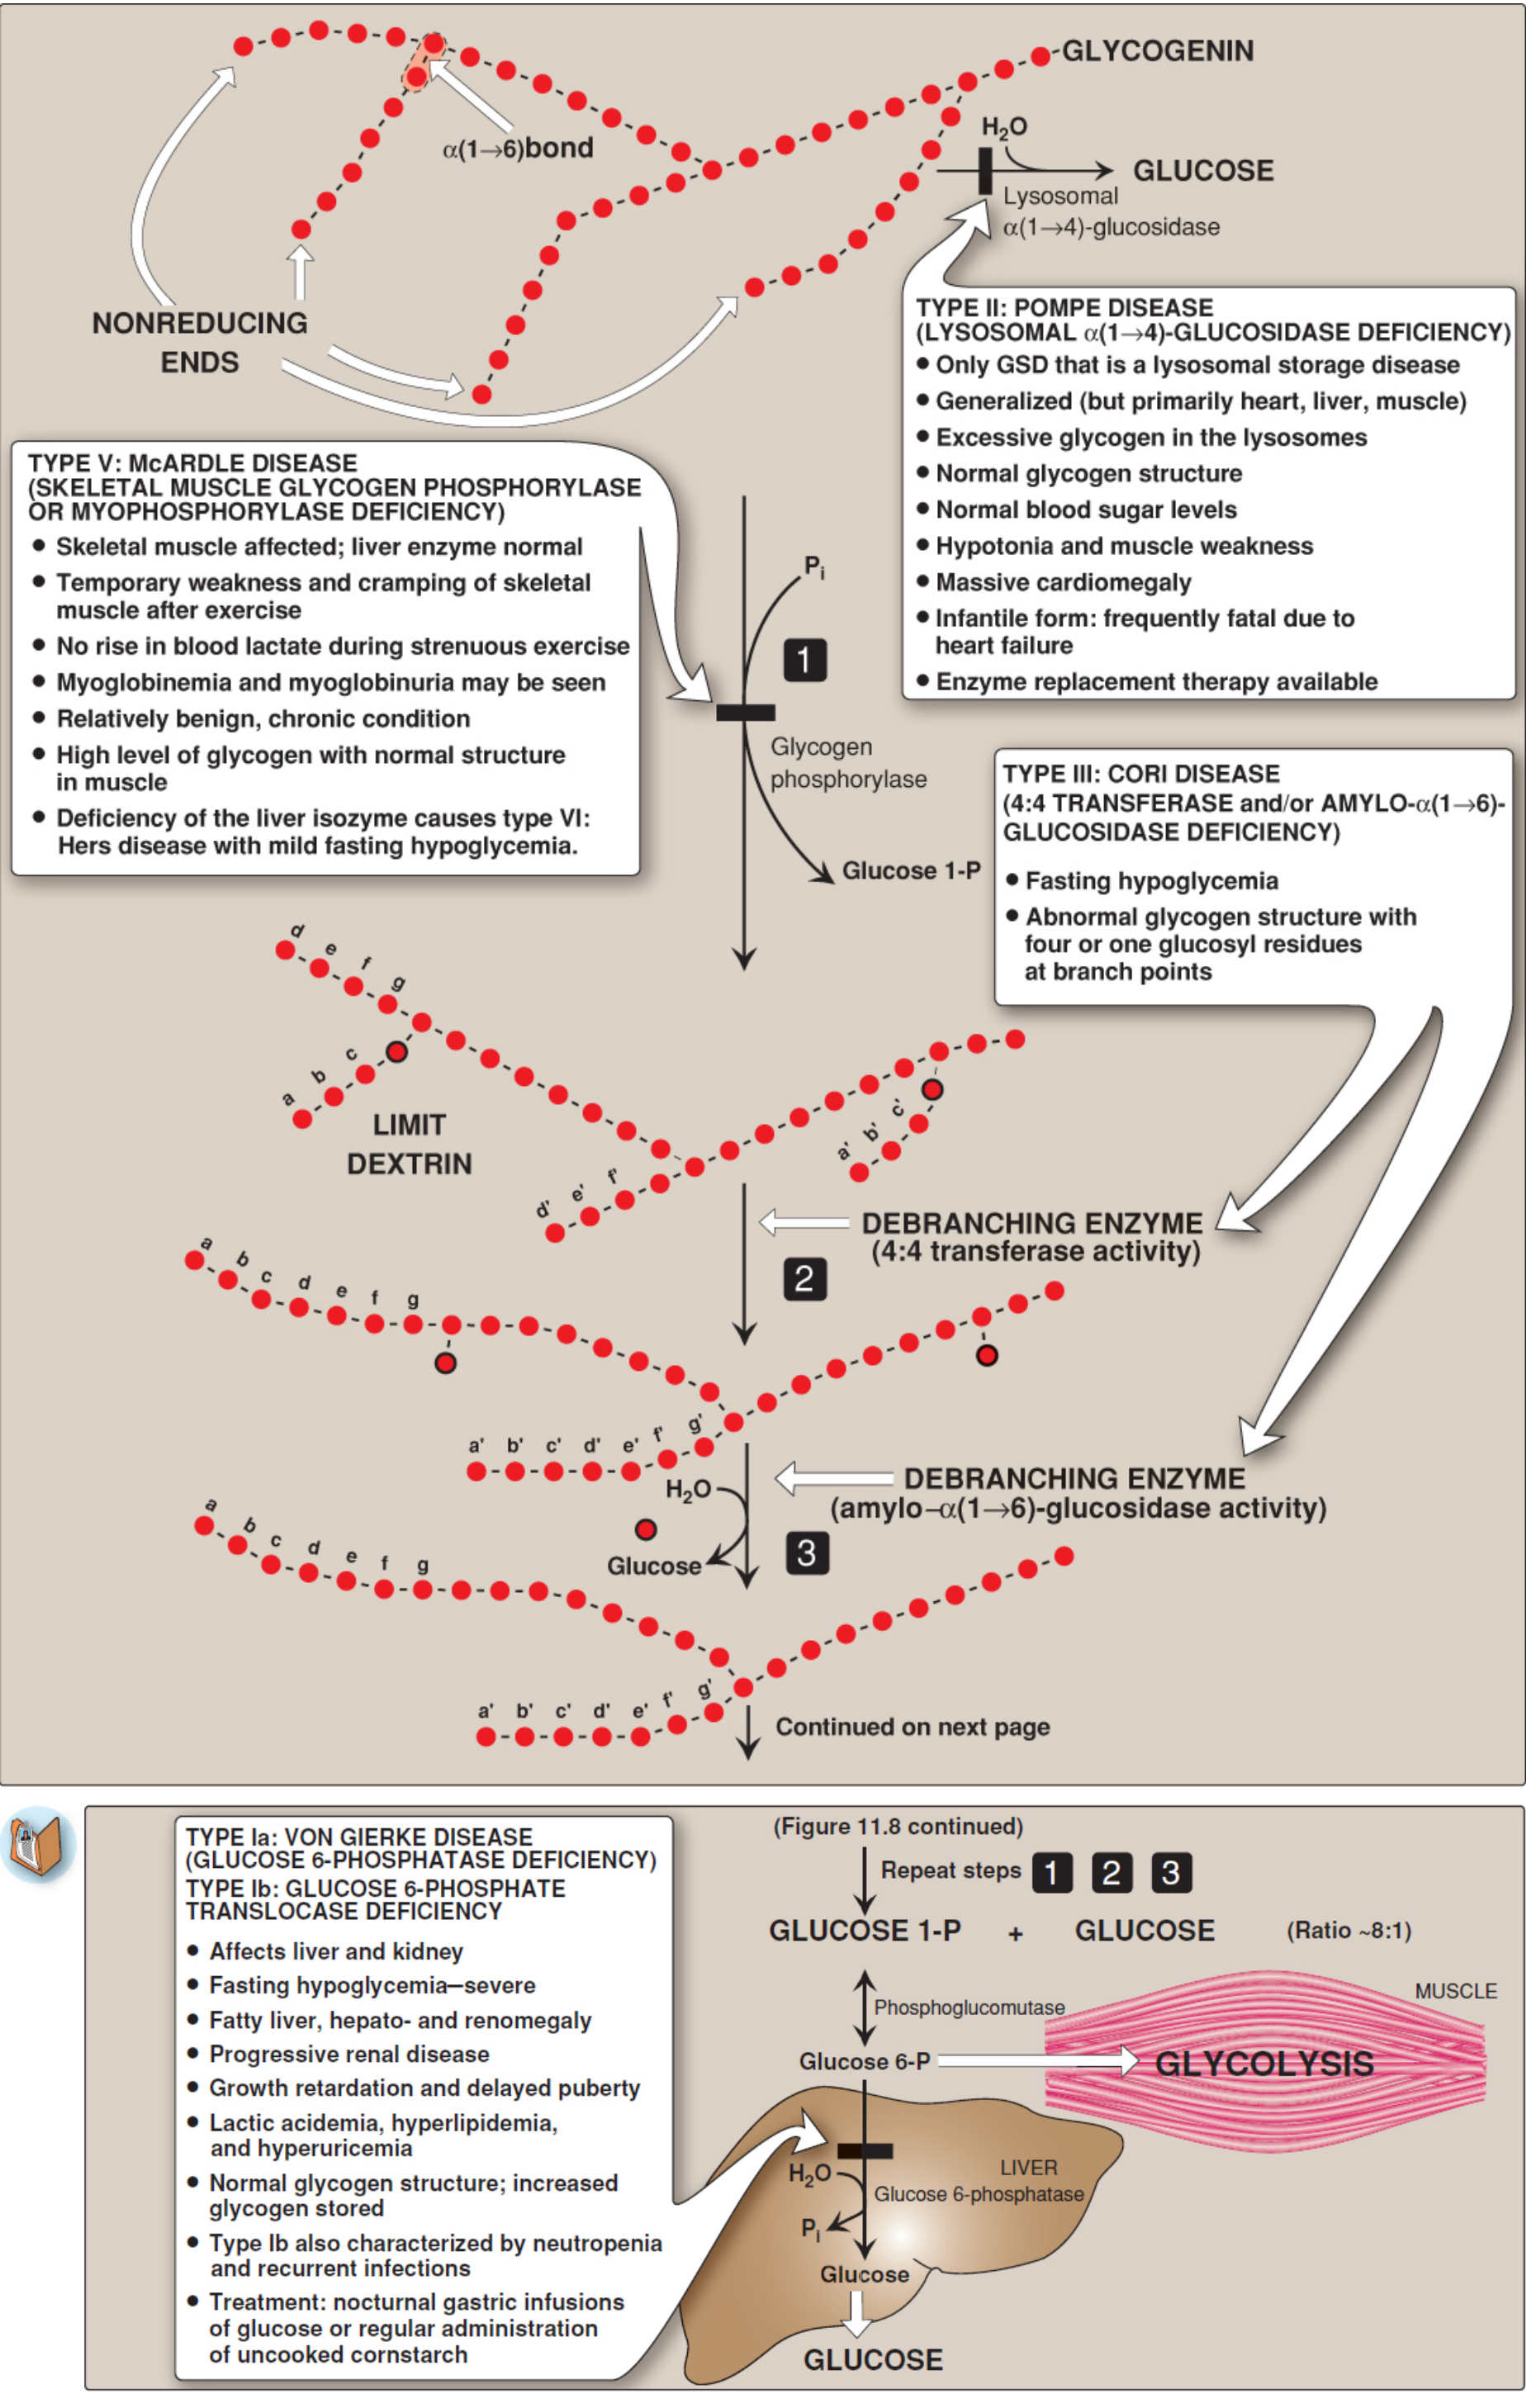
Liver vs. Muscle - Key Difference
| Feature | Liver | Muscle |
|---|---|---|
| Purpose | Maintain blood glucose | Fuel local muscle work |
| Has glucose-6-phosphatase? | Yes - releases free glucose into blood | No |
| End product | Free glucose → bloodstream | Glucose-6-P → glycolysis |
Key Enzymes at a Glance
| Enzyme | Job |
|---|---|
| Glycogen phosphorylase | Clips glucose from chains (needs Vitamin B6) |
| Debranching enzyme | Removes branch points |
| Phosphoglucomutase | Converts Glucose-1-P to Glucose-6-P |
| Glucose-6-phosphatase | Releases free glucose (liver only) |
Quick Memory Hook
"Hungry? Glucagon calls phosphorylase, which chews the glycogen tree from the tips to the trunk, handing glucose to the blood (liver) or muscles."
- Guyton and Hall Textbook of Medical Physiology, p. 834
- Lippincott Illustrated Reviews: Biochemistry, 8th ed., p. 382-384