
How read ecg with images and details interpretation.
Reading File
Now let me search the medical library for ECG interpretation content, including images.
Finding Sources
Finding Sources
Finding Sources
Finding Sources
Reading File
Finding Sources
Reading File
Reading File
Reading File
Finding Sources
Now I have the image URLs from Harrison's. Let me get more content and fetch the key ECG images.
Reading File
Reading File
Reading File
Reading File
Reading File
Reading File
I now have comprehensive content from Harrison's. Let me fetch the key ECG images to display them.
Loading Image
Loading Image
Loading Image
Loading Image
Loading Image
Loading Image
Loading Image
Excellent! I now have all the key images and comprehensive content from Harrison's Principles of Internal Medicine. Let me compile the complete ECG interpretation guide.
How to Read an ECG - A Complete Systematic Guide
Source: Harrison's Principles of Internal Medicine 22E (2025), Guyton & Hall Medical Physiology, Goldman-Cecil Medicine
Part 1: Understanding What an ECG Measures
The ECG records electrical potentials generated when depolarization and repolarization waves travel through the heart. Electrodes placed on the skin detect these tiny currents and plot them as waveforms over time.
The Cardiac Conduction System
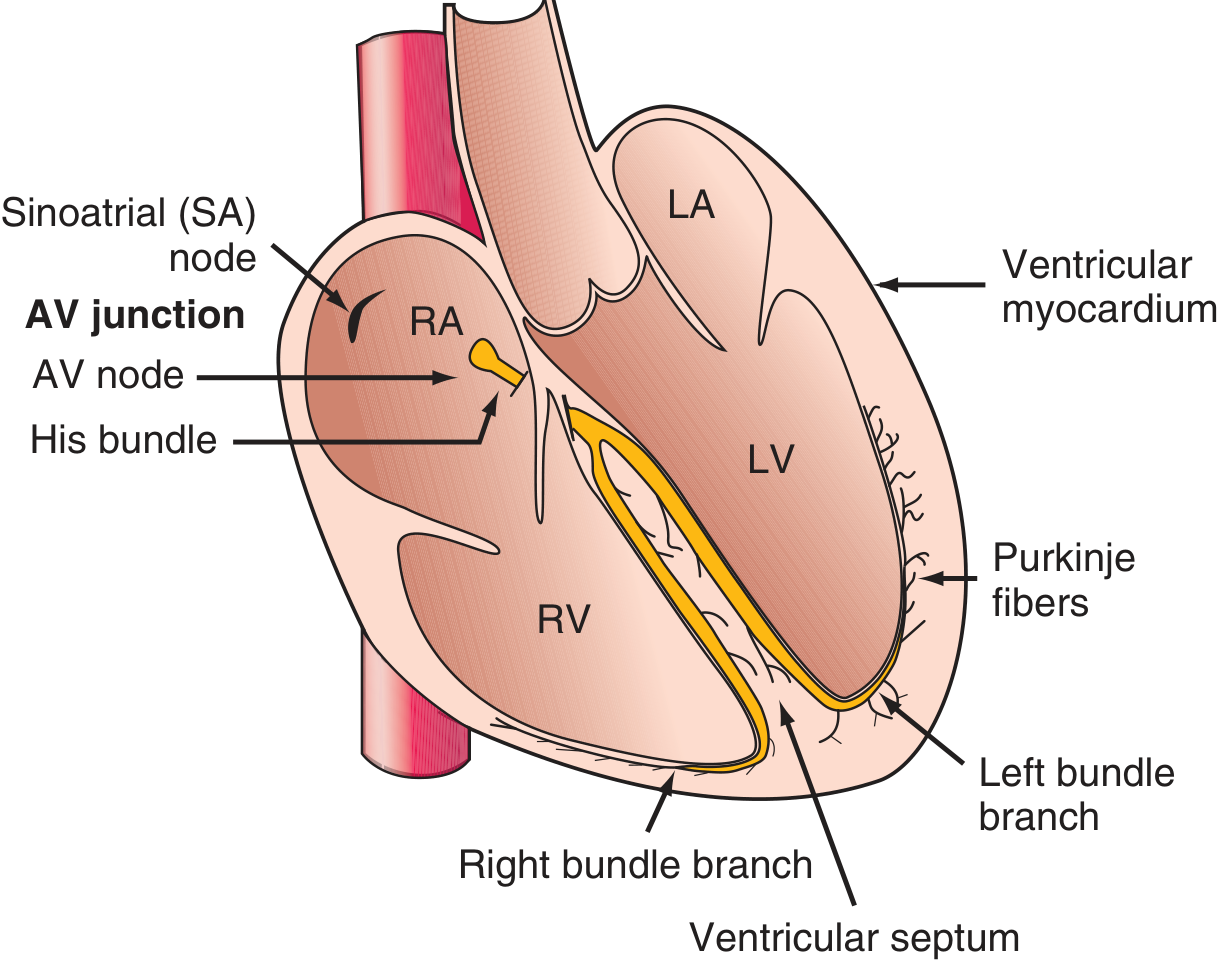
Fig. 247-1 - The cardiac conduction system. The impulse originates in the SA node, travels to the AV node, then down the His bundle, splits into right and left bundle branches, and reaches the ventricles via Purkinje fibers.
The sequence matters for ECG interpretation:
- SA node fires first → produces the P wave
- Signal crosses the AV node (physiologic delay) → produces the PR interval
- Bundle branches + Purkinje fibers depolarize the ventricles → produces the QRS complex
- Ventricular repolarization → produces the T wave
Part 2: The Basic ECG Waveforms and Intervals
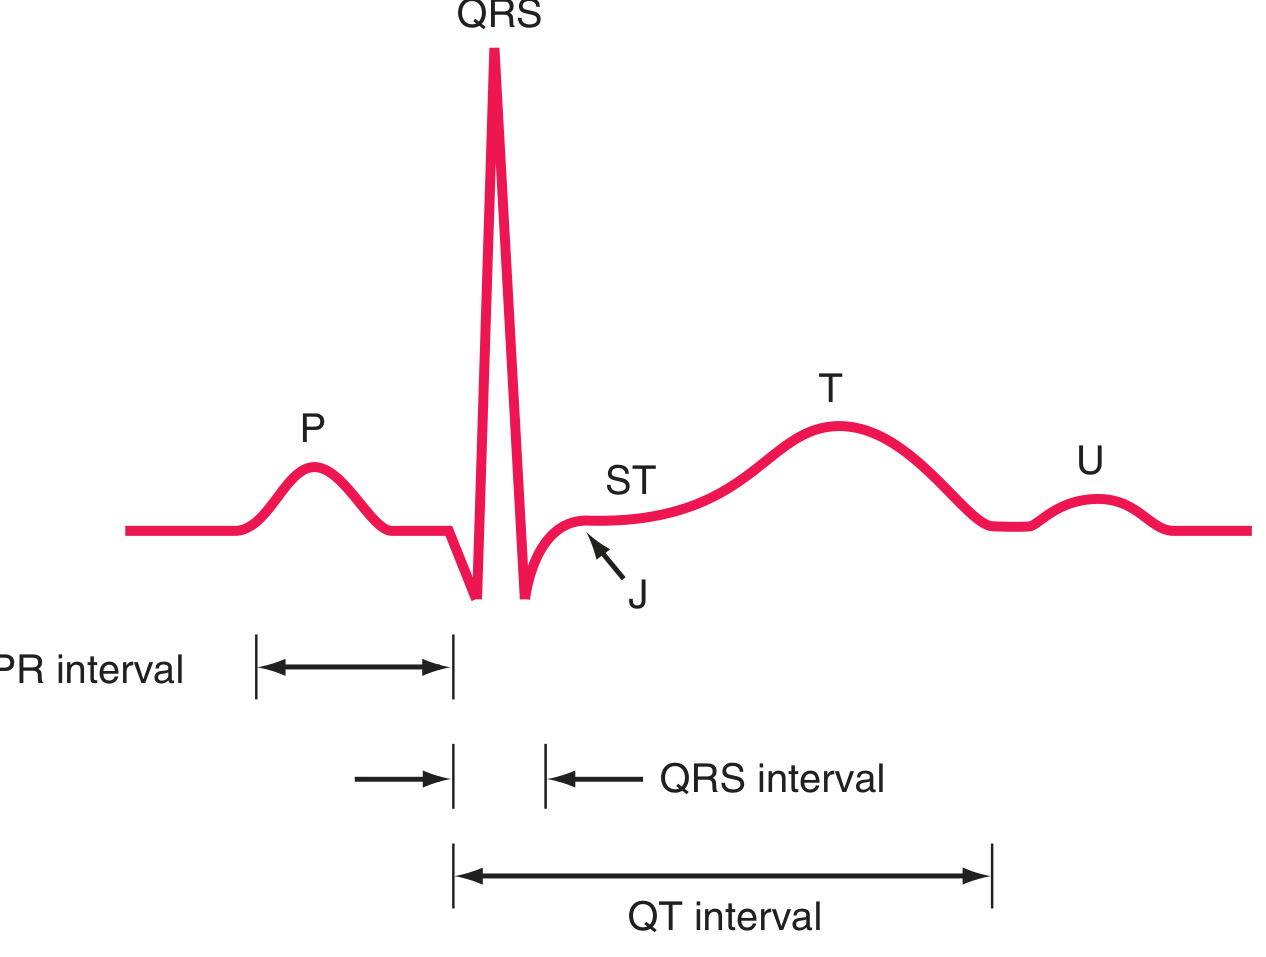
Fig. 247-2 - Basic ECG waveforms and intervals.
| Wave/Interval | What it Represents | Normal Value |
|---|---|---|
| P wave | Atrial depolarization | Duration <120 ms, amplitude <2.5 mm |
| PR interval | Atrial-to-ventricular conduction (includes AV node delay) | 120-200 ms (0.12-0.20 s) |
| QRS complex | Ventricular depolarization | ≤100-110 ms (≤2.5 small squares) |
| J point | Junction between QRS end and ST segment start | At baseline |
| ST segment | Isoelectric ventricular plateau (phase 2 of action potential) | At baseline (neither elevated nor depressed) |
| T wave | Ventricular repolarization | Same direction as QRS (concordant) |
| QT interval | Total ventricular depolarization + repolarization | QTc ≤460 ms (women), ≤450 ms (men) |
| U wave | After-depolarizations, Purkinje repolarization | Small, same polarity as T wave |
ECG paper speed: Standard is 25 mm/sec.
- 1 small box = 1 mm = 40 ms (0.04 s)
- 1 large box = 5 mm = 200 ms (0.20 s)
- Voltage: 1 mV = 10 mm vertically
Part 3: The 12 ECG Leads - What They "Look At"
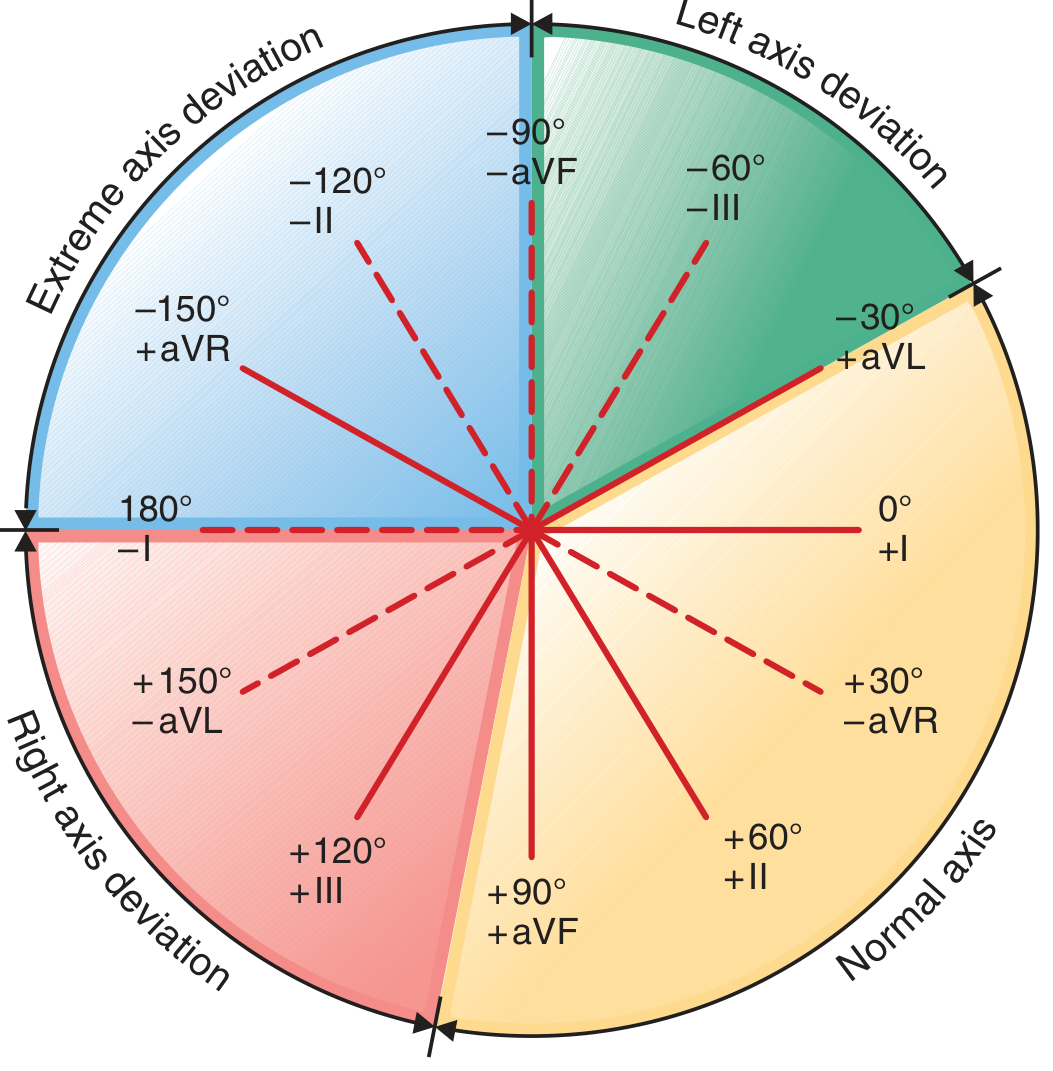
Fig. 247-4 - The hexaxial diagram. Normal QRS axis falls in the yellow zone (0° to +90°). Left axis deviation is in the green zone (0° to −90°). Right axis deviation is in the red zone (+90° to +180°).
Limb leads (frontal plane):
| Lead | View | What it faces |
|---|---|---|
| Lead I | Lateral | Left side of heart |
| Lead II | Inferior | Inferior wall |
| Lead III | Inferior | Inferior wall |
| aVR | Right shoulder | Right upper heart (usually negative) |
| aVL | Left shoulder | High lateral wall |
| aVF | Feet (inferior) | Inferior wall |
Chest (precordial) leads (horizontal plane):
| Lead | Position | Region |
|---|---|---|
| V1 | 4th ICS, right sternal border | Right ventricle / septum |
| V2 | 4th ICS, left sternal border | Septum |
| V3 | Between V2 and V4 | Anterior wall |
| V4 | 5th ICS, midclavicular line | Anterior/apex |
| V5 | Anterior axillary line | Lateral wall |
| V6 | Midaxillary line | Lateral wall |
Key rule: A depolarization wave moving toward a lead's positive pole produces an upward (positive) deflection. Moving away produces a downward (negative) deflection.
Part 4: A Systematic 14-Step Approach to Every ECG
Harrison's describes a 14-parameter systematic approach - missing any single parameter is a common source of errors:
- Standardization/calibration - Is the ECG calibrated? Is the paper speed correct? Check for lead reversal artifacts.
- Rhythm - Regular or irregular? Is every beat the same?
- Heart rate - Count the R-R intervals. Formula: 300 ÷ number of large boxes between two R waves. Or: 1500 ÷ number of small boxes.
- PR interval - Normal 120-200 ms. Short = pre-excitation (WPW). Prolonged = heart block.
- QRS interval - Normal ≤110 ms. Wide QRS = bundle branch block, hyperkalemia, pre-excitation.
- QT/QTc interval - Prolonged = risk of torsades de pointes (TdP).
- Mean QRS axis - Normal is 0° to +90°.
- P waves - Present? Normal morphology? One before every QRS?
- QRS voltages - High = hypertrophy. Low = pericardial effusion, obesity, COPD.
- Precordial R-wave progression - R waves should grow from V1 to V5/V6.
- Abnormal Q waves - Q waves >40 ms wide or >25% of R-wave height = pathological (infarction).
- ST segments - Elevated or depressed?
- T waves - Inverted, peaked, or flattened?
- U waves - Prominent? Inverted?
Part 5: Determining Heart Rate
Rapid method (regular rhythm):
- Count large boxes between two consecutive R waves
- Divide 300 by that number
- 300, 150, 100, 75, 60, 50 (memorize this for 1, 2, 3, 4, 5, 6 large boxes)
Normal: 60-100 bpm | Bradycardia: <60 bpm | Tachycardia: >100 bpm
Part 6: Axis Determination
Using the hexaxial diagram above:
- Normal axis: 0° to +90° (leads I and aVF both positive)
- Left axis deviation (LAD): more negative than −30° to −45° (lead I positive, aVF negative)
- Right axis deviation (RAD): more positive than +90° to +110° (lead I negative, aVF positive)
- Extreme axis deviation: −90° to ±180° (leads I and aVF both negative)
Common causes of LAD: Left anterior fascicular block, inferior MI, LBBB
Common causes of RAD: Right ventricular hypertrophy, left posterior fascicular block, pulmonary embolism, lateral MI
Part 7: ECG of a Normal Healthy Adult
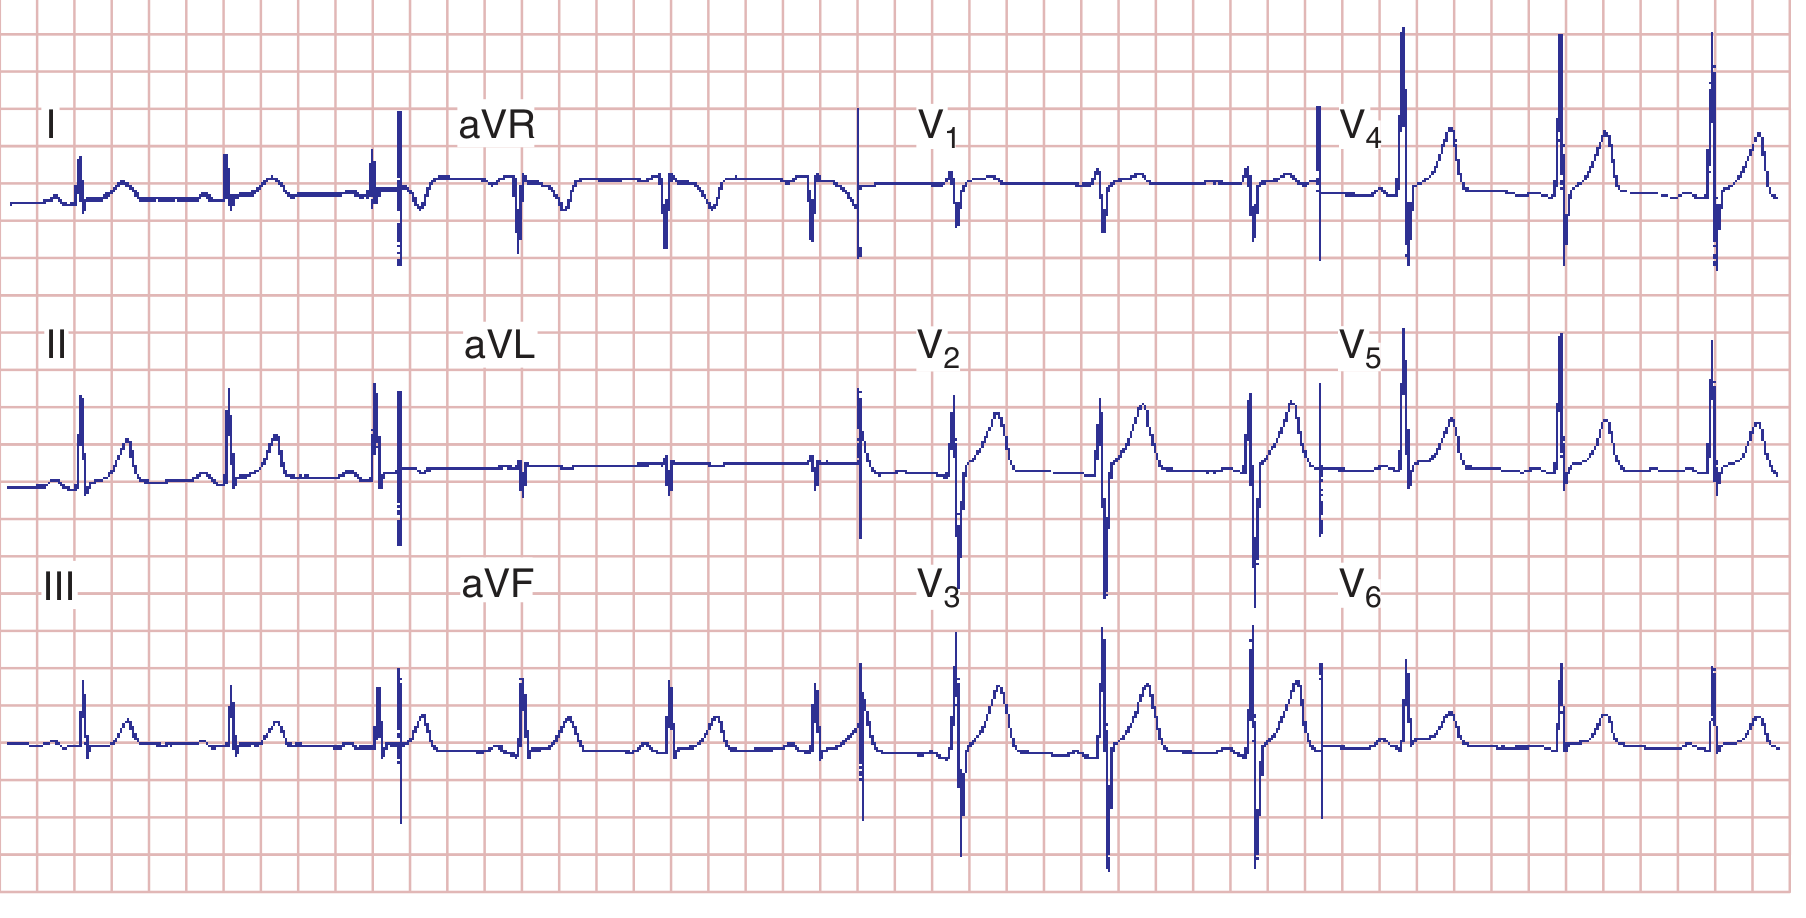
Fig. 247-7 - Normal ECG. HR 75 bpm. PR 160 ms. QRS 80 ms. QT 360 ms. QTc ~390 ms. Axis +70°. Normal R-wave progression with transition at V3-V4.
What to see in a normal ECG:
- Upright P wave in lead II (sinus rhythm), inverted in aVR
- PR interval 120-200 ms
- Narrow QRS <110 ms
- Small r wave in V1, growing progressively to V4/V5 (R-wave progression)
- T waves concordant (same direction) with QRS
Part 8: Hypertrophy Patterns
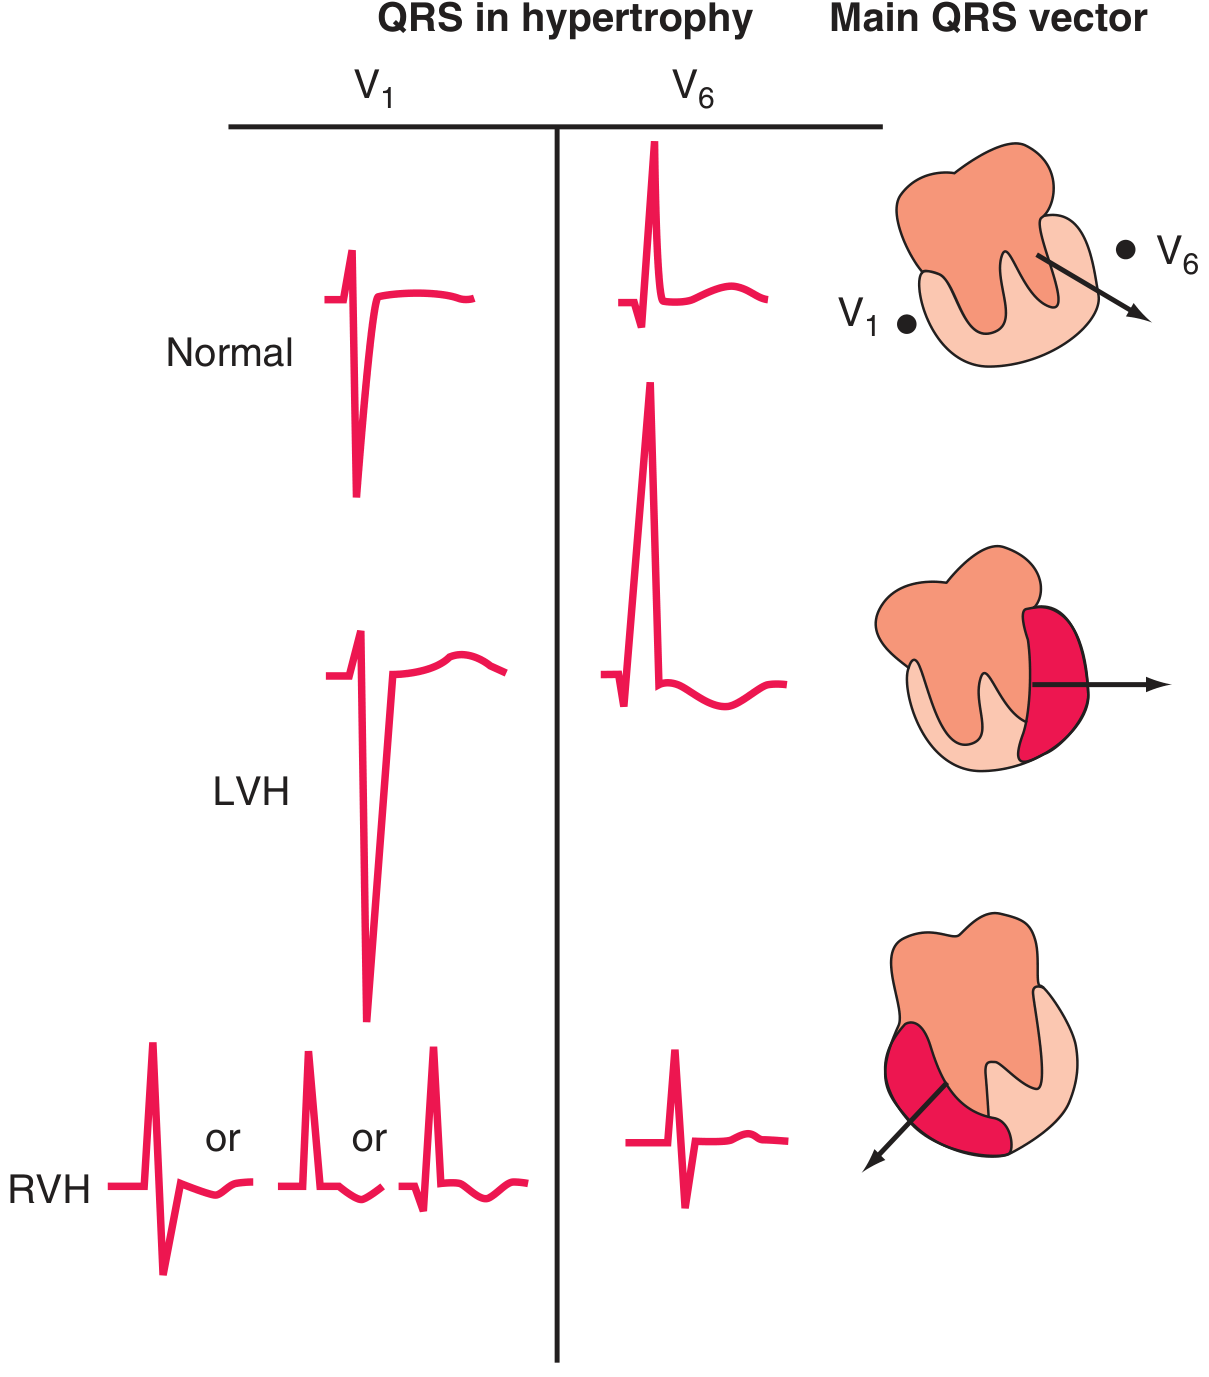
Fig. 247-9 - LVH increases leftward/posterior forces (tall R in V5/V6, deep S in V1). RVH shifts the vector rightward/anteriorly (tall R in V1, deep S in V5/V6).
Left Ventricular Hypertrophy (LVH)
- S in V1 + R in V5 or V6 >35 mm (Sokolow-Lyon criterion)
- R in aVL >20 mm (women) or >28 mm (men)
- ST depression + T-wave inversion in leads with tall R waves (formerly "strain" pattern)
- Left atrial abnormality often coexists
Right Ventricular Hypertrophy (RVH)
- Tall R wave in V1 (R ≥ S in V1)
- Right axis deviation (>+90°)
- ST depression + T-wave inversion in right precordial leads (V1-V3)
- Causes: pulmonary hypertension, pulmonic stenosis
P-wave abnormalities
- Right atrial overload: Tall, peaked P waves ≥2.5 mm in lead II ("P-pulmonale")
- Left atrial abnormality: Broad (≥120 ms), notched P in limb leads; biphasic P in V1 with broad negative component ("P-mitrale")
Part 9: Bundle Branch Blocks
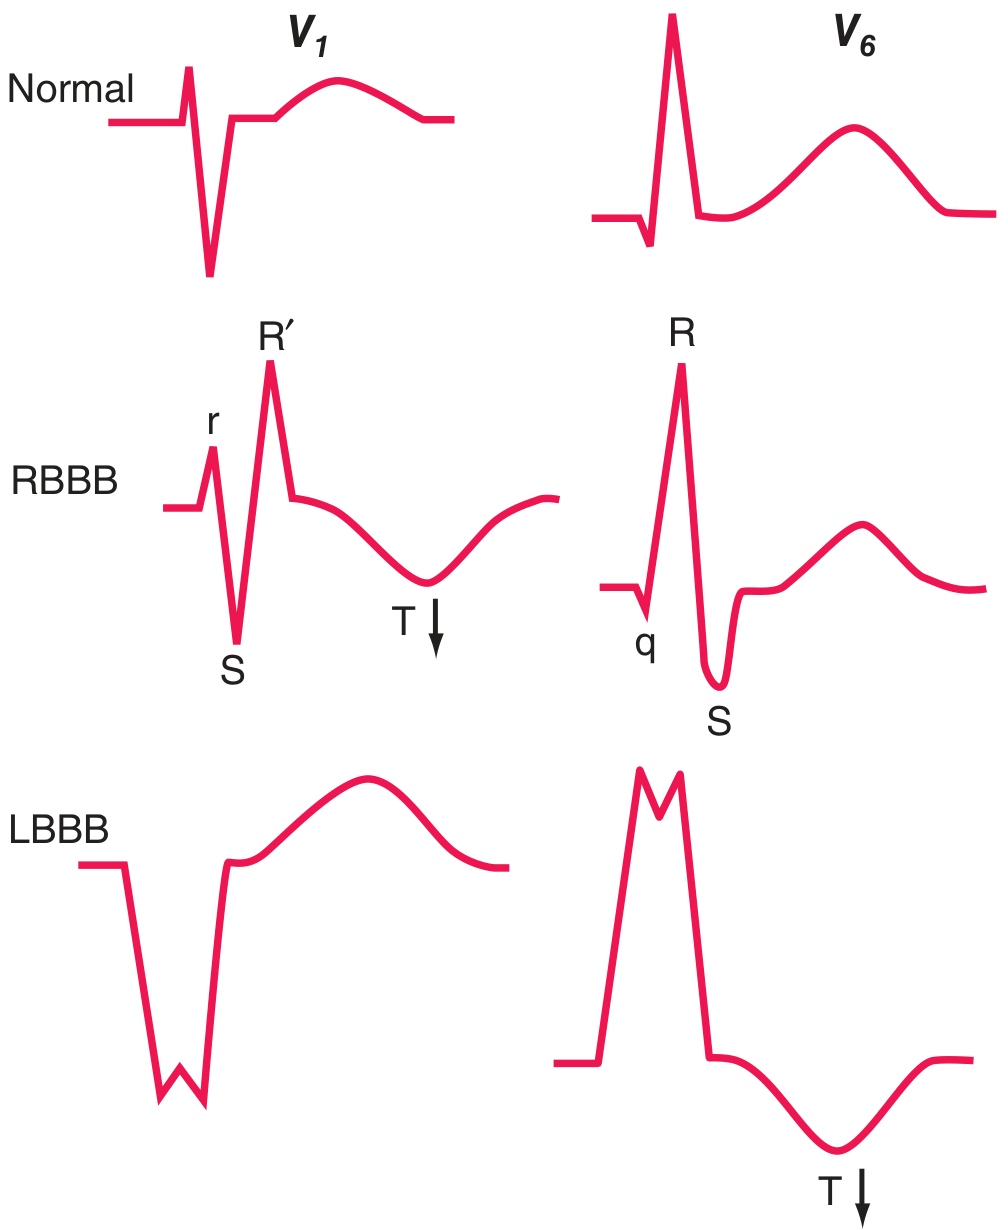
Fig. 247-10 - RBBB shows rSR' ("rabbit ears") in V1 with T-wave inversion. LBBB shows wide QS in V1 and broad monophasic R in V6 with discordant T-wave inversion.
Right Bundle Branch Block (RBBB)
- QRS ≥120 ms
- rSR' in V1 ("rabbit ears" or "M" pattern)
- Wide S waves in leads I, V5, V6
- T-wave inversion in V1-V3 (secondary change)
- Can be normal variant; also seen with atrial septal defect, PE, anterior MI
Left Bundle Branch Block (LBBB)
- QRS ≥120 ms
- Broad monophasic R in V5/V6 (no septal q wave)
- QS or rS in V1
- T-wave inversion in lateral leads (secondary, discordant)
- Usually indicates significant heart disease (ischemia, hypertension, cardiomyopathy, valvular disease)
- LBBB makes ischemia interpretation unreliable - use Sgarbossa criteria if MI suspected
Part 10: Ischemia and Infarction Patterns
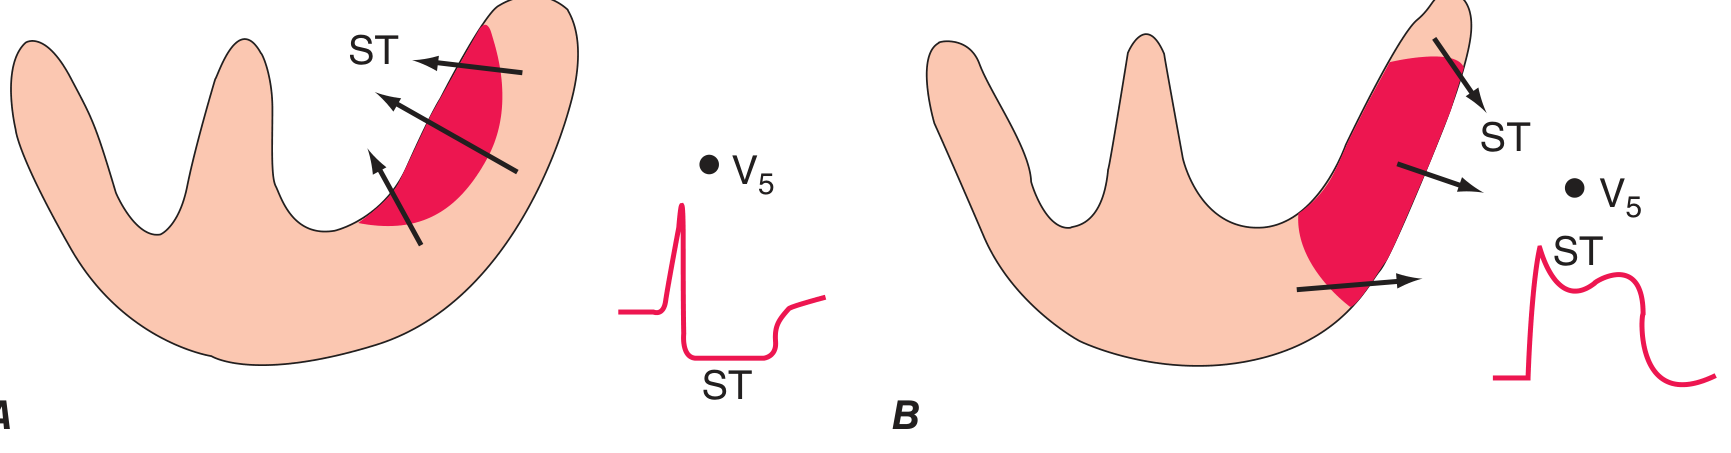
Fig. 247-11 - (A) Subendocardial ischemia: the ST vector points inward, causing ST depression in overlying leads. (B) Transmural ischemia: the ST vector points outward toward the epicardium, causing ST elevation in overlying leads.
ST-Segment Elevation MI (STEMI)
- Definition: New ST elevation ≥1 mm in 2+ contiguous leads (≥2 mm in V1-V3)
- Associated with: tall, peaked "hyperacute" T waves early, then Q waves and T-wave inversions develop over hours-days
- Localization by leads:
| Territory | Leads with ST Elevation | Artery |
|---|---|---|
| Anterior | V1-V4 | LAD |
| Lateral | I, aVL, V5-V6 | LCx or diagonal |
| Inferior | II, III, aVF | RCA (most common) or LCx |
| Posterior | ST depression V1-V3 (mirror image); confirm with posterior leads | RCA or LCx |
| Right ventricle | V1, V3R-V4R | RCA proximal |
- Reciprocal changes: ST depression in leads opposite the area of infarction (e.g., inferior STEMI with ST depression in I, aVL) strongly supports true ischemia.
Non-ST Elevation MI (NSTEMI) / Unstable Angina
- ST depression (especially in V1-V4 with horizontal/downsloping morphology)
- T-wave inversions (deep, symmetric inversions in anterior leads = LAD territory "Wellens pattern")
- No Q-wave formation
Q Waves (Pathological)
- Duration >40 ms (1 small box) wide
- Depth >25% of the R-wave in the same lead
- Present in 2+ contiguous leads
- Represent electrically silent (infarcted) myocardium
- Normal: small q waves in I, aVL, V5, V6 (septal q waves) are acceptable
Part 11: Common Arrhythmia Recognition
Sinus Rhythms
- Normal sinus rhythm: Regular P-P and R-R intervals, P upright in II, inverted in aVR, rate 60-100 bpm
- Sinus tachycardia: Same as above, rate >100 bpm (pain, fever, hypovolemia, PE)
- Sinus bradycardia: Rate <60 bpm (athletes, vagal tone, hypothyroidism, beta-blockers)
Atrial Arrhythmias
- Atrial fibrillation (AF): Irregularly irregular rhythm, no distinct P waves, fibrillatory baseline (most common sustained arrhythmia)
- Atrial flutter: Regular sawtooth flutter waves at ~300 bpm, typically 2:1 or 4:1 ventricular rate (~150 or 75 bpm); best seen in II, III, aVF, V1
- SVT (AVNRT): Narrow complex tachycardia 150-250 bpm, P waves buried in or just after QRS
AV Blocks
| Type | PR Interval | Features |
|---|---|---|
| 1st degree | >200 ms, constant | Benign, no dropped beats |
| 2nd degree Mobitz I (Wenckebach) | Progressive lengthening | Dropped beat, then cycle resets |
| 2nd degree Mobitz II | Fixed, then suddenly drops | Constant PR then sudden non-conducted P; can progress to complete block |
| 3rd degree (complete) | No relationship between P and QRS | P rate ≠ QRS rate; junctional or ventricular escape |
Ventricular Arrhythmias
- PVCs: Wide QRS (>120 ms) without preceding P wave, bizarre morphology, followed by compensatory pause
- VT: ≥3 consecutive PVCs at rate >100 bpm; wide complex, AV dissociation
- VF: Chaotic irregular waveforms, no organized QRS - requires immediate defibrillation
Part 12: Other Important ECG Patterns
| Condition | Key ECG Finding |
|---|---|
| Hyperkalemia | Peaked T waves → wide QRS → loss of P wave → sine wave pattern |
| Hypokalemia | Flattened T waves, prominent U waves, apparent QT prolongation |
| Hypercalcemia | Shortened QT interval |
| Hypocalcemia | Prolonged QT interval |
| Acute pericarditis | Diffuse saddle-shaped ST elevation in multiple leads (not territory-specific), PR depression |
| Pulmonary embolism | Sinus tachycardia (most common); S1Q3T3 pattern; new RBBB; right axis deviation |
| WPW (pre-excitation) | Short PR <120 ms, delta wave (slurred QRS upstroke), wide QRS |
| Brugada pattern | RBBB-like + coved ST elevation in V1-V2 (risk of sudden death) |
| Digoxin effect | Scooped/reverse tick ST depression ("Salvador Dali mustache"), short QT |
| Long QT syndrome | QTc >450-460 ms; risk of TdP and sudden death |
Summary: The Quick Systematic Read (Memory Trick: "Rate Rhythm Axis Intervals Morphology")
- Rate - Fast, slow, or normal?
- Rhythm - Regular? P before every QRS? QRS after every P?
- Axis - Normal, left, right?
- Intervals - PR, QRS, QT within limits?
- Morphology - P wave shape, QRS morphology, ST-T changes, Q waves, R-wave progression, U waves
Always compare with a prior ECG if available - changes over time are often more important than a single snapshot.
Harrison's Principles of Internal Medicine 22E (2025, McGraw Hill) - Chapter 247: Electrocardiography | Guyton & Hall Textbook of Medical Physiology - Chapter 11
This is a shared conversation. Sign in to Orris to start your own chat.