
What are the different causes of tall t waves and how differentiate them
Reading File
Tall T waves can result from hyperkalemia, early MI (hyperacute T waves), LVH, LBBB, myocardial ischemia, vagotonia, and normal variants (especially in young males). The key differentiators are clinical context, distribution of tall T waves across leads, associated ECG changes, and electrolyte levels.
Searching sources...
Finding Sources
Finding Sources
Finding Sources
Finding Sources
Reading File
Reading File
Reading File
Finding Sources
Finding Sources
Finding Sources
Reading File
Loading Image
Finding Sources
Reading File
Reading File
Now I have enough high-quality source material to provide a thorough, well-organized answer. Let me also fetch the hyperkalemia ECG image.
Loading Image
Here is a comprehensive breakdown of all major causes of tall T waves and how to differentiate them.
Causes of Tall T Waves - Differential Diagnosis
What Defines a "Tall" T Wave?
A T wave is considered tall when it exceeds 6 mm in limb leads or 10 mm in precordial leads. The T wave represents ventricular repolarization, and anything that alters repolarization - whether metabolic, ischemic, or physiologic - can make it tall.
Causes at a Glance
| Cause | Distribution | T Wave Shape | Key Distinguishing Features |
|---|---|---|---|
| Hyperkalemia | Diffuse (all leads) | Narrow, peaked, "tent-shaped" | Shortened QT, widened QRS, absent P waves as K rises |
| Hyperacute MI | Regional (contiguous leads) | Broad-based, tall, symmetric | Preceded by/accompanied by ST elevation, clinical chest pain |
| Early repolarization (normal variant) | Precordial (V2-V5) | Tall, often with ST elevation | Young male, asymptomatic, concave ST, J-point notching |
| LVH + LBBB | V1-V2 (discordant leads) | Tall in right precordials | Voltage criteria, strain pattern in lateral leads |
| Cerebrovascular injury | Diffuse or regional | Very deep, may be inverted or tall | Intracranial hemorrhage/stroke, neurological signs, long QTc |
| Posterior MI (reciprocal) | V1-V3 | Tall R + upright T | Dominant R in V1, ST depression V1-V3 - mirror of posterior STEMI |
| Hyperventilation / vagotonia | Anterior precordials | Tall, upright | Disappears with exercise; bradycardia, young atheletes |
1. Hyperkalemia
Mechanism: Elevated extracellular K+ reduces the resting membrane potential gradient, shortening repolarization time and producing the classic peaked T wave.
ECG features:
- Narrow, symmetrically peaked ("tent-shaped") T waves - the hallmark
- Shortened QT interval (early change)
- As K+ rises: PR prolongation → P wave flattening/disappearance → QRS widening → sine wave pattern → VF/asystole
Progression by serum K+ level (Harrison's):
- 5.5-6.5 mEq/L: tall peaked T waves
- 6.5-7.5 mEq/L: loss of P waves
-
7.5 mEq/L: widened QRS, sine-wave pattern
Distribution: Diffuse - affects ALL leads, not regional
Key differentiator: Narrow, tent-shaped peak is characteristic. Check serum K+. Associated QRS/PR changes. The T wave is tall but narrow (short base width). History of renal failure, ACE inhibitors, K-sparing diuretics.
2. Hyperacute T Waves of Acute MI (STEMI)
Mechanism: The earliest ECG change in transmural ischemia - severe, acute ischemia shifts the ST vector toward the epicardium, producing ST elevations and, in the very earliest stage, tall positive hyperacute T waves over the ischemic zone.
ECG features (Rosen's/Frameworks):
- Broad-based, tall, symmetrical T waves
- Present in at least 2 contiguous leads corresponding to the affected coronary territory
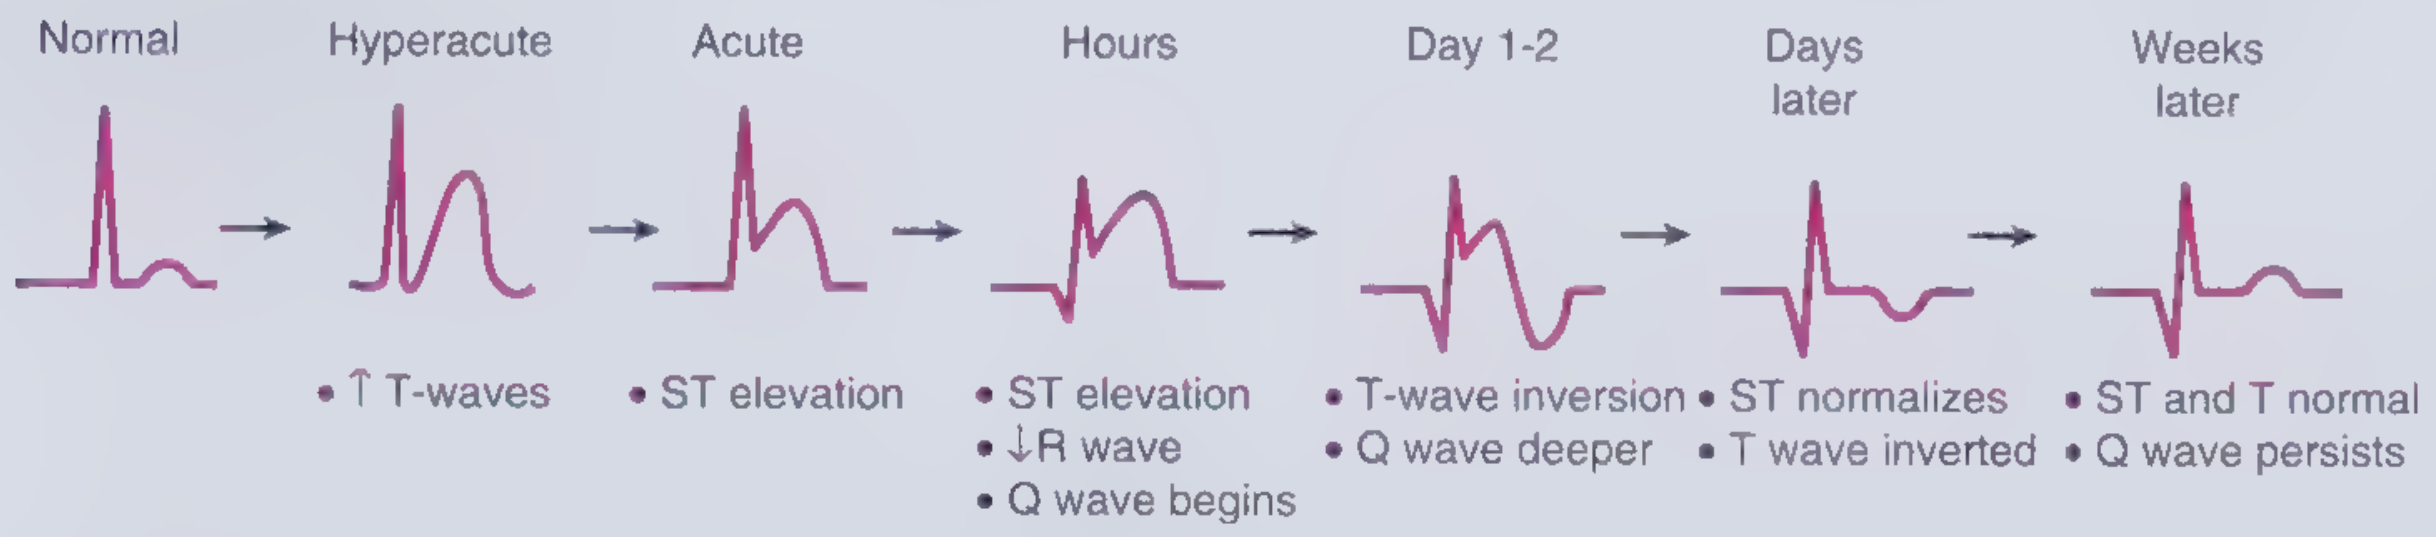
- Quickly followed (within minutes to 30 min) by frank ST elevation, then T-wave inversion days later, then Q waves
The ECG evolution of STEMI:
The actual hyperacute T waves (broad, tall in V3-V4 with early ST rise in V1-V2) in a patient with chest pain and diaphoresis:
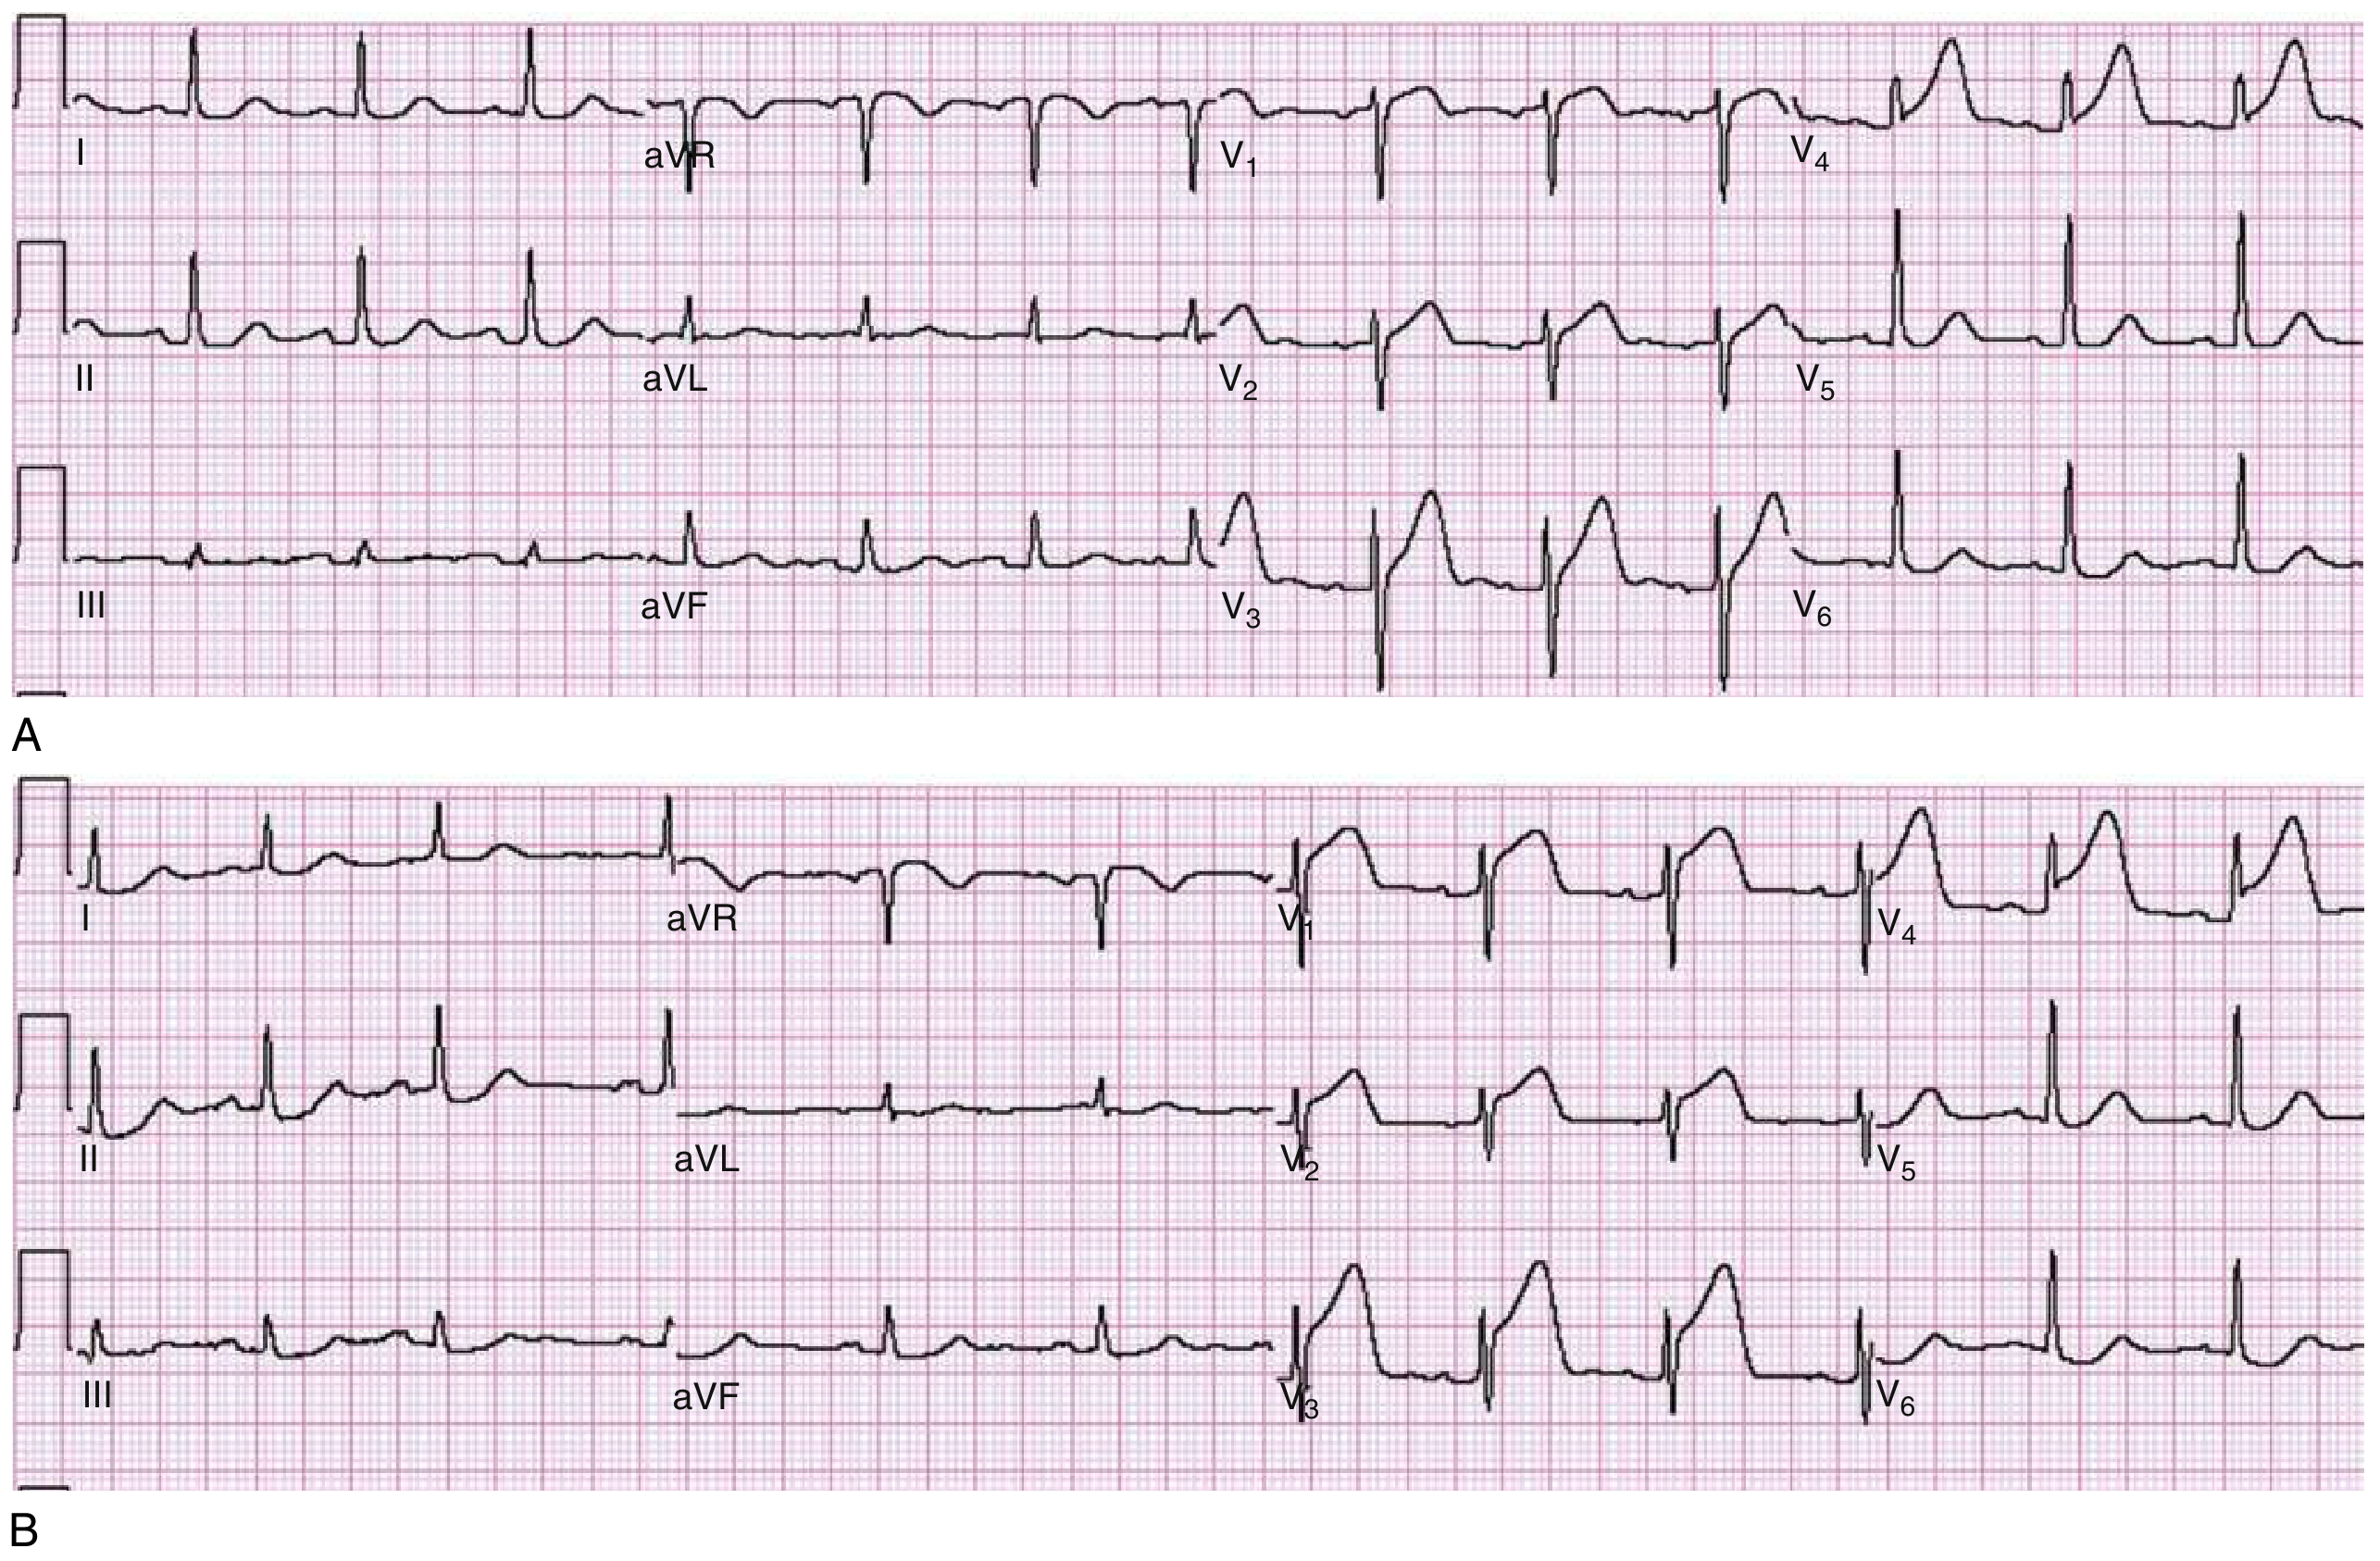
Key differentiator:
- Broad base (wide T wave) vs. narrow tent-shaped in hyperkalemia
- Regional distribution - follows a vascular territory (anterior: V1-V6 + I/aVL; inferior: II/III/aVF)
- Clinical context: chest pain, diaphoresis, risk factors
- Evolves rapidly to ST elevation if serial ECGs done 15-30 min apart
- Troponin will rise
3. Normal Variant / Early Repolarization
ECG features:
- Tall T waves in anterior precordials (V2-V5), often with concave ("smiley face") ST elevation of 1-2 mm
- J-point notching or slurring ("fish hook" appearance) is characteristic
- T waves tend to be tall and rounded but not tent-shaped
Key differentiator:
- Seen in young, healthy males (athletes especially)
- Asymptomatic - no chest pain
- ST elevation is concave, not convex (whereas STEMI is convex)
- T waves do not evolve - serial ECGs are stable over time
- Disappears or diminishes with exercise (increased heart rate)
- No QRS or PR abnormalities
4. Left Ventricular Hypertrophy (LVH) and Left Bundle Branch Block (LBBB)
Mechanism: Increased LV mass and delayed depolarization alter the direction and magnitude of repolarization forces.
ECG features:
- In LVH: tall T waves in V1-V2 (right precordials) as a discordant change opposite the high-voltage QRS; lateral leads (V5-V6, I, aVL) show the "strain pattern" (ST depression + T inversion)
- In LBBB: ST elevations and tall, positive T waves in V1-V2 are an expected, secondary change - not pathological
Key differentiator (Harrison's):
- "ST-segment elevations and tall, positive T waves are common findings in leads V1 and V2 in left bundle branch block or left ventricular hypertrophy in the absence of ischemia"
- Voltage criteria for LVH present (S in V1 + R in V5-V6 >35 mm; R in aVL >11 mm)
- Wide QRS (>120 ms) with typical LBBB morphology if LBBB
- Strain pattern (T inversion + ST depression) in lateral leads
- T wave change is discordant to QRS direction in LVH/LBBB
5. Cerebrovascular Injury (Neurocardiac T Waves)
Mechanism: Massive sympathetic surge from acute intracranial events (subarachnoid hemorrhage, ischemic stroke, intracranial hemorrhage) causes catecholamine-mediated myocardial stunning and repolarization abnormalities.
ECG features:
- Can produce tall, peaked T waves OR deeply inverted "cerebral" T waves (the more classic pattern)
- Markedly prolonged QTc interval
- Diffuse distribution, not regional
Key differentiator (Harrison's):
- Tall T waves "may also be caused by... cerebrovascular injury, among other causes"
- Clinical context: acute neurological presentation (severe headache, stroke, decreased consciousness)
- QTc prolongation is prominent
- Not following a coronary distribution
- Troponin may be mildly elevated (neurogenic myocardial injury) but typically without the full STEMI picture
6. Posterior MI (Tall R + Upright T in V1-V3 as Reciprocal Change)
Mechanism: Posterior wall MI produces ST elevation posteriorly; this is seen as reciprocal ST depression + tall R + tall upright T waves in the right precordial leads (V1-V3), which look at the posterior wall "backwards."
Key differentiator:
- Dominant R wave in V1 (R/S ratio >1)
- ST depression (not elevation) in V1-V3
- The tall T is part of a "mirror image" - if you flip the ECG horizontally it looks like a STEMI
- Confirm with posterior leads (V7-V9) showing ST elevation
7. Left Ventricular Volume Overload
Mechanism: Increased diastolic filling (aortic regurgitation, mitral regurgitation) stretches ventricular fibers, altering repolarization.
ECG features:
- Tall, broad T waves in lateral leads (I, aVL, V5-V6) associated with high-voltage QRS
- Not in the "peaked" pattern of hyperkalemia
Key differentiator: Cardiomegaly on CXR, murmur on auscultation, echocardiographic volume overload pattern
Summary: Key Differentiating Clues
| Feature | Hyperkalemia | Hyperacute MI | Early Repolarization | LVH/LBBB |
|---|---|---|---|---|
| T wave shape | Narrow, peaked | Broad, tall, sym. | Tall, rounded | Tall, discordant |
| Distribution | All leads | Regional (vascular) | V2-V5 | V1-V2 |
| QT interval | Short | Normal/long | Normal | Normal |
| ST segment | Can be depressed | Rising to frank elevation | Concave elevation | Discordant |
| QRS width | Widens as K rises | Normal | Normal | Wide (LBBB) |
| Evolution | Yes (worsens) | Rapid (minutes) | Stable | Stable |
| Clinical context | Renal failure, meds | Chest pain | Young, asymptomatic | Hypertension |
| Serum K+ | High | Normal | Normal | Normal |
| Troponin | Normal | Rising | Normal | Normal |
Practical Clinical Approach
- Serial ECGs (15-30 min intervals): Hyperacute T waves of MI evolve rapidly into ST elevation. Benign variants and hyperkalemia are more stable in morphology (though hyperkalemia worsens as K+ rises).
- Serum potassium + renal function: First test to order when T waves are diffuse, peaked, and narrow.
- Clinical history: Chest pain + regional tall T waves = hyperacute MI until proven otherwise.
- Lead distribution: Diffuse = hyperkalemia or cerebrovascular. Regional = ischemia. Anterior-only with J-point notching in young male = early repolarization.
- QRS width and PR interval: Widening QRS or absent P waves point strongly to hyperkalemia.
- Posterior leads (V7-V9): If V1-V3 shows tall R + upright T + ST depression, add posterior leads to rule out posterior MI.
Sources:
- Harrison's Principles of Internal Medicine 22E (2025), Chapter on ECG Interpretation and Ischemia
- Rosen's Emergency Medicine, Chapter 64 (ECG Abnormalities in ACS)
- Frameworks for Internal Medicine (ACS chapter)
- Morgan & Mikhail's Clinical Anesthesiology, 7e (Hyperkalemia chapter)
- Miller's Anesthesia 10e (Hyperkalemia ECG changes)
This is a shared conversation. Sign in to Orris to start your own chat.