How to interpret ecg
Reading File
Finding Sources
Searching Images
ECG interpretation normal waveform PQRST segments intervals
Finding Sources
Finding Sources
Reading File
Reading File
Reading File
Finding Sources
Reading File
Reading File
Loading Image
Reading File
Loading Image
I have comprehensive content from Harrison's Principles of Internal Medicine (22nd Ed) and Medical Physiology. Here is a thorough, structured guide to ECG interpretation.
How to Interpret an ECG
An ECG (electrocardiogram) is a graphical representation of the heart's electrical activity recorded via electrodes on the limbs and chest. It is noninvasive, inexpensive, and provides immediate diagnostic information about arrhythmias, conduction disturbances, ischemia/infarction, metabolic disturbances, and drug toxicities.
The Cardiac Conduction System (What the ECG Reflects)
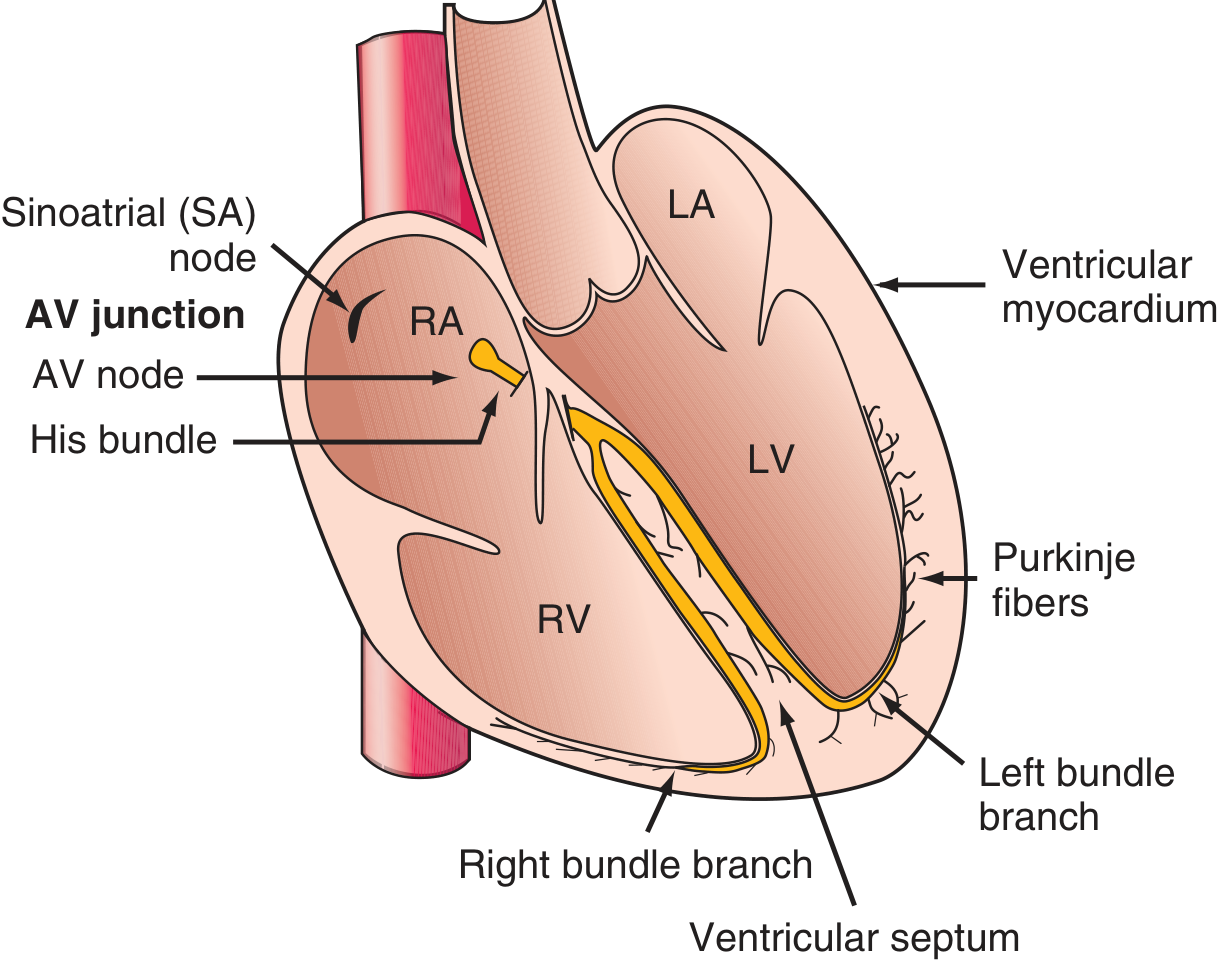
The normal electrical impulse originates at the SA node → spreads through the atria → passes through the AV node (slows) → travels down the His bundle → splits into right and left bundle branches → activates the ventricles via Purkinje fibers.
ECG Paper & Calibration
ECG paper has a grid of 1 mm small boxes and 5 mm large boxes:
- Horizontal axis (time): 1 small box = 0.04 s; 1 large box = 0.2 s; 5 large boxes = 1.0 s
- Vertical axis (voltage): 1 mm = 0.1 mV (standard calibration: 10 mm = 1 mV)
Quick heart rate calculation: Rate = 300 ÷ (number of large boxes between R-R interval)
- 1 large box → 300 bpm | 2 → 150 | 3 → 100 | 4 → 75 | 5 → 60 | 6 → 50
The 14-Parameter Systematic Approach (Harrison's)
A systematic reading prevents errors of omission. Always analyze all 14 parameters:
1. Standardization & Technical Features
- Check calibration (standard = 10 mm/mV)
- Verify lead placement (limb leads: I, II, III, aVR, aVL, aVF; precordial leads: V1–V6)
- Identify artifacts (muscle tremor, lead displacement, electrical interference)
- Always compare with prior ECGs
2. Rhythm
Ask three questions:
- Where is the pacemaker? (Normal = SA node)
- What is the conduction path to the ventricles?
- Is it regular and at the correct rate?
Normal sinus rhythm: P wave precedes every QRS, rate 60–100 bpm, regular R-R intervals.
| Rhythm Finding | Clue |
|---|---|
| No P waves, irregular R-R | Atrial fibrillation |
| Sawtooth P waves | Atrial flutter |
| Wide, bizarre QRS without P | Ventricular tachycardia |
| Regular, slow with no P-QRS relationship | Complete (3rd degree) AV block |
3. Heart Rate
- Normal: 60–100 bpm
- Bradycardia: < 60 bpm
- Tachycardia: > 100 bpm
- Use the 300 rule (above) for regular rhythms; count complexes in 6 seconds × 10 for irregular rhythms
4. PR Interval (AV Conduction)
- Normal: 0.12–0.20 s (3–5 small boxes)
- Reflects AV node conduction time
| PR Finding | Interpretation |
|---|---|
| > 0.20 s (prolonged) | 1st degree AV block |
| Progressively lengthening → dropped QRS | 2nd degree AV block, Mobitz I (Wenckebach) |
| Constant PR, then suddenly dropped QRS | 2nd degree AV block, Mobitz II |
| No relationship between P and QRS | 3rd degree (complete) AV block |
| Short PR (< 0.12 s) + delta wave | Wolff-Parkinson-White (WPW) pre-excitation |
5. QRS Duration (Intraventricular Conduction)
- Normal: < 0.10–0.12 s (< 2.5–3 small boxes)
- Narrow QRS = normal ventricular conduction
- Wide QRS (> 0.12 s) = bundle branch block, ventricular rhythm, or pacing
| QRS Finding | Interpretation |
|---|---|
| Wide QRS, RSR' in V1, wide S in V6 | Right Bundle Branch Block (RBBB) |
| Wide QRS, broad notched R in V5-V6, QS in V1 | Left Bundle Branch Block (LBBB) |
| Wide bizarre QRS, no preceding P | Ventricular ectopic / VT |
"WiLLiaM MaRRoW" mnemonic: LBBB → W in V1, M in V6; RBBB → M in V1, W in V6.
6. QT / QTc Interval
- Measured from start of QRS to end of T wave
- Normal QTc: < 440 ms in men, < 460 ms in women (Bazett formula: QTc = QT ÷ √RR)
- Prolonged QTc: Risk of Torsades de Pointes (TdP) → drugs (quinidine, amiodarone, antihistamines), hypokalaemia, hypomagnesaemia, hypocalcaemia, congenital long QT syndromes
- Short QTc: Hypercalcaemia
7. Mean QRS Electrical Axis
- Normal axis: −30° to +100° (frontal plane)
- Quick method: If QRS is mostly positive in leads I and aVF → normal axis
| Axis | Degrees |
|---|---|
| Normal | −30° to +100° |
| Left axis deviation (LAD) | More negative than −30° |
| Right axis deviation (RAD) | More positive than +90° to +100° |
Causes of LAD: Left anterior fascicular block, inferior MI, LBBB, LVH
Causes of RAD: RVH, left posterior fascicular block, pulmonary embolism, lateral MI
8. P Waves (Atrial Abnormalities)
- Normal P wave: Upright in I, II, aVF; < 0.12 s duration; < 2.5 mm amplitude
- P mitrale (bifid P in lead II, negative terminal deflection in V1): Left atrial enlargement
- P pulmonale (tall peaked P > 2.5 mm in II, III, aVF): Right atrial enlargement
9. QRS Voltages (Ventricular Hypertrophy)
Left ventricular hypertrophy (LVH):
- S in V1 + R in V5 or V6 > 35 mm (Sokolov-Lyon criterion)
- R in aVL > 11–12 mm
- Often associated with ST-T "strain" changes (downsloping ST depression + T inversion in lateral leads)
Right ventricular hypertrophy (RVH):
- Tall R in V1 (R > S in V1), right axis deviation
- Deep S in V5/V6
10. Precordial R-Wave Progression
- R wave should progressively increase from V1 to V5/V6
- Transition zone (R = S) normally at V3 or V4
- Poor R-wave progression (small R waves through V4): Anterior MI, LBBB, RVH, LVH, technical lead misplacement
- Early transition (tall R in V1/V2): Posterior MI, RVH, WPW
11. Abnormal Q Waves
- Pathological Q waves: ≥ 0.04 s (1 small box) wide AND ≥ 25% of QRS height, or > 1 mm deep
- Indicate prior transmural (Q-wave) MI
- Location of Q waves correlates with territory:
| Q wave leads | Infarct territory |
|---|---|
| V1–V4 | Anterior (LAD) |
| II, III, aVF | Inferior (RCA or LCx) |
| I, aVL, V5–V6 | Lateral (LCx or diagonal) |
| V1–V2 (tall R, no Q) | Posterior (reciprocal change) |
12. ST Segments
- Normal: Isoelectric (flat at baseline), or within ±1 mm of the PR baseline
- ST elevation:
- STEMI: ≥ 1 mm in ≥ 2 contiguous limb leads, or ≥ 2 mm in ≥ 2 contiguous precordial leads
- Other causes: Pericarditis (diffuse saddle-shaped elevation), early repolarization, LV aneurysm, Brugada (coved pattern in V1–V2), vasospasm (Prinzmetal's)
- ST depression:
- Subendocardial ischemia/NSTEMI, LVH strain, digitalis effect (reverse tick/sagging), reciprocal changes in STEMI
13. T Waves
- Normal: Upright in I, II, V3–V6; inverted in aVR; variable in III, V1, V2
- T-wave inversion: Ischemia/infarction, RVH, LVH strain, bundle branch blocks, myocarditis, Wellens' syndrome (deep symmetric T inversions in V2–V3 = critical LAD stenosis)
- Peaked/hyperacute T waves: Early STEMI, hyperkalaemia
- Flat T waves: Hypokalaemia, hypothyroidism
14. U Waves
- Small deflection after the T wave, best seen in V2–V3
- Prominent U waves: Hypokalaemia, bradycardia, drugs (quinidine)
- Inverted U waves: LV volume overload, ischaemia
Summary Mnemonic: "Rate, Rhythm, Axis, P-QRS-T"
| Step | What to check |
|---|---|
| Rate | 60–100 bpm normal |
| Rhythm | Regular? P before every QRS? |
| Axis | −30° to +100° normal |
| P wave | Shape, duration, axis |
| PR interval | 0.12–0.20 s |
| QRS | Width, morphology, voltage |
| QT | Corrected for rate |
| ST | Elevation or depression |
| T wave | Upright, inverted, peaked |
| U wave | Prominent or inverted |
Common Patterns at a Glance
| Pattern | Key ECG Features |
|---|---|
| STEMI | ST elevation in contiguous leads + reciprocal depression |
| NSTEMI/UA | ST depression ± T inversion (no elevation) |
| Atrial fibrillation | Absent P waves, irregularly irregular QRS |
| Complete AV block | P and QRS independent; broad escape rhythm |
| LBBB | Wide QRS, M-shaped R in V5/V6, QS in V1 |
| RBBB | Wide QRS, RSR' in V1, wide S in V6 |
| PE | S1Q3T3 (S in I, Q in III, T inversion in III); sinus tachycardia most common |
| Hyperkalaemia | Peaked T → PR prolongation → wide QRS → sine wave |
| Hypokalaemia | Flat T, prominent U, long QU |
| Digoxin effect | Sagging ST "reverse tick," shortened QT |
| WPW | Short PR, delta wave, wide QRS |
Sources: Harrison's Principles of Internal Medicine, 22nd Ed, Chapter 247 (Goldberger AL); Medical Physiology (Boron & Boulpaep), Chapter 21, Box 21-2
This is a shared conversation. Sign in to Orris to start your own chat.