
Ecg
Reading File
The query "ECG" is broad - it could mean basics, interpretation, specific findings, arrhythmias, etc. Let me clarify before diving in.
Asking for Preferences
What aspect of ECG are you interested in?
I'll provide a comprehensive ECG overview covering the essentials - waves, intervals, systematic interpretation, and key patterns. Let me pull from the medical library.
Searching sources...
Finding Sources
Finding Sources
Finding Sources
Finding Sources
Reading File
Finding Sources
Finding Sources
Finding Sources
Reading File
Reading File
Reading File
I now have rich content from Harrison's and Ganong's. Let me fetch the key ECG diagram images and compile the full answer.
Loading Image
Loading Image
Excellent - I have rich content and images. Here is a comprehensive ECG reference guide:
Electrocardiogram (ECG) - Complete Reference Guide
What is an ECG?
An ECG records the electrical activity of the heart from electrodes placed on the skin. The standard 12-lead ECG uses 10 electrodes to produce 12 views (leads) of cardiac electrical activity. It is the most important non-invasive cardiac diagnostic tool.
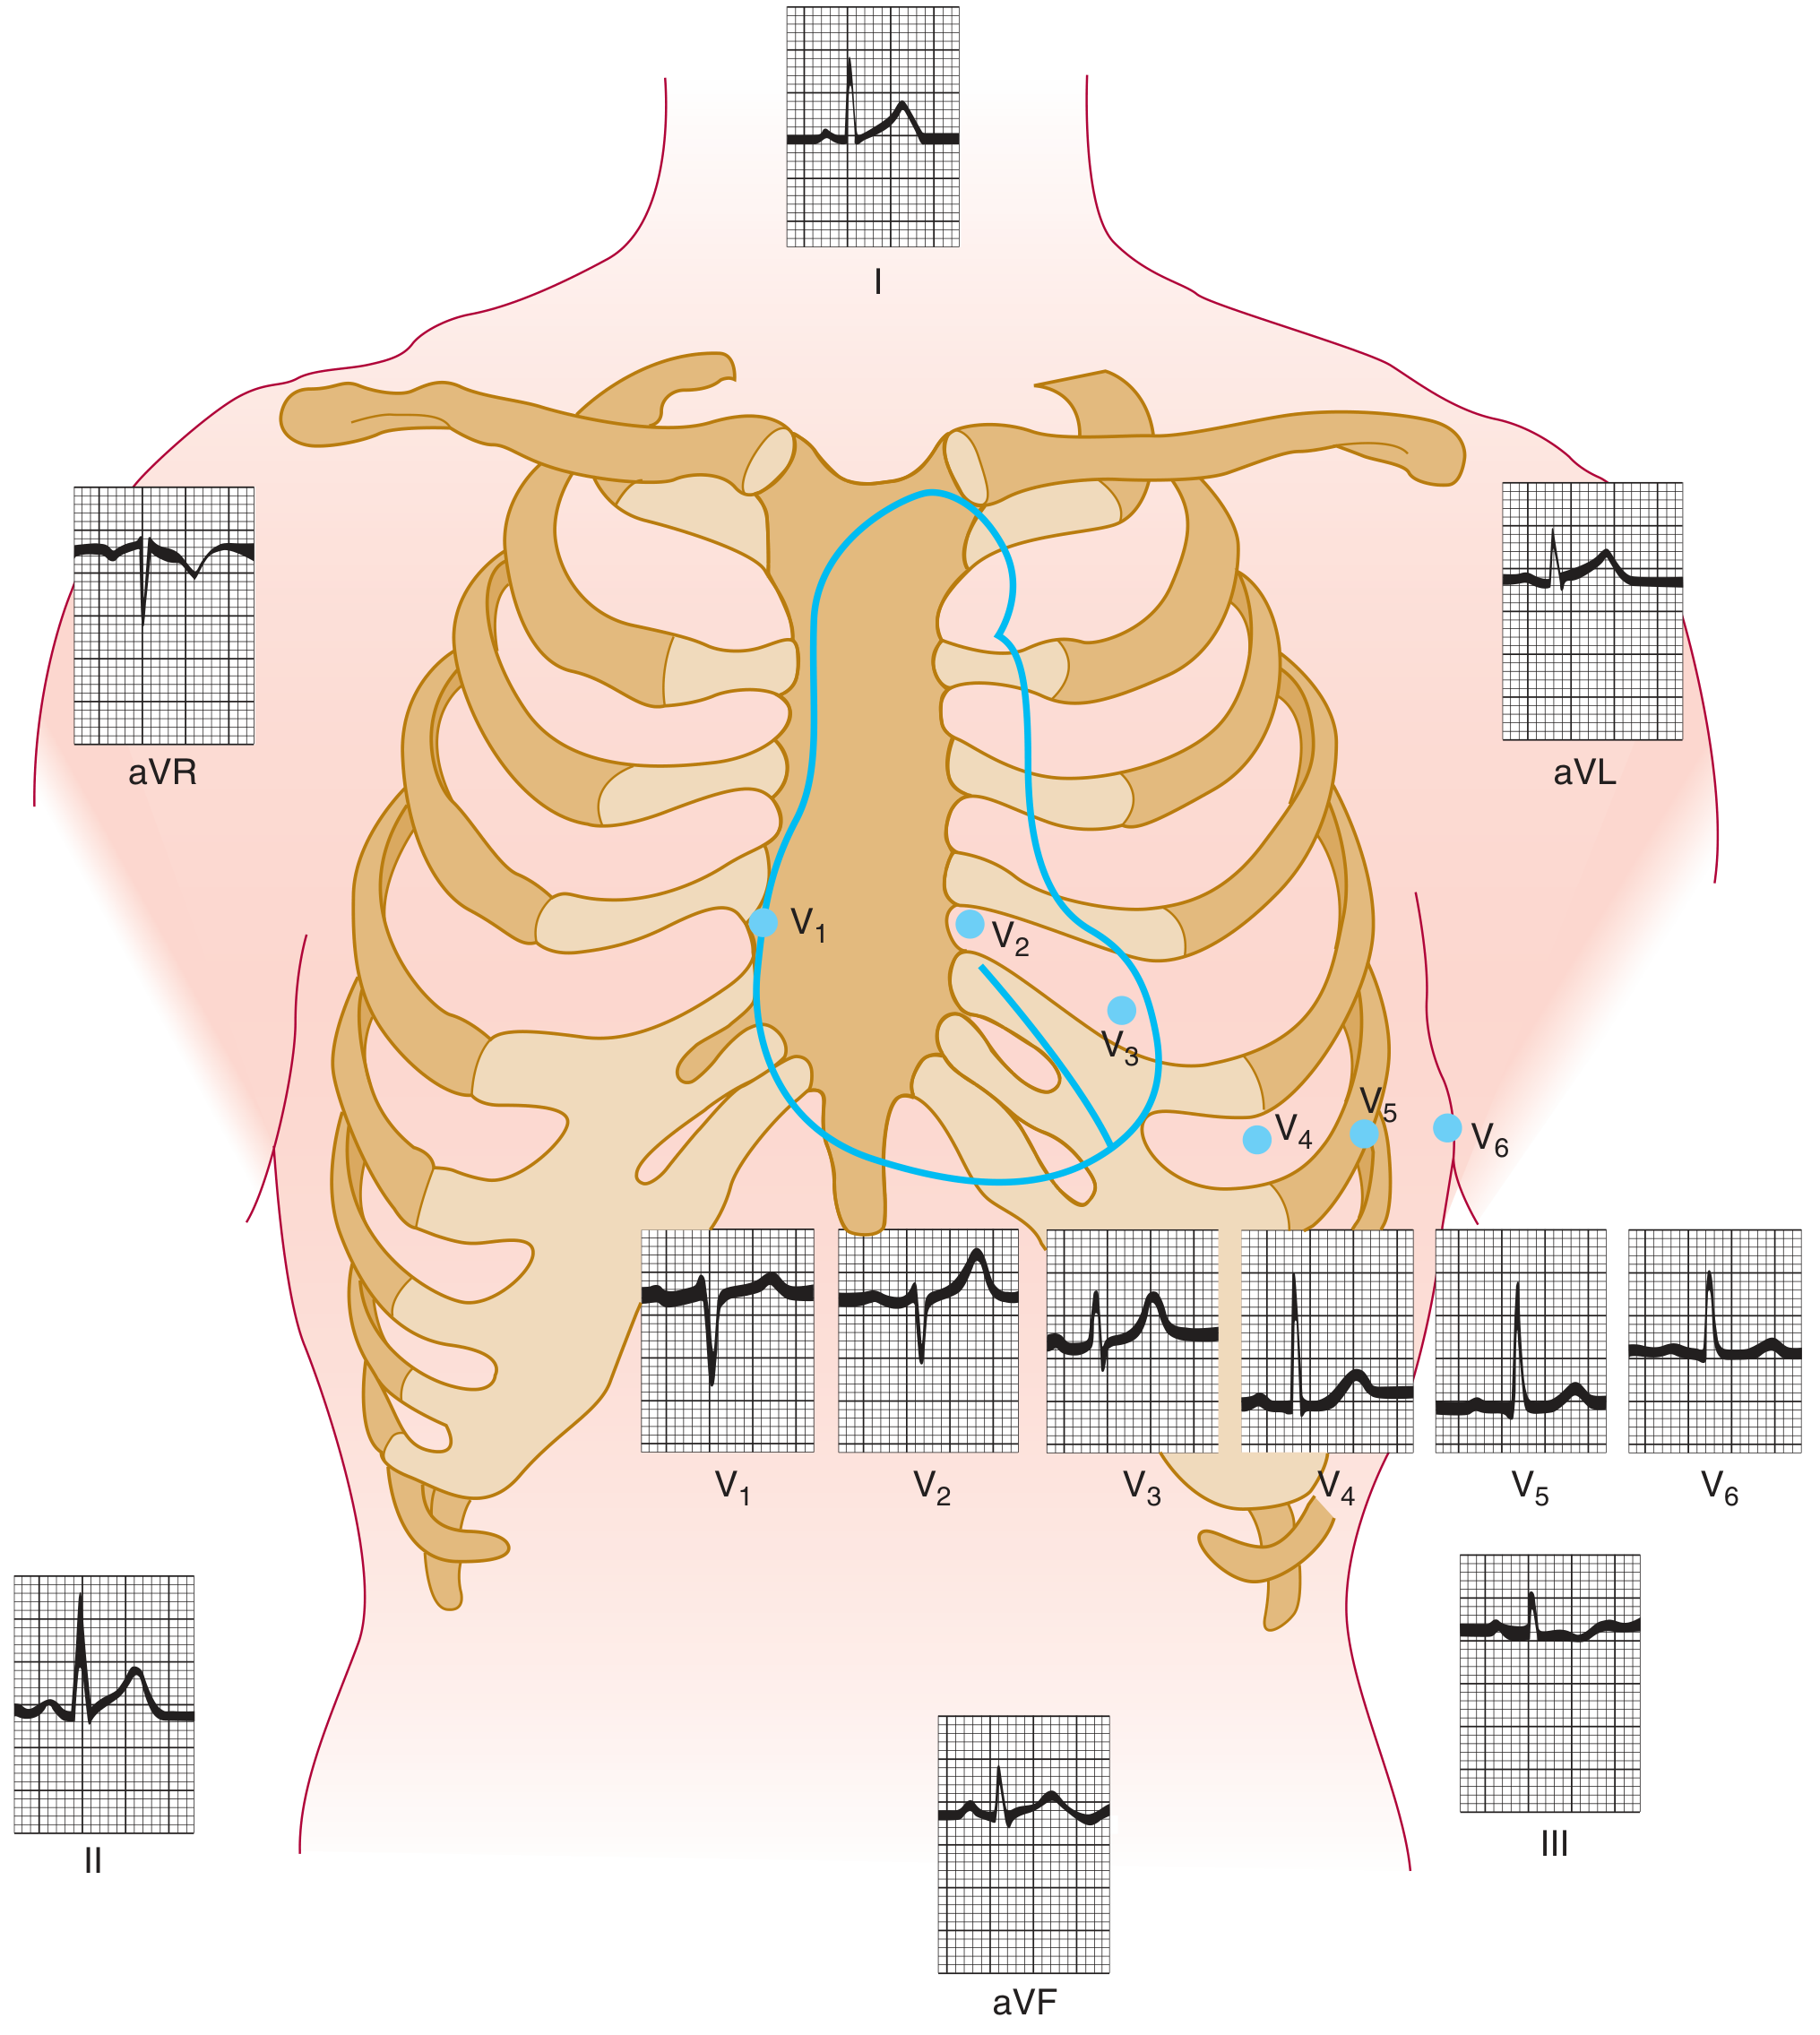
The 12 Leads
Limb leads (frontal plane):
- Bipolar: I, II, III
- Augmented unipolar: aVR, aVL, aVF
Precordial (chest) leads (horizontal plane):
- V1-V6
ECG Paper & Measurements
| Grid | Time | Voltage |
|---|---|---|
| Small square | 0.04 sec | 0.1 mV |
| Large square (5 small) | 0.20 sec | 0.5 mV |
| Standard paper speed | 25 mm/sec | - |
Heart rate calculation:
- Count R-R intervals: HR = 300 ÷ (number of large squares between R waves)
- Or: HR = 1500 ÷ (number of small squares between R waves)
The ECG Waveforms
P Wave
- Represents atrial depolarization (SA node fires → both atria depolarize)
- Normal: positive in lead II, negative in aVR
- Duration: < 0.12 sec (3 small squares)
- Amplitude: < 2.5 mm
PR Interval
- From start of P wave to start of QRS complex
- Represents AV nodal conduction time
- Normal: 0.12-0.20 sec (3-5 small squares)
- Prolonged PR > 0.20 sec = 1st degree AV block
QRS Complex
- Represents ventricular depolarization
- Normal duration: 0.06-0.10 sec (< 3 small squares)
- Wide QRS (>0.12 sec) = bundle branch block or ventricular origin
- Q wave: initial negative deflection (small septal q waves normal in V5, V6)
- R wave: first positive deflection
- S wave: negative deflection after R wave
ST Segment
- From end of QRS (J-point) to start of T wave
- Should be isoelectric (flat, on the baseline)
- Elevation suggests: STEMI, pericarditis, Brugada syndrome
- Depression suggests: ischemia, posterior MI, digoxin effect
T Wave
- Represents ventricular repolarization
- Should be in same direction as QRS in most leads
- Normal: upright in I, II, V3-V6; inverted in aVR
- Peaked T waves: hyperkalemia
- Flat/inverted: ischemia, hypertrophy, electrolyte disturbances
QT Interval
- From start of QRS to end of T wave
- Represents total ventricular depolarization + repolarization
- Must be corrected for heart rate (QTc using Bazett formula: QTc = QT / √R-R)
- Normal QTc: < 440 ms (men), < 460 ms (women)
- Prolonged QT: risk of Torsades de Pointes
U Wave
- Small wave after T wave, best seen in V2-V3
- Significance: prominent U waves seen in hypokalemia
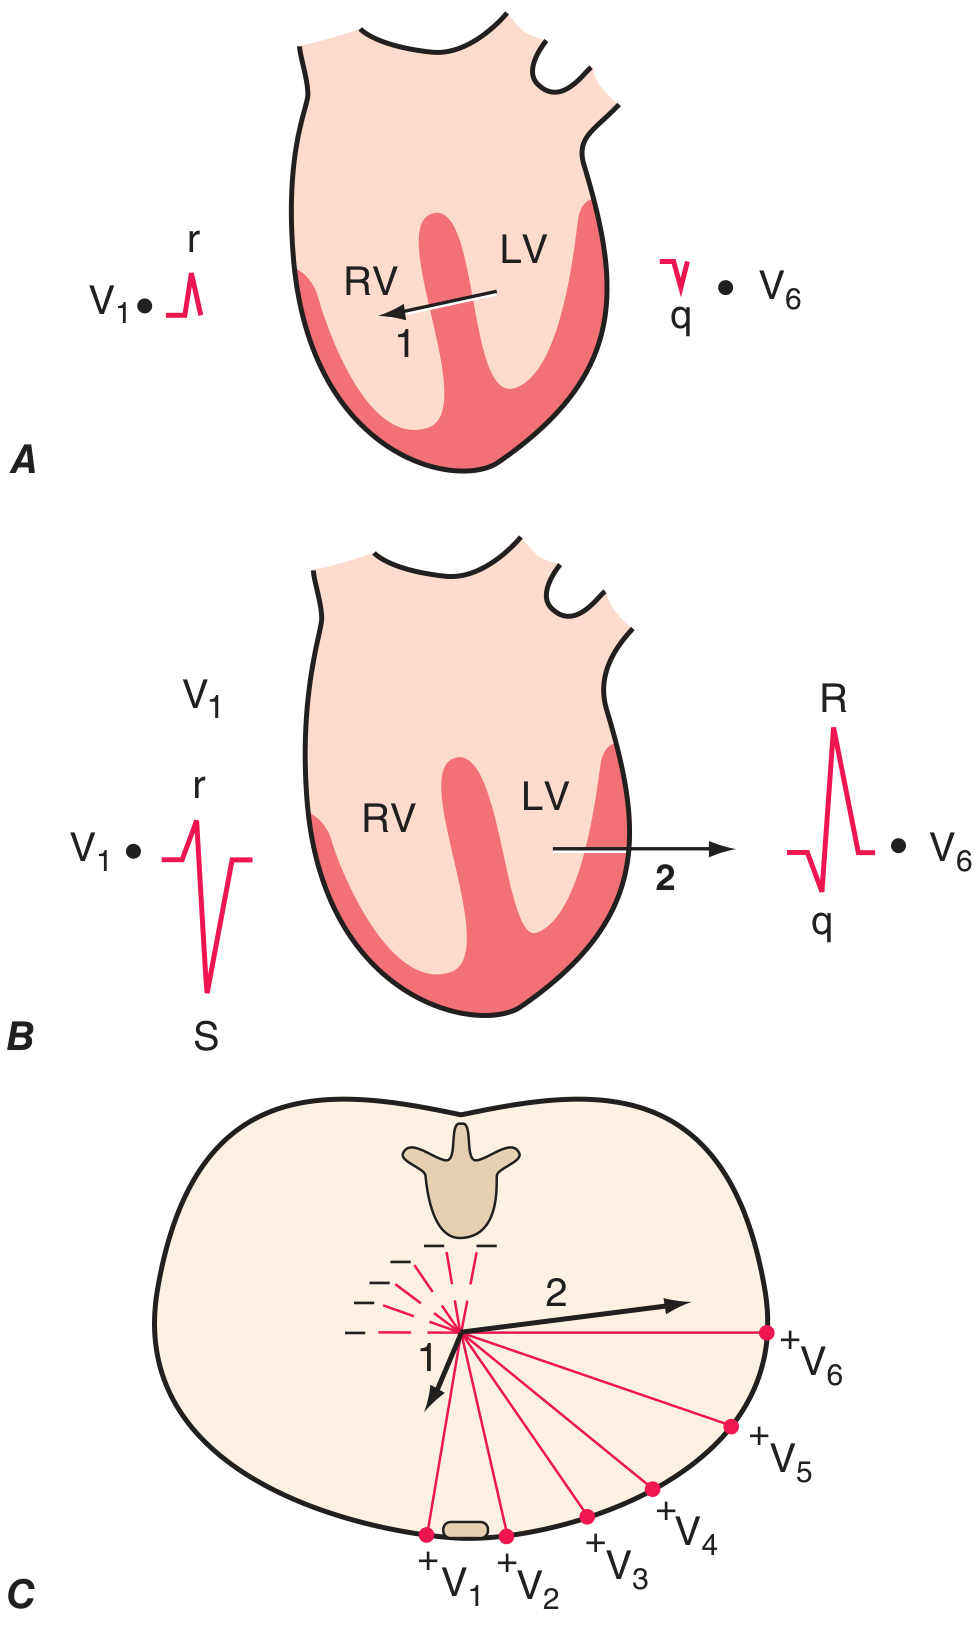
Ventricular Depolarization Vectors
Normal ECG - Systematic Approach (7 Steps)
| Step | What to Assess |
|---|---|
| 1. Rate | Bradycardia (<60), Normal (60-100), Tachycardia (>100) |
| 2. Rhythm | Regular vs irregular; P before every QRS? |
| 3. Axis | Normal: -30° to +90° |
| 4. P wave | Morphology, PR interval |
| 5. QRS | Duration, morphology, R-wave progression |
| 6. ST/T wave | Elevation, depression, T-wave changes |
| 7. QT interval | Calculate QTc |
Axis Determination
| Axis | Lead I | aVF |
|---|---|---|
| Normal (-30° to +90°) | Positive | Positive |
| Left axis deviation (< -30°) | Positive | Negative |
| Right axis deviation (> +90°) | Negative | Positive |
| Extreme axis ("northwest") | Negative | Negative |
Causes of left axis deviation: Left anterior fascicular block, inferior MI, LVH
Causes of right axis deviation: RVH, left posterior fascicular block, PE, lateral MI
Key Pathological Patterns
Bundle Branch Blocks
- RBBB: RSR' ("M" pattern) in V1, wide S in I and V6; QRS > 0.12 sec
- LBBB: broad notched R in I, V5, V6; QS in V1; no septal q waves; QRS > 0.12 sec
- Mnemonic: WiLLiaM MaRRoW (LBBB = W in V1, M in V6; RBBB = M in V1, W in V6)
Myocardial Infarction (STEMI)
| Territory | ST Elevation Leads | Culprit Artery |
|---|---|---|
| Anterior | V1-V4 | LAD |
| Inferior | II, III, aVF | RCA (or LCx) |
| Lateral | I, aVL, V5-V6 | LCx |
| Posterior | ST depression V1-V3 (reciprocal) | RCA/LCx |
Evolution of MI on ECG:
- Hyperacute T waves (minutes)
- ST elevation (hours)
- Q wave development (hours-days)
- T-wave inversion (days-weeks)
- Q waves may persist permanently
Chamber Enlargement/Hypertrophy
| Finding | ECG Pattern |
|---|---|
| Right atrial overload (P pulmonale) | Peaked P waves > 2.5 mm, best in II |
| Left atrial abnormality (P mitrale) | Broad notched P waves; biphasic P in V1 (negative component > 1 mm²) |
| LVH (Sokolow-Lyon) | SV1 + RV5 or RV6 > 35 mm |
| RVH | Dominant R in V1 (R > S), right axis deviation |
Arrhythmias (Quick Reference)
| Arrhythmia | Key Features |
|---|---|
| Sinus tachycardia | Rate >100, P before every QRS, normal morphology |
| Sinus bradycardia | Rate <60, otherwise normal |
| Atrial fibrillation | Absent P waves, irregularly irregular R-R, fibrillatory baseline |
| Atrial flutter | Sawtooth flutter waves ~300 bpm, usually 2:1 or 3:1 block |
| SVT (AVNRT) | Narrow complex tachycardia, P waves hidden in or just after QRS |
| 1° AV block | PR > 0.20 sec, every P followed by QRS |
| 2° AV block Mobitz I (Wenckebach) | Progressive PR lengthening until dropped beat |
| 2° AV block Mobitz II | Constant PR, then sudden dropped QRS |
| 3° AV block (complete) | No relation between P and QRS; escape rhythm present |
| VT | Wide complex tachycardia (QRS > 0.12), AV dissociation |
| VF | Chaotic, no organized complexes - emergency |
Electrolyte Effects
- Hyperkalemia: peaked T waves → wide QRS → sine wave → VF
- Hypokalemia: flat T waves, prominent U waves, QT prolongation
- Hypercalcemia: short QT
- Hypocalcemia: long QT
Common Clinical ECG Patterns
| Condition | ECG Finding |
|---|---|
| Pulmonary embolism | S1Q3T3, sinus tachycardia, new RBBB |
| Pericarditis | Diffuse saddle-shaped ST elevation, PR depression |
| Digitalis toxicity | ST scooping ("digitalis effect"), arrhythmias |
| Wolff-Parkinson-White | Short PR, delta wave, wide QRS |
| Brugada syndrome | RBBB morphology + coved ST elevation V1-V2 |
| Long QT syndrome | QTc > 440-460 ms, risk of Torsades |
| Hypothermia | Osborn (J) waves, bradycardia |
Sources: Harrison's Principles of Internal Medicine, 22e (2025) - Chapter 247; Ganong's Review of Medical Physiology, 26e; Braunwald's Heart Disease, 2 Vol Set
This is a broad overview. Let me know if you want to go deeper on any specific area - arrhythmia interpretation, MI localization, bundle branch blocks, pediatric ECG norms, or anything else.
This is a shared conversation. Sign in to Orris to start your own chat.