
ECG
Reading File
The query "ECG" is quite broad. Let me clarify what you need before diving in.
Asking for Preferences
What aspect of ECG are you looking for?
All of these
Finding Sources
Finding Sources
Reading File
Finding Sources
Finding Sources
Reading File
Reading File
Reading File
Reading File
Reading File
Finding Sources
Now let me fetch the key ECG images and get the full QRS/interval content:
Loading Image
Loading Image
Loading Image
Loading Image
Finding Sources
Finding Sources
Reading File
Loading Image
ECG (Electrocardiogram) - Comprehensive Guide
1. What is an ECG?
The ECG (or EKG) records tiny potential differences on the body surface that reflect the electrical activity of the heart. Because different parts of the myocardium depolarize and repolarize in a specific sequence (atria before ventricles; His-Purkinje system conducting ventricular activation rapidly), a pattern of voltage changes is detectable at the skin. - Costanzo Physiology 7th Ed.
2. The 12-Lead ECG
A standard 12-lead ECG uses 10 electrodes to produce 12 different views of cardiac electrical activity. - Roberts and Hedges' Clinical Procedures in Emergency Medicine
Limb leads (frontal plane)
| Lead | Type | Positive Pole |
|---|---|---|
| I | Bipolar | Left arm |
| II | Bipolar | Left leg |
| III | Bipolar | Left leg (vs. LA) |
| aVR | Unipolar | Right arm |
| aVL | Unipolar | Left arm |
| aVF | Unipolar | Left leg |
Precordial leads (horizontal/transverse plane)
- V1-V2: Right side of heart / interventricular septum
- V3-V4: Anterior wall
- V5-V6: Lateral wall
ECG paper: At standard 25 mm/sec, each small box = 0.04 sec (40 ms), each large box = 0.20 sec (200 ms). Standard amplitude = 10 mm/mV.
Lead placement importance: Incorrect lead placement can mimic pathology and trigger unnecessary workup. The image below shows how LL position affects tracing morphology:
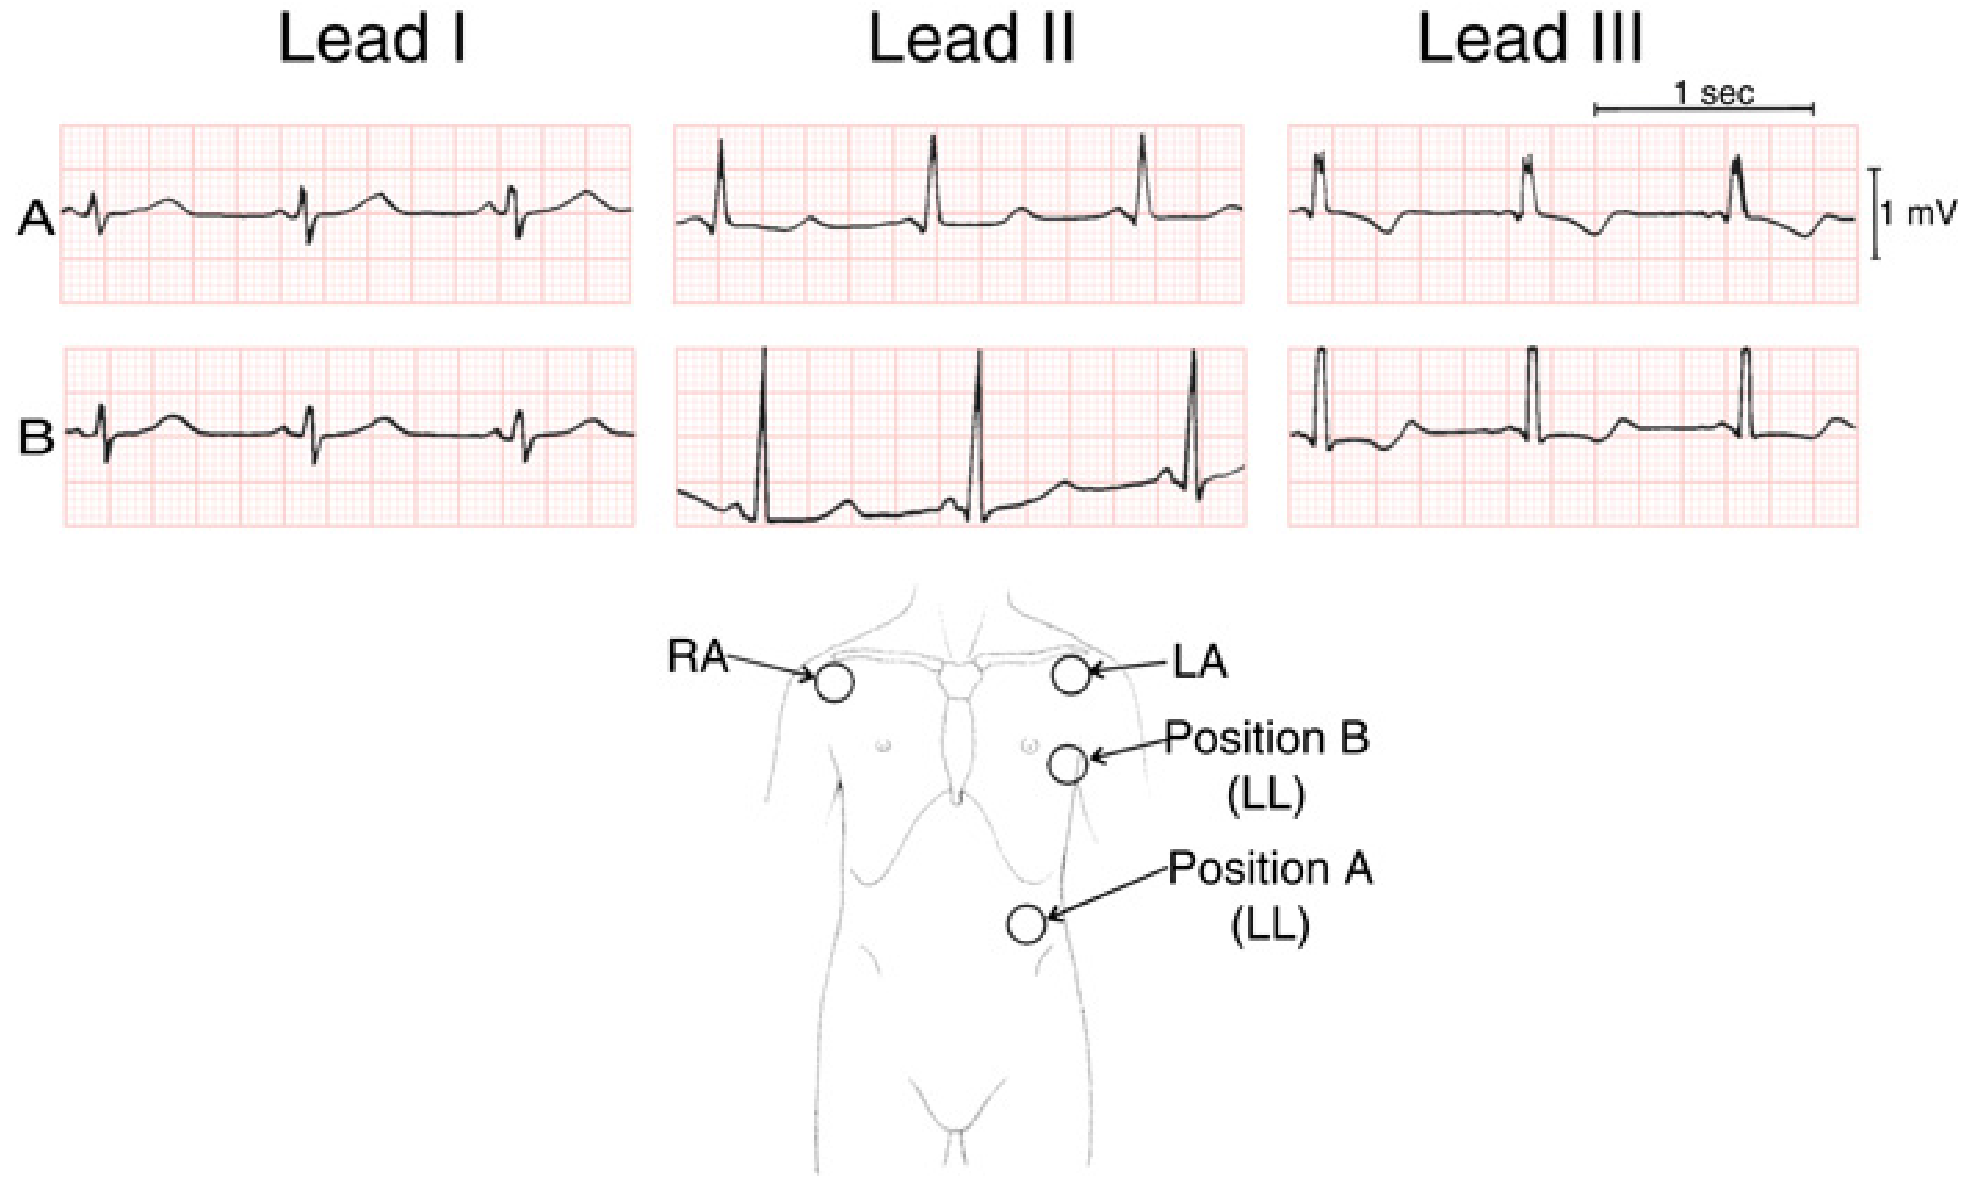
3. Normal ECG Waveforms and Intervals

Fig. Normal ECG measured from Lead II - Costanzo Physiology 7th Ed.
Waves
| Component | Represents | Notes |
|---|---|---|
| P wave | Atrial depolarization | Duration reflects atrial conduction time. Atrial repolarization is buried in the QRS. |
| QRS complex | Ventricular depolarization | Q = initial septal, R = main ventricular, S = basal. Duration ~80-100 ms. Fast despite large mass due to His-Purkinje system. |
| T wave | Ventricular repolarization | Normally upright in most leads |
| U wave | (if present) | Slow repolarization of Purkinje fibers; prominent in hypokalemia |
Intervals & Segments
| Measurement | Normal | What it Reflects |
|---|---|---|
| PR interval | 120-200 ms (≤160 ms typical) | Atrial depolarization + AV node conduction time |
| PR segment | Isoelectric | AV node delay alone |
| QRS duration | <120 ms | Ventricular conduction |
| ST segment | Isoelectric | Ventricular plateau phase - elevation or depression = pathology |
| QT interval | <440 ms (corrected for HR) | Total ventricular repolarization time; prolonged = arrhythmia risk |
Key rule: Intervals include waves; segments do not.
4. Autonomic Effects on the ECG
- Sympathetic stimulation (norepinephrine, beta-1): increases If (funny current) in SA node → faster phase 4 depolarization → shorter PR interval, faster heart rate
- Parasympathetic stimulation (acetylcholine, M2 receptors): decreases If, opens K+-Ach channels, hyperpolarizes SA node → longer PR interval, slower heart rate
5. ECG in Specific Conditions
5a. Myocardial Infarction (STEMI)
Regional ST Elevation - leads affected indicate the culprit territory: - Rosen's Emergency Medicine
| MI Location | Affected Leads | Artery |
|---|---|---|
| Anterior | V1-V4 | LAD |
| Anterolateral | V2-V6, I, aVL | LAD/LCx |
| Lateral | I, aVL, V5, V6 | LCx |
| Inferior | II, III, aVF | RCA |
| Right ventricular | V3R-V6R (V4R most sensitive) | RCA |
| Posterior | V8, V9 elevation; V1-V3 depression, tall R in V1-V2 | RCA/LCx |
Anterior STEMI (V1-V4):
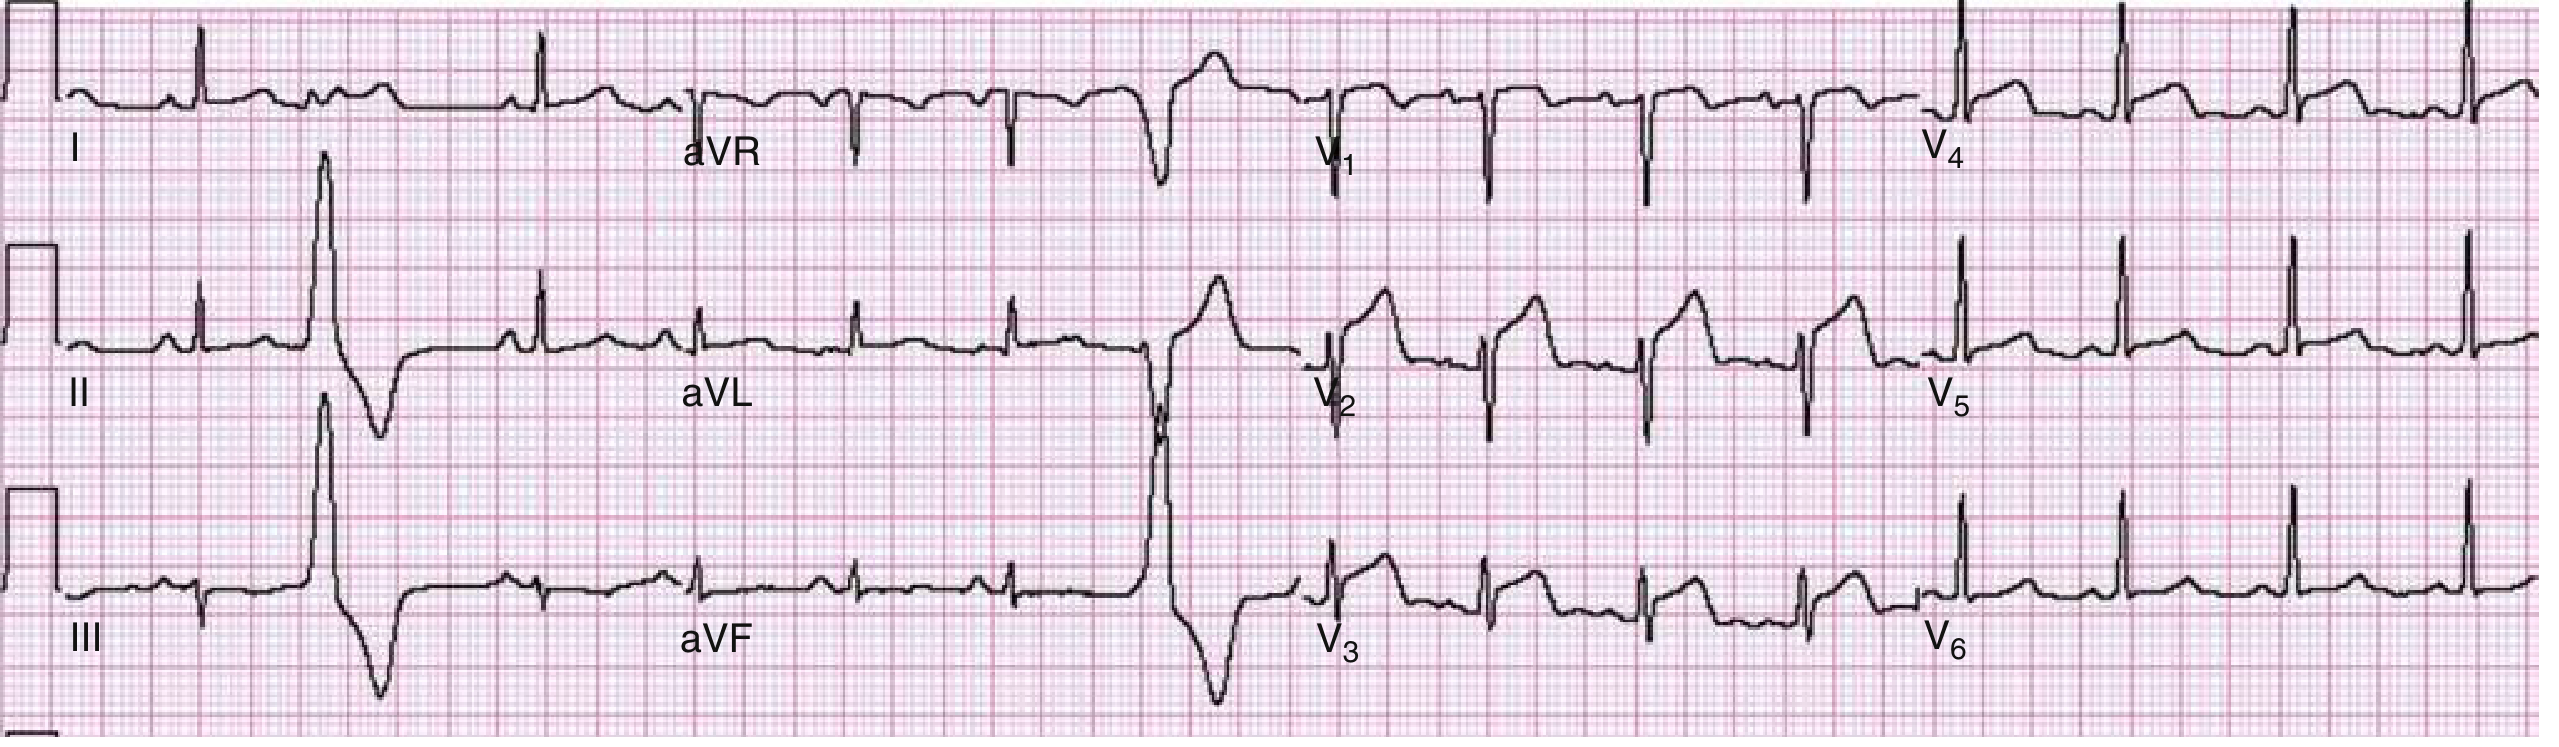
Fig. Anterior wall STEMI with ST elevation V1-V4. LAD stenosis confirmed on catheterization. - Rosen's Emergency Medicine
Anterolateral STEMI (V2-V6, I, aVL):
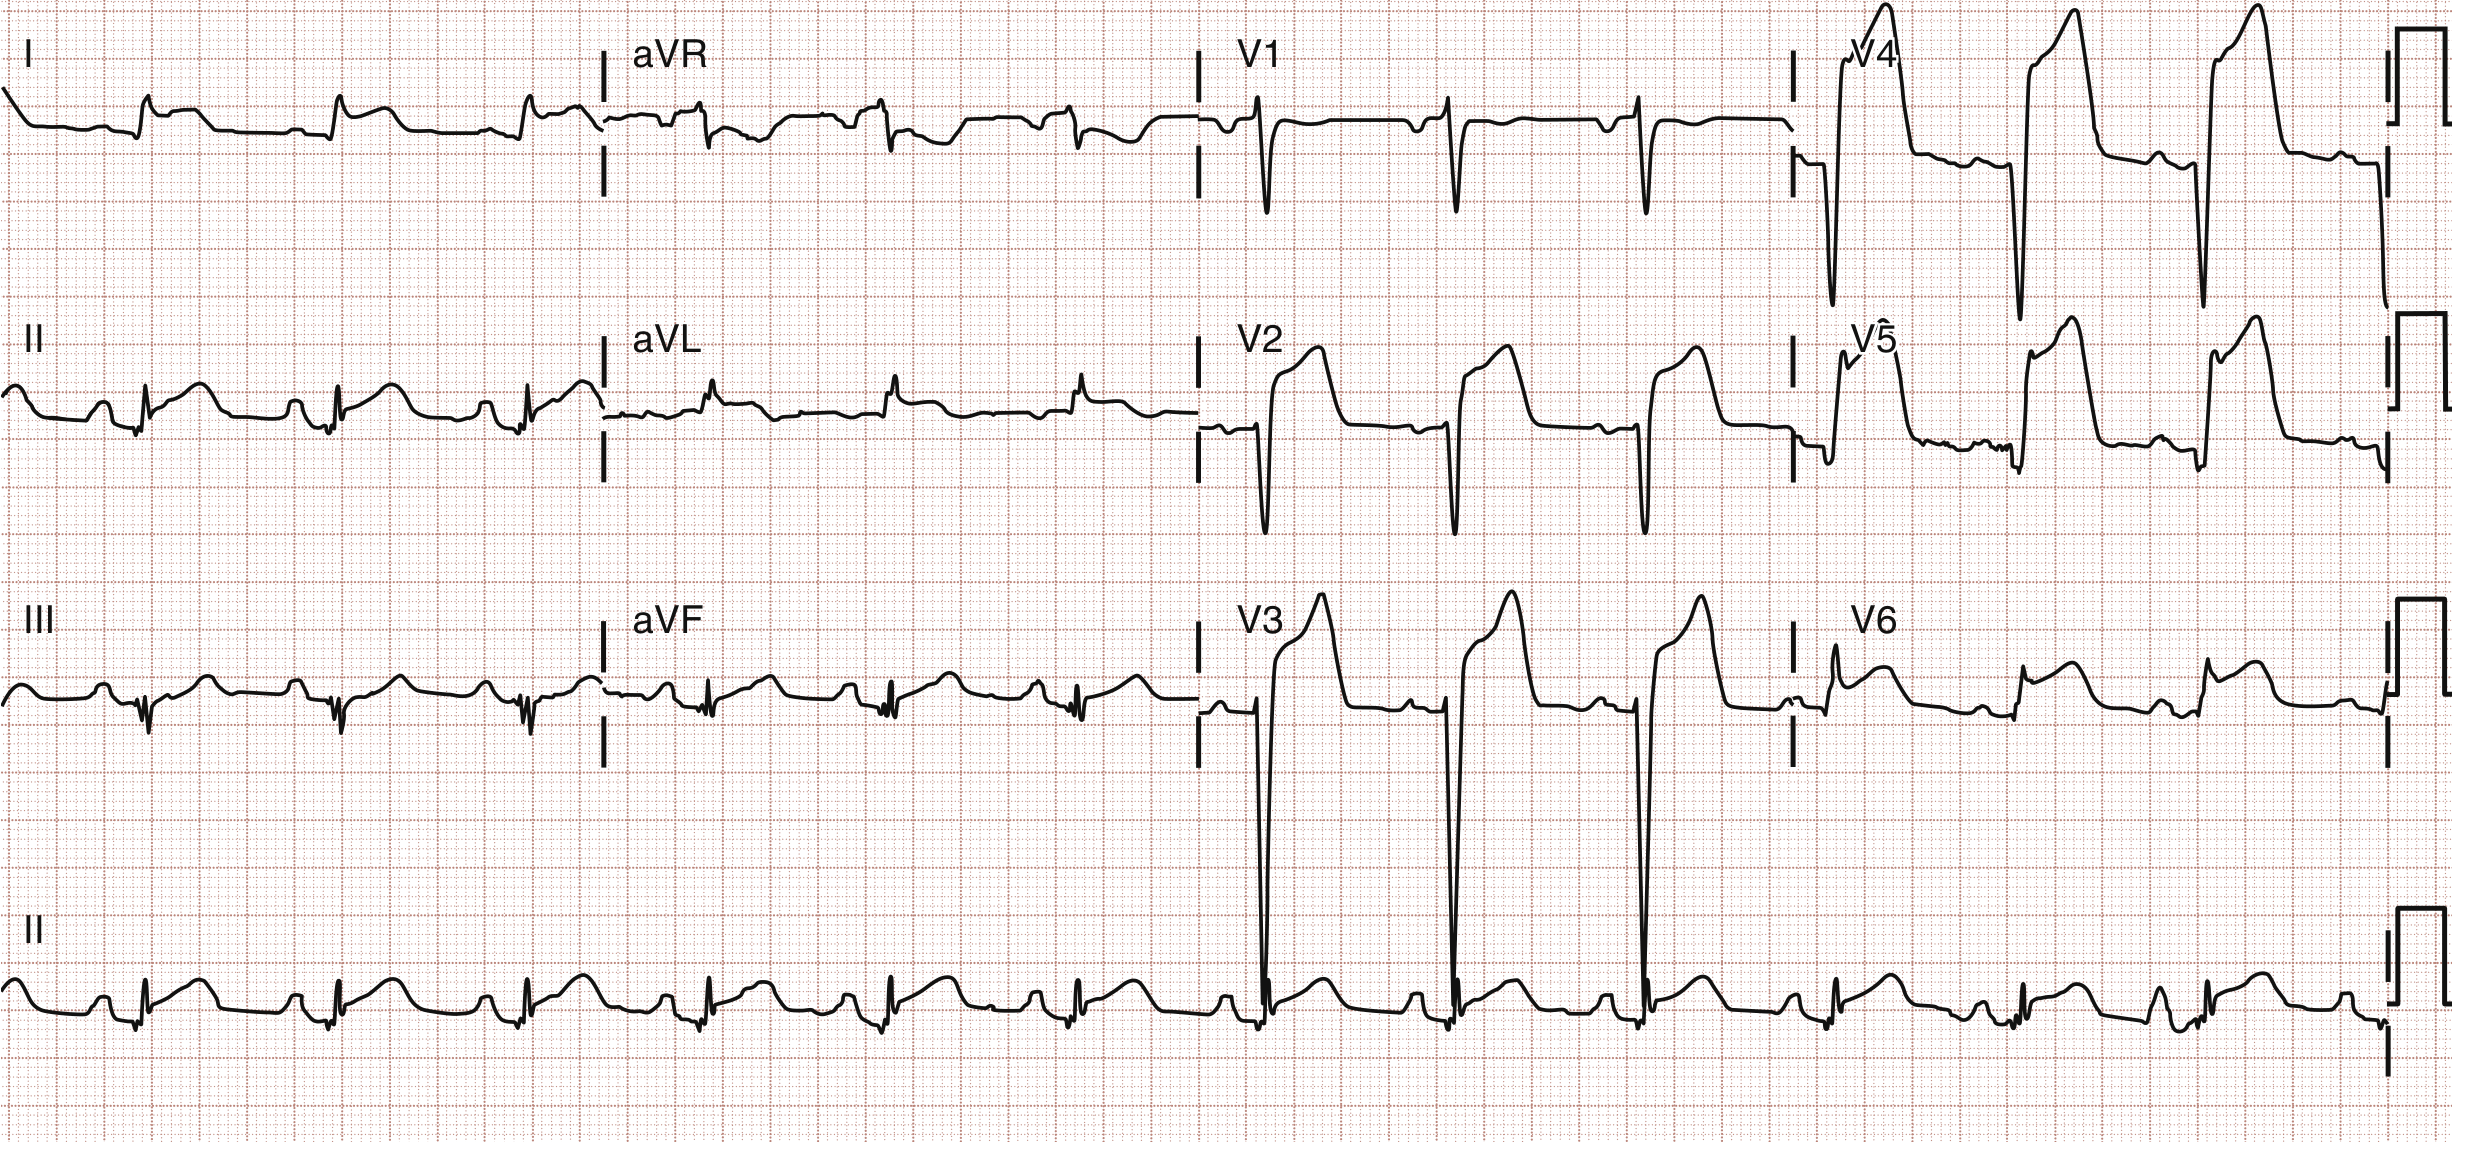
Fig. Anterolateral STEMI with in-stent thrombosis confirmed. - Rosen's Emergency Medicine
Posterior MI signs on standard leads: horizontal ST depression + upright T wave + tall wide R wave + R:S ratio >1 in V1-V3 (mirror image of posterior Q wave).
STEMI mimics: LBBB, LVH, Brugada pattern, pericarditis, early repolarization - must be differentiated.
5b. Arrhythmias
Origin-based classification (from Robbins Basic Pathology):
- Supraventricular - originate at or above AV node
- Ventricular - originate in ventricular myocardium
Common arrhythmia types:
| Arrhythmia | ECG Features | Notes |
|---|---|---|
| Sinus tachycardia | Normal P-QRS-T, HR >100 | Most common supraventricular |
| Atrial fibrillation | No P waves, irregularly irregular R-R | From atrial dilation/irritability; stretch-sensitive ion channels |
| Atrial flutter | Sawtooth flutter waves ~300/min | Reentry in RA |
| SVT (AVNRT/AVRT) | Narrow complex, rapid, regular | May have retrograde P waves |
| Ventricular tachycardia | Wide complex (>120 ms), regular | Dangerous if sustained |
| Ventricular fibrillation | Chaotic, no recognizable complexes | Cardiac arrest |
| Asystole | Flat line | No electrical activity |
5c. Heart Blocks (AV Blocks)
| Degree | ECG Pattern | Clinical Meaning |
|---|---|---|
| 1st degree | PR interval >200 ms, every P conducts | Asymptomatic AV node slowing |
| 2nd degree - Mobitz I (Wenckebach) | Progressively lengthening PR until P drops | Usually benign; AV node disease |
| 2nd degree - Mobitz II | Fixed PR, then sudden non-conducted P | More serious; infranodal disease |
| 3rd degree (complete) | P waves and QRS completely dissociated | AV node or His-bundle failure |
5d. Bundle Branch Blocks
- RBBB: rSR' pattern ("M-shape") in V1; may be congenital or from organic heart disease. Wide QRS (>120 ms).
- LBBB: Wide QRS, broad notched R in I, aVL, V5-V6; new LBBB in ischemic context = equivalent to STEMI changes.
- Preexisting BBB causes false-positive stress test results due to baseline ST changes.
5e. Long QT Syndrome
- Defined as QTc >440 ms; caused by mutations in cardiac ion channel genes (most commonly KCNQ1, encoding a K+ channel)
- Risk: Torsades de Pointes (TdP) - polymorphic VT that can degenerate to VF
- Acquired causes: drugs (antiarrhythmics, antibiotics, antipsychotics), electrolyte disturbances (hypokalemia, hypomagnesemia)
- Congenital syndromes: Romano-Ward (autosomal dominant), Jervell-Lange-Nielsen (with congenital deafness)
- TdP is characteristically preceded by a PVC after a long-short cycle sequence
5f. Preexcitation - Wolff-Parkinson-White (WPW)
ECG in sinus rhythm shows:
- Shortened PR interval (<120 ms)
- Delta wave (slurred upstroke of QRS)
- Widened QRS
This results from conduction via an accessory pathway (Bundle of Kent) bypassing the AV node.
Preexcited AF in WPW is a medical emergency - can conduct rapidly to ventricles:
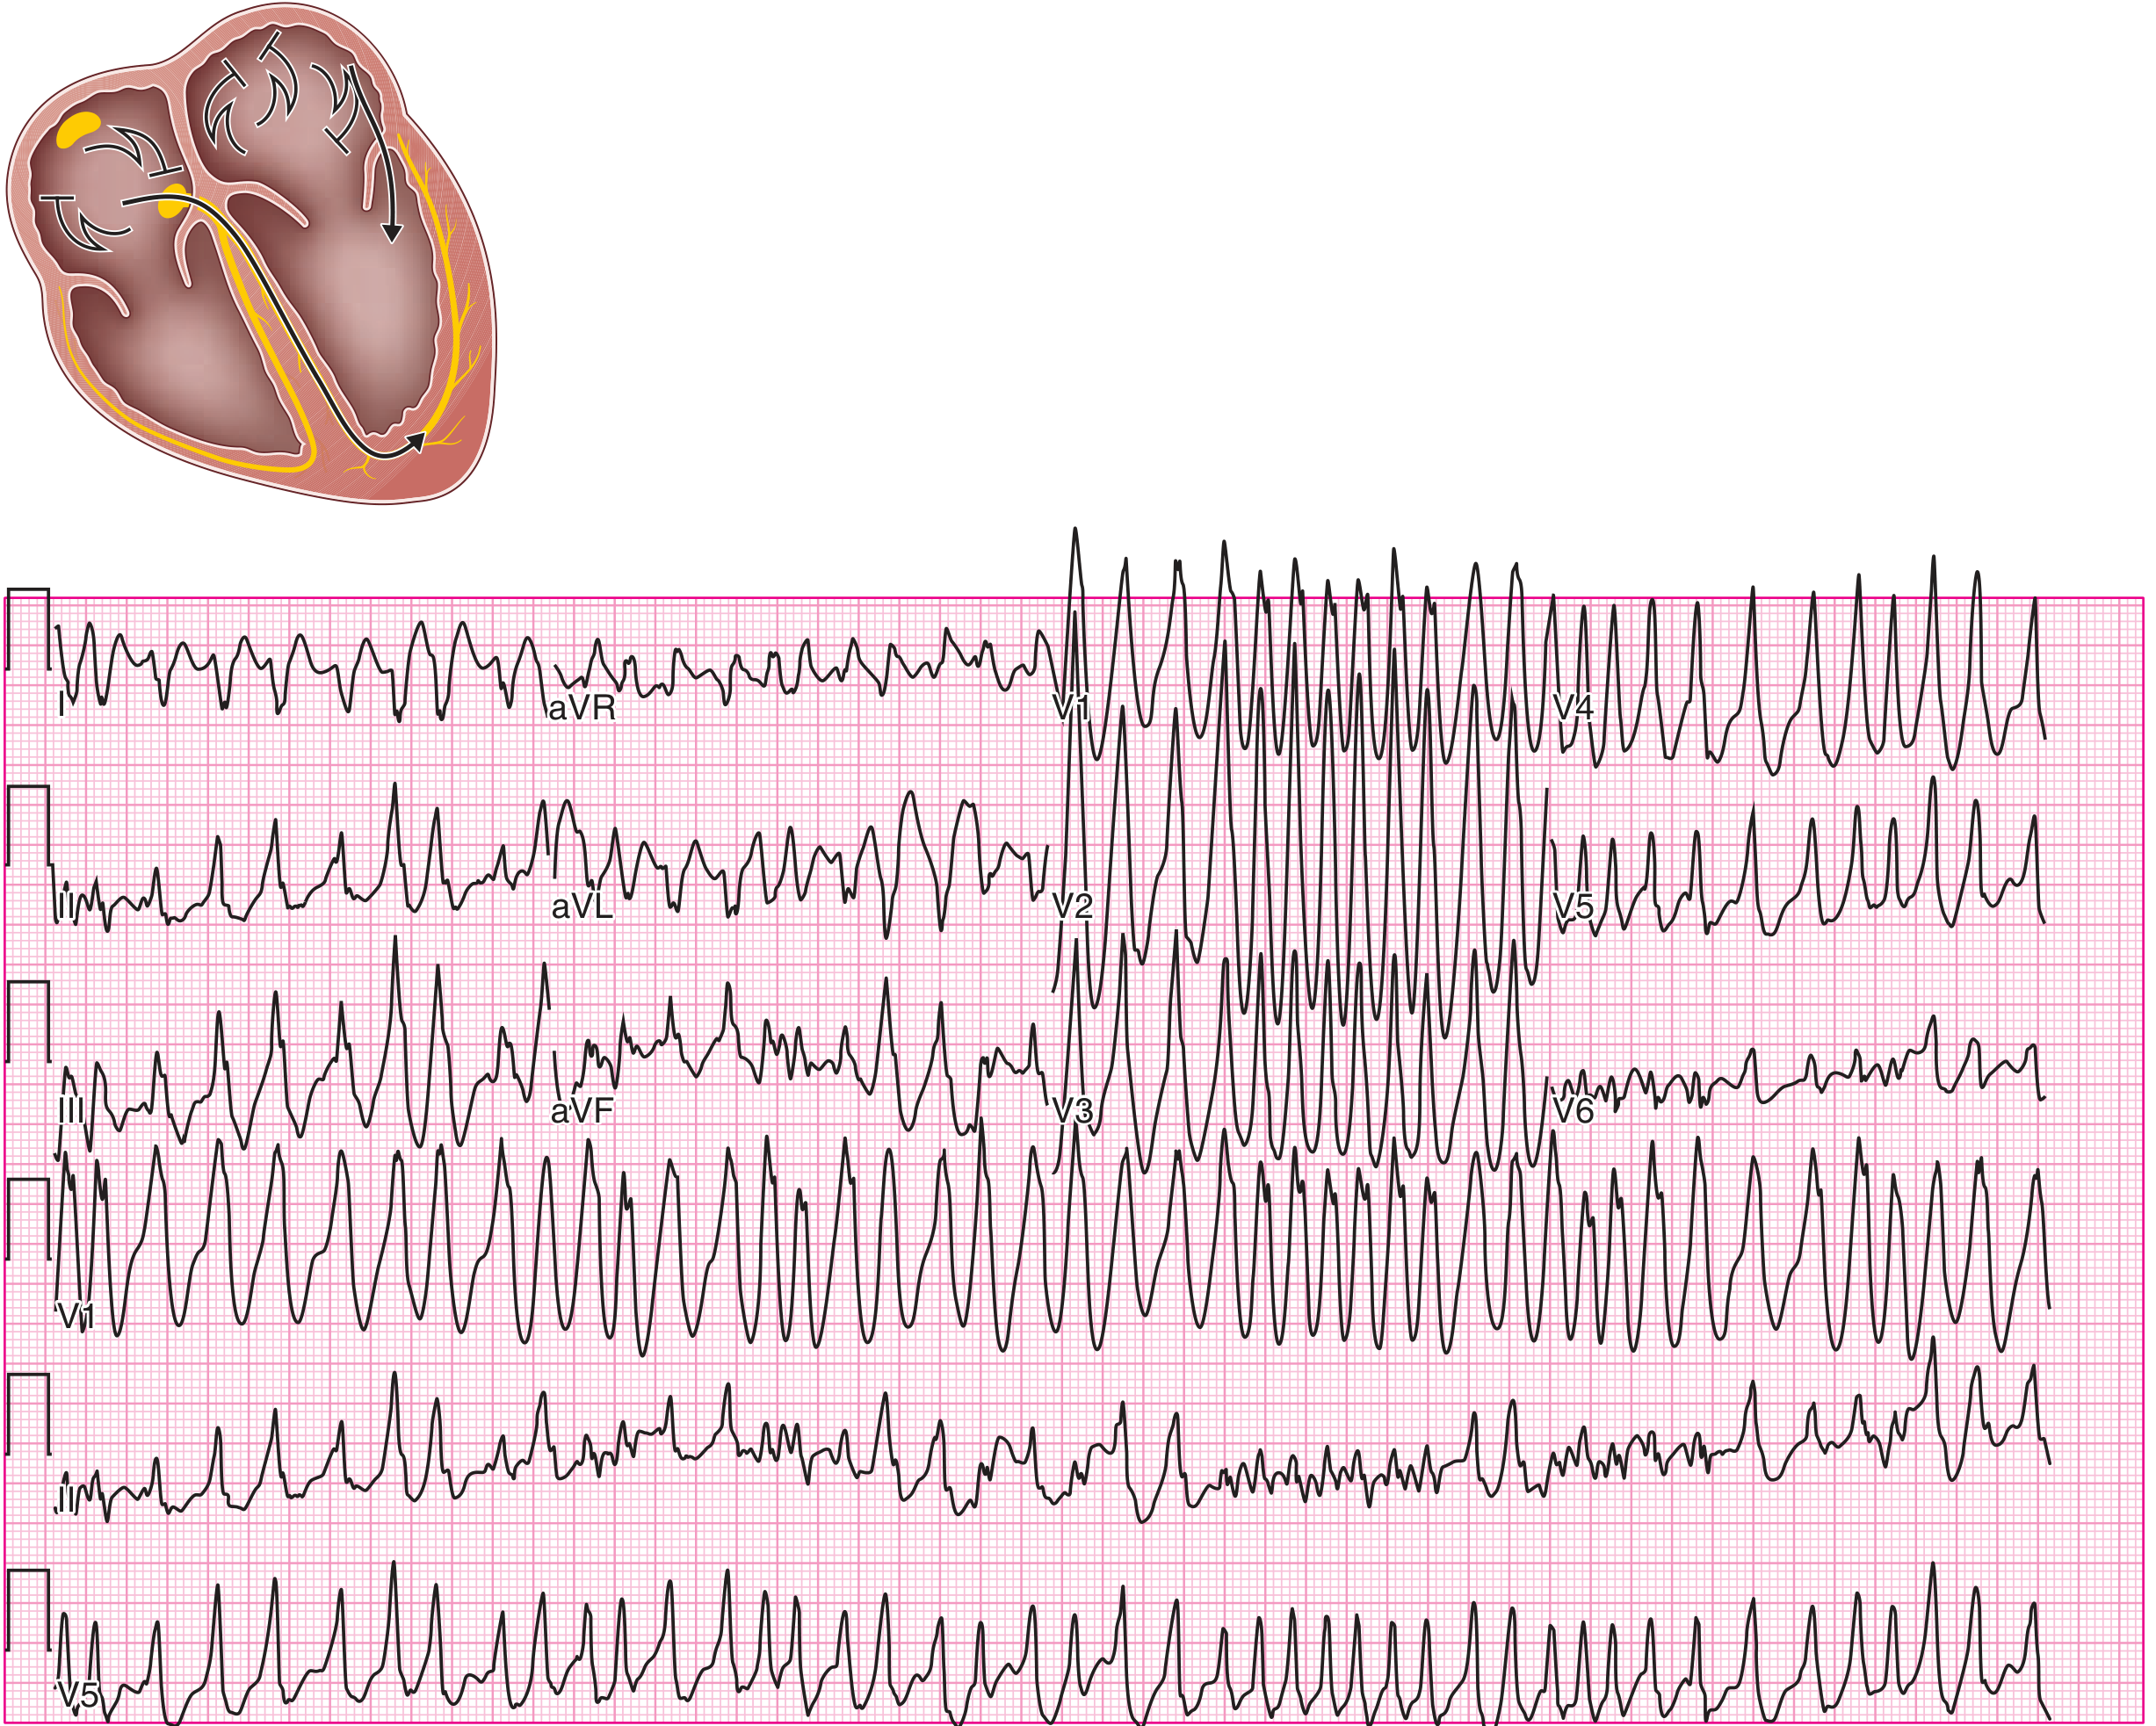
Fig. Preexcited AF in WPW - rapid irregular wide-complex tachycardia. AV-nodal blockers (adenosine, verapamil, digoxin) are CONTRAINDICATED as they can accelerate conduction via the bypass tract. - Harrison's Principles of Internal Medicine 22E
5g. Pulmonary Embolism
Classic ECG signs (non-specific, seen in large PE):
- HR >100
- T-wave inversion V1-V4
- Incomplete or complete RBBB
- S1Q3T3 pattern: S wave in lead I, Q wave in lead III, T-wave inversion in lead III
6. Systematic ECG Reading Approach
A structured approach prevents errors:
- Rate: Count R-R intervals. Large boxes: 300 ÷ number of large boxes between R waves
- Rhythm: Regular or irregular? P before every QRS?
- Axis: Normal axis -30° to +90°. Check leads I and aVF
- P waves: Present? Morphology? One per QRS?
- PR interval: Normal (120-200 ms)? Constant?
- QRS duration: Narrow (<120 ms) or wide (>120 ms)?
- ST segment: Elevation or depression? Which leads?
- T waves: Upright? Inverted? Peaked?
- QT interval: Prolonged?
- Compare to prior ECGs whenever available
Sources: Costanzo Physiology 7th Ed., Rosen's Emergency Medicine, Roberts and Hedges' Clinical Procedures in Emergency Medicine, Harrison's Principles of Internal Medicine 22E, Robbins Basic Pathology, Braunwald's Heart Disease, Tintinalli's Emergency Medicine, Goldman-Cecil Medicine
ECG all details
Finding Sources
Finding Sources
Finding Sources
Reading File
Finding Sources
Finding Sources
Reading File
Finding Sources
Finding Sources
Reading File
Finding Sources
Reading File
Reading File
Reading File
Finding Sources
Now let me fetch all critical ECG images in parallel:
Loading Image
Loading Image
Loading Image
Loading Image
Loading Image
Loading Image
Reading File
Loading Image
ECG - Complete Reference Guide
Sources: Costanzo Physiology 7th Ed., Roberts & Hedges' Clinical Procedures in Emergency Medicine, Rosen's Emergency Medicine, Braunwald's Heart Disease, Harrison's Principles of Internal Medicine 22E, Tintinalli's Emergency Medicine, Goldman-Cecil Medicine, Fuster & Hurst's The Heart 15th Ed., Robbins Basic Pathology, Katzung Pharmacology 16th Ed.
PART 1: FUNDAMENTALS
What Is an ECG?
The electrocardiogram (ECG or EKG) records potential differences on the body surface caused by the sequential depolarization and repolarization of the myocardium. Because the atria depolarize before ventricles, and each chamber activates in a defined sequence via the His-Purkinje system, a predictable electrical pattern is detectable at skin electrodes. - Costanzo Physiology 7th Ed.
The Conduction System (Basis of the ECG)
| Structure | Function | Rate if Pacemaker |
|---|---|---|
| SA node | Primary pacemaker; phase 4 spontaneous depolarization | 60-100 bpm |
| AV node | Delays conduction to ventricles (PR segment) | 40-60 bpm |
| Bundle of His | Rapid conduction to ventricles | 40-60 bpm |
| Left/Right Bundle Branches | Distribute impulse to ventricular walls | |
| Purkinje fibers | Final rapid activation of myocardium | 20-40 bpm |
Autonomic effects on SA node:
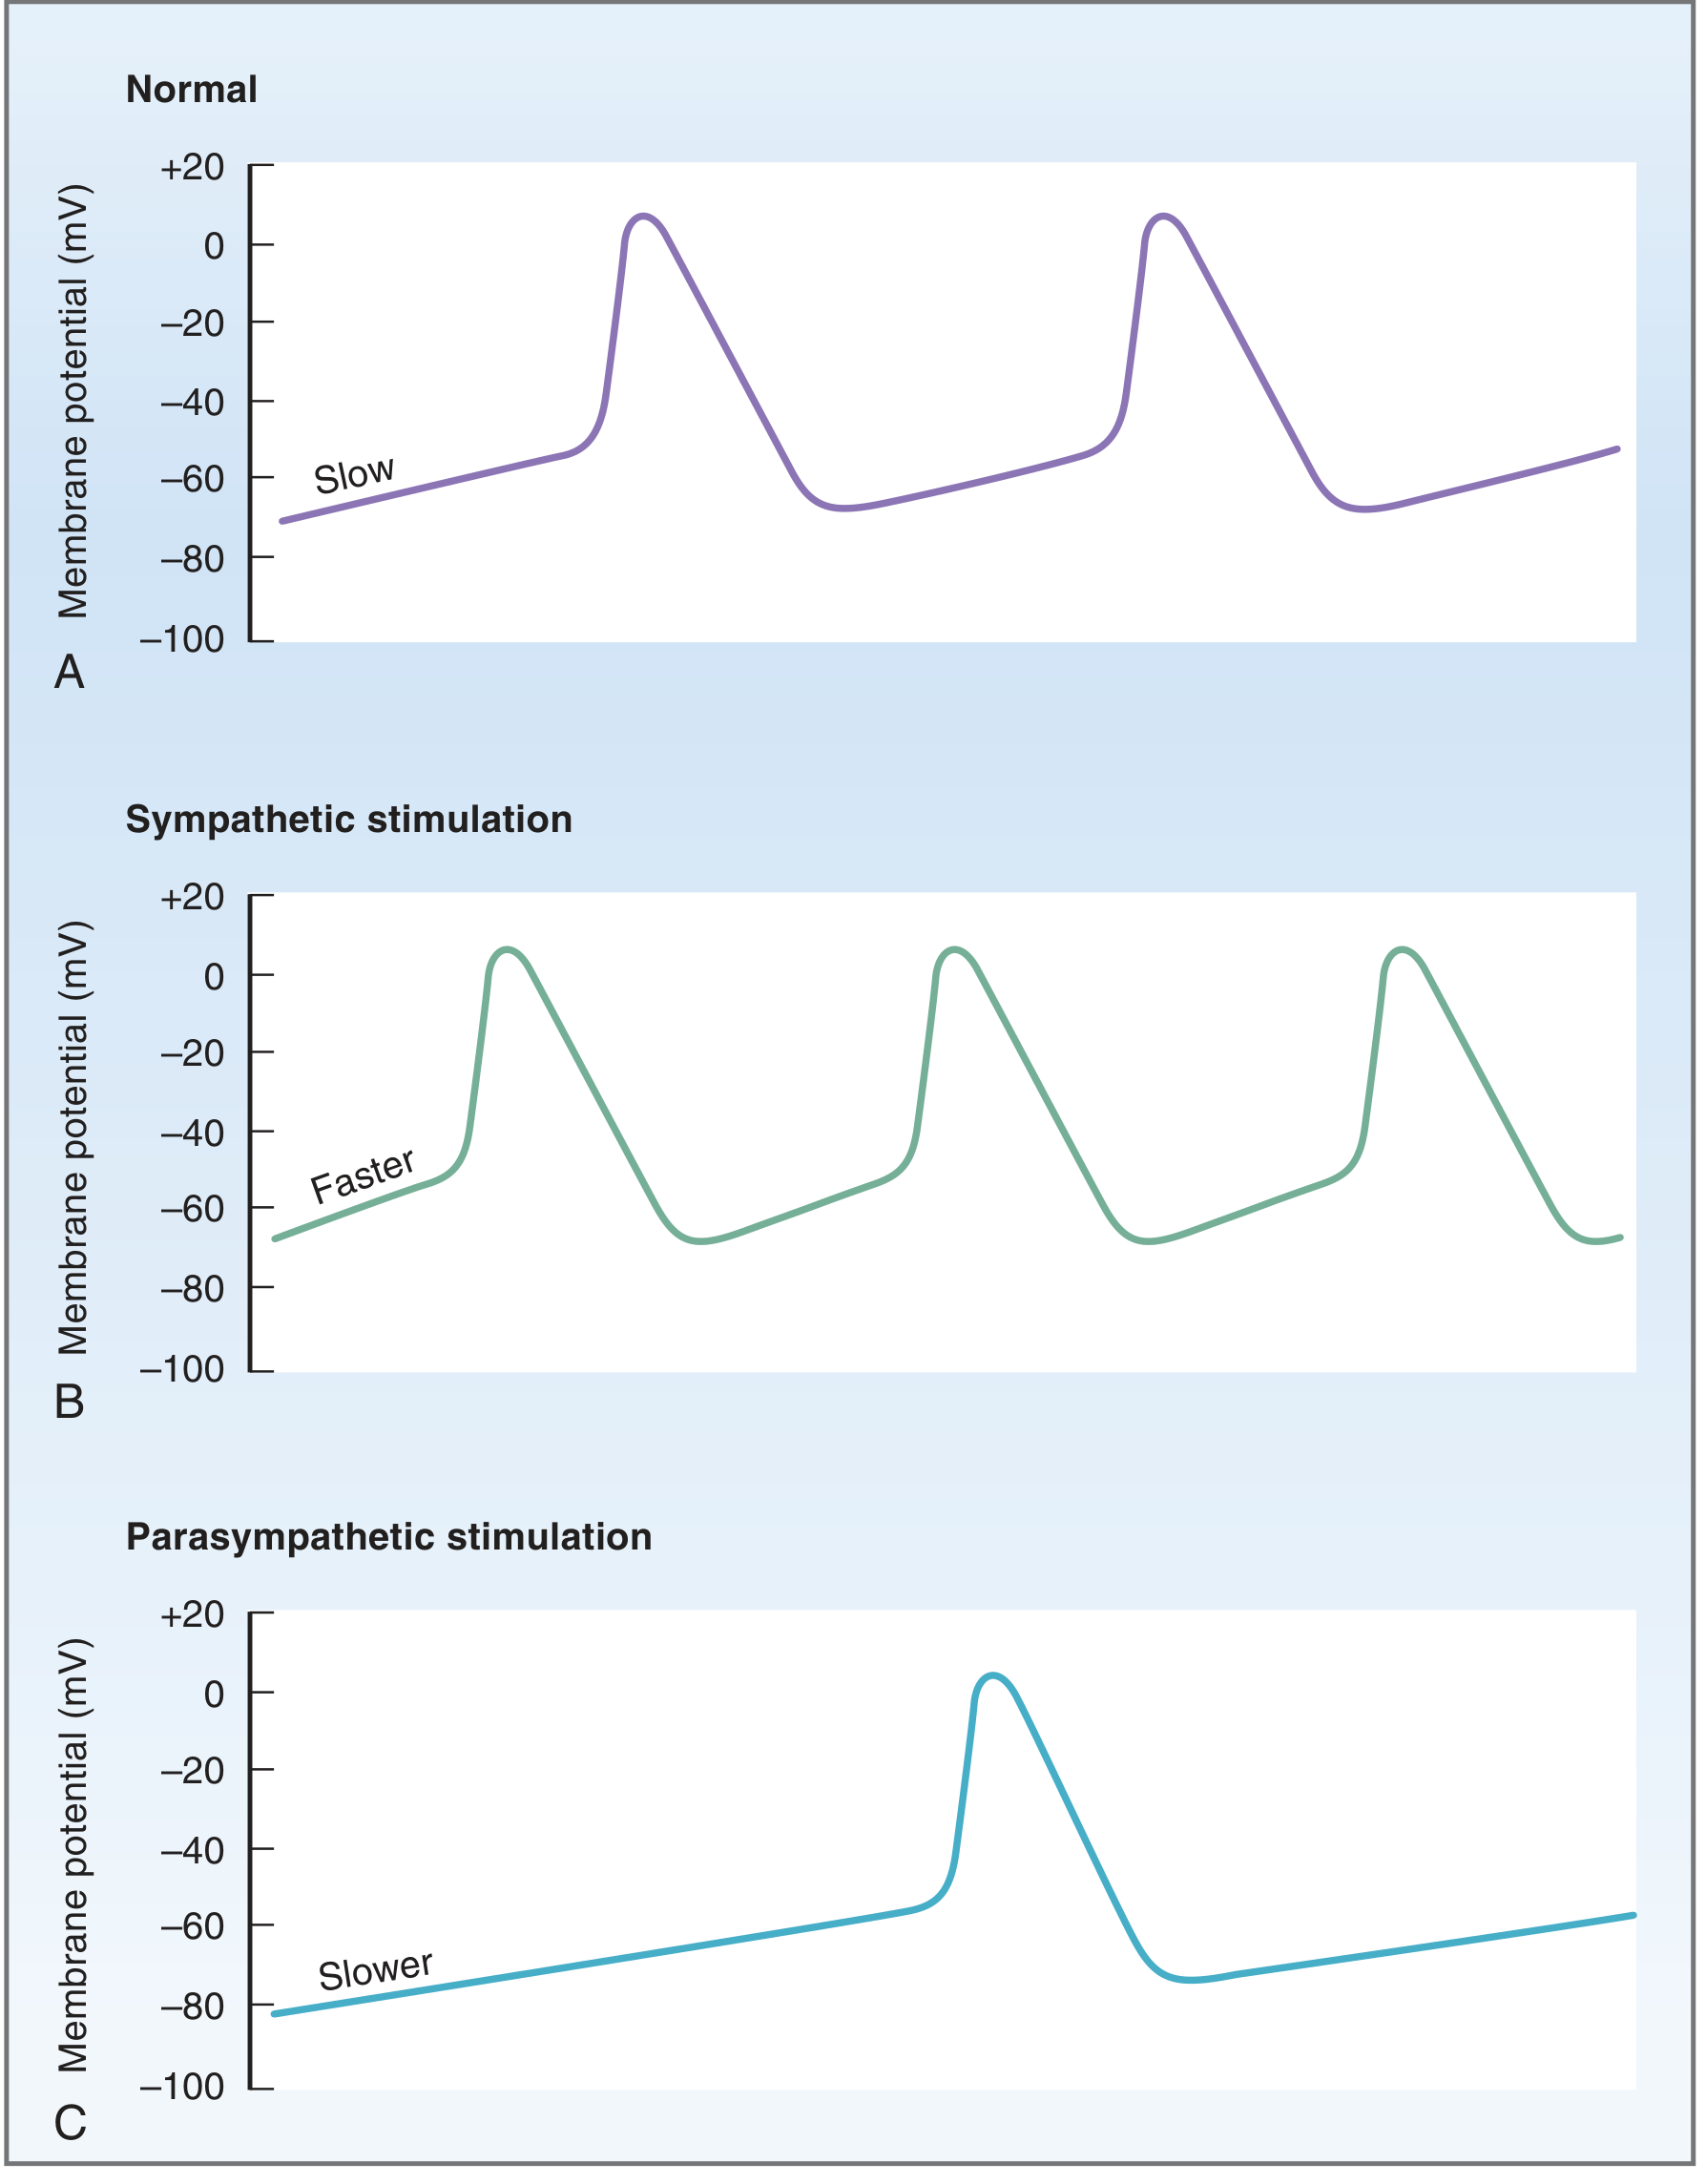
- Sympathetic (beta-1, norepinephrine): increases If current → faster phase 4 depolarization, decreases threshold → faster HR, shorter PR
- Parasympathetic (M2, acetylcholine): decreases If, opens K+-ACh channels, hyperpolarizes → slower HR, longer PR
PART 2: THE 12-LEAD ECG SYSTEM
ECG Paper and Calibration
| Parameter | Standard Setting | Meaning |
|---|---|---|
| Paper speed | 25 mm/sec | 1 small box = 0.04 sec (40 ms); 1 large box = 0.20 sec (200 ms) |
| Amplitude | 10 mm/mV | 1 mm = 0.1 mV |
| Each lead recorded | 2.5 seconds by default | Thick lines 5 mm apart, thin lines 1 mm apart |
Electrodes and Lead Positions
Limb electrode color coding:
| Location | Notation | Color |
|---|---|---|
| Right arm | RA | White |
| Left arm | LA | Black |
| Left leg | LL | Red |
| Right leg | RL | Green (ground) |
| V1 | Precordial | Brown/red |
| V2-V6 | Precordial | Brown/yellow, green, blue, orange, violet |
Precordial Lead Placement
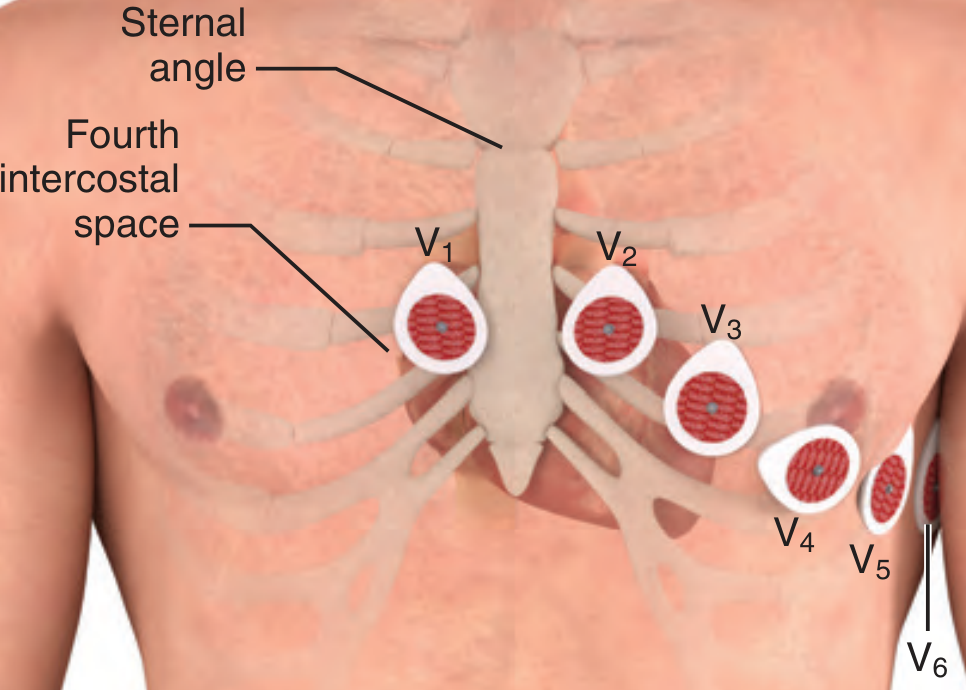
- V1: Right sternal border, 4th intercostal space
- V2: Left sternal border, 4th intercostal space
- V3: Midway between V2 and V4
- V4: Left midclavicular line, 5th intercostal space
- V5: Left anterior axillary line, same horizontal level as V4
- V6: Left midaxillary line, same horizontal level as V4 and V5
Caution: V4-V6 are placed at the same horizontal level, not following the curve of intercostal spaces. Landmark: palpate sternal angle (angle of Louis) = junction of manubrium and body of sternum = level of 2nd rib → count down to 4th ICS.
Posterior leads (V7, V8, V9): placed on the back at the same horizontal level as V6, used to detect posterior MI.
Right-sided leads (V1R-V6R): mirror image on right chest, used to detect right ventricular MI.
The 12 Leads and Their Views
| Lead Group | Leads | Plane | What They "See" |
|---|---|---|---|
| Limb (bipolar) | I, II, III | Frontal | Lateral, inferior, overall LV vectors |
| Augmented (unipolar) | aVR, aVL, aVF | Frontal | Right arm, left arm, left foot perspectives |
| Precordial (unipolar) | V1-V6 | Horizontal/transverse | Anterior, septal, lateral walls |
Key facts:
- Lead I positive pole = left arm → records left-right vector
- Lead II positive pole = left leg → most commonly used rhythm strip (best P-wave visibility)
- aVR is the "opposite" lead - normally negative QRS/T; positive deflections in aVR = bad (global ischemia, misplaced electrodes)
- V1-V2 = septal; V3-V4 = anterior; V5-V6 = lateral
Limb Lead Placement and Effect
PART 3: NORMAL WAVEFORMS AND INTERVALS
The Normal ECG Waveform
Waves
| Wave | Represents | Normal Duration | Normal Amplitude |
|---|---|---|---|
| P wave | Atrial depolarization | <120 ms | <0.25 mV (2.5 mm) in II |
| Q wave | Initial septal depolarization (L→R) | <40 ms | <25% of R wave height |
| R wave | Main ventricular depolarization | - | Tallest deflection in QRS |
| S wave | Terminal depolarization (basal ventricles) | - | - |
| T wave | Ventricular repolarization | - | Upright most leads; inverted V1 normal |
| U wave | Purkinje repolarization (if visible) | - | Small, same direction as T; prominent in hypokalemia |
Atrial repolarization is not visible on normal ECG - it is buried within the QRS complex.
Intervals and Segments
| Measurement | Normal Range | What It Measures | Abnormal |
|---|---|---|---|
| PR interval | 120-200 ms (3-5 small boxes) | Atrial depolarization + AV node conduction | >200 ms = heart block; <120 ms = preexcitation |
| PR segment | Isoelectric | AV node delay alone | Depression = pericarditis, atrial injury |
| QRS duration | <120 ms (<3 small boxes) | Ventricular conduction | >120 ms = BBB, ventricular rhythm, hyperkalemia |
| ST segment | Isoelectric (±0.5 mm) | Ventricular plateau (phase 2 action potential) | Elevation = STEMI, pericarditis; Depression = ischemia, NSTEMI |
| QT interval | <440 ms men; <460 ms women | Total ventricular repolarization | Prolonged = torsades risk |
| QTc (corrected) | QT ÷ √RR (Bazett formula) | QT corrected for heart rate | >440 ms = prolonged |
Memory rule: Intervals include waves; segments do not.
Heart Rate Calculation
| Method | Formula/Use |
|---|---|
| Regular rhythm (quick) | 300 ÷ number of large boxes between R waves |
| Regular rhythm (precise) | 1500 ÷ number of small boxes between R waves |
| Irregular rhythm | Count QRS complexes in 6 seconds × 10 |
PART 4: CARDIAC AXIS
The mean QRS axis represents the average direction of ventricular depolarization in the frontal plane.
| Axis | Degrees | Leads to Check |
|---|---|---|
| Normal | -30° to +90° | I positive, aVF positive |
| Left axis deviation (LAD) | -30° to -90° | I positive, aVF negative |
| Right axis deviation (RAD) | +90° to +180° | I negative, aVF positive |
| Extreme axis | +180° to -90° | I negative, aVF negative |
Quick method: Check Lead I and aVF
- Both positive = normal axis
- I positive, aVF negative = LAD
- I negative, aVF positive = RAD
- Both negative = extreme/northwest axis
Causes of LAD: LBBB, left anterior fascicular block, inferior MI, LVH, Wolff-Parkinson-White
Causes of RAD: RVH, RBBB, lateral MI, pulmonary hypertension, PE, dextrocardia
PART 5: CHAMBER ENLARGEMENT AND HYPERTROPHY
Atrial Enlargement
| Pattern | ECG Finding | Leads |
|---|---|---|
| Right atrial enlargement (RAE) | Peaked P wave (P pulmonale) >2.5 mm | II, III, aVF |
| Left atrial enlargement (LAE) | Biphasic P (wide negative terminal component) >40 ms & >1 mm deep | V1; broad notched P >120 ms in II (P mitrale) |
Ventricular Hypertrophy
Left Ventricular Hypertrophy (LVH) - Sokolow-Lyon criteria:
- S in V1 + R in V5 or V6 ≥35 mm
- R in aVL ≥11 mm
- R in Lead I + S in Lead III ≥25 mm
- Associated: ST depression and T-wave inversion in lateral leads (strain pattern), LAE
Right Ventricular Hypertrophy (RVH):
- RAD (>+90°)
- R wave dominant in V1 (R > S in V1)
- Deep S waves in V5-V6
- Associated: RAE, ST depression/T inversion in V1-V3 (strain)
PART 6: ECG IN ISCHEMIA AND INFARCTION
Evolution of ECG Changes in STEMI
| Stage | Time | ECG Changes |
|---|---|---|
| Hyperacute | Minutes | Tall, peaked (hyperacute) T waves; earliest change |
| Acute | Hours | ST elevation (convex upward / "tombstone"); Q waves begin to form |
| Subacute | Hours-days | ST elevation persisting; Q waves deepen; T wave inversion begins |
| Chronic/Established | Days-weeks | ST returns to baseline; T waves inverted; Q waves persist (scar) |
Persistent ST elevation after weeks = suspect LV aneurysm.
ST Elevation Criteria for STEMI
- ≥1 mm (0.1 mV) in 2 contiguous limb leads
- ≥2 mm (0.2 mV) in 2 contiguous precordial leads
- New LBBB in the appropriate clinical context
Regional ECG Localization
| MI Location | Leads with ST Elevation | Reciprocal ST Depression | Culprit Artery |
|---|---|---|---|
| Anterior | V1-V4 | II, III, aVF | LAD (proximal) |
| Lateral | I, aVL, V5-V6 | II, III, aVF | LCx or LAD diagonal |
| Anterolateral | V2-V6, I, aVL | II, III, aVF | LAD or LCx |
| Inferior | II, III, aVF | I, aVL | RCA (80%), LCx (20%) |
| Right ventricular | V3R-V6R (V4R most sensitive) | - | RCA |
| Posterior | V8-V9 elevation | ST depression + tall R + R:S >1 in V1-V3 | RCA or LCx |
| aVR STE | aVR ≥1 mm + diffuse ST depression | Widespread ST depression | Left main or proximal LAD |
Anterior STEMI (V1-V4 ST elevation):
Anterolateral STEMI (V2-V6, I, aVL):
Pathological Q Waves
- Q wave >40 ms (1 small box) wide OR >25% height of R wave in same lead = pathological
- Represent electrically silent necrotic tissue
- Persist as a permanent scar marker
- Septal q waves (narrow, small) in I, aVL, V5-V6 are normal
NSTEMI / Unstable Angina
- No ST elevation; instead: ST depression ≥0.5 mm in contiguous leads
- Deep, symmetrical T-wave inversion (Wellens' syndrome variant: deep T inversion in V2-V3 = proximal LAD critical stenosis)
- Non-specific ST/T changes
- ECG may be completely normal in 5-10% of NSTEMI - troponin is the key distinguisher
STEMI Mimics (Differential Diagnosis of ST Elevation)
| Condition | Key ECG Distinguisher |
|---|---|
| LBBB | Wide QRS, no true "ischemic" territory pattern |
| LVH with strain | Lateral ST depression, not territory-specific elevation |
| Pericarditis | Diffuse ST elevation + PR depression, no reciprocal changes |
| Brugada | RBBB + STE in V1-V3 only |
| Early repolarization | J-point elevation, notching, resolves with tachycardia |
| Prinzmetal angina | Transient STE during pain, resolves |
| Aortic dissection | STE (if coronary involved), but wide mediastinum on CXR |
| Ventricular aneurysm | Persistent STE with old Q waves |
PART 7: ARRHYTHMIAS
Sinus Rhythms
| Rhythm | Rate | Features |
|---|---|---|
| Normal sinus | 60-100 bpm | Regular, P before every QRS, upright P in II |
| Sinus tachycardia | >100 bpm | Same; often secondary cause (fever, pain, anemia) |
| Sinus bradycardia | <60 bpm | Same; athletes, vagal tone, medications |
| Sinus arrhythmia | Variable | Varying R-R with respiration; normal in young |
Supraventricular Arrhythmias
| Arrhythmia | Rate | Rhythm | P Waves | QRS | Key Features |
|---|---|---|---|---|---|
| Atrial fibrillation (AF) | 350-600 atrial; 60-170 ventricular | Irregularly irregular | No P waves; fibrillatory baseline (f waves) | Narrow (unless aberrant) | Most common sustained arrhythmia |
| Atrial flutter | 250-350 atrial; ventricular varies by block | Regular sawtooth | Flutter (F) waves 300/min; sawtooth in II, III, aVF | Narrow | Classic 2:1 block = ventricular rate ~150 |
| AVNRT | 150-250 | Regular | Retrograde P (hidden in QRS or just after) | Narrow | Most common paroxysmal SVT; "pseudo-R'" in V1 |
| AVRT (WPW) | 150-250 | Regular | Retrograde P after QRS | Narrow (orthodromic); Wide (antidromic) | Delta wave in sinus rhythm |
| Ectopic atrial tachycardia | 100-250 | Regular | Different P morphology from sinus | Narrow | P-wave axis different from sinus |
| Multifocal atrial tachycardia (MAT) | >100 | Irregular | ≥3 different P morphologies | Narrow | COPD commonest cause |
| Junctional rhythm | 40-60 | Regular | No P, or retrograde P | Narrow | AV nodal escape |
Ventricular Arrhythmias
| Arrhythmia | Rate | QRS | Key Features |
|---|---|---|---|
| PVC | Normal background rate | Wide (>120 ms), bizarre, compensatory pause | May be benign or indicate structural disease |
| Ventricular tachycardia (VT) | 100-250 | Wide (>120 ms), regular | AV dissociation; fusion beats; capture beats; Brugada criteria |
| Ventricular fibrillation (VF) | Chaotic | No recognizable complexes | Cardiac arrest; defibrillate immediately |
| Torsades de Pointes | 150-250 | Wide; "twisting" around baseline | Long QT precondition; polymorphic VT; often self-terminates |
| Accelerated idioventricular | 40-100 | Wide | Reperfusion arrhythmia; usually benign |
VT vs SVT with aberrancy - features favoring VT:
- AV dissociation (independent P waves and QRS) = pathognomonic
- QRS >160 ms
- Fusion beats or capture beats
- Extreme axis deviation (northwest)
- Concordance (all V leads positive or all negative)
- No RS complex in any precordial lead
Heart Blocks (AV Blocks)
| Block | ECG | Symptoms | Treatment |
|---|---|---|---|
| 1st degree | PR >200 ms; every P conducts | None | None needed |
| 2nd degree Mobitz I (Wenckebach) | PR progressively lengthens until P dropped; group beating | Usually none | Monitor; atropine if symptomatic |
| 2nd degree Mobitz II | Fixed PR, then sudden non-conducted P; QRS often wide | May cause syncope | Pacing often required |
| 3rd degree (complete) | P waves and QRS completely dissociated; ventricular escape rhythm | Syncope, heart failure, shock | Temporary then permanent pacing |
| 2:1 AV block | Every other P dropped | Variable | Distinguish Mobitz I vs II by clinical context |
SA node damage (sick sinus syndrome) → other pacemakers take over at slower rates (bradycardia).
Bundle Branch Blocks
| Block | QRS | Specific Features | Causes |
|---|---|---|---|
| RBBB | ≥120 ms | rSR' ("rabbit ears / M-shape") in V1-V2; wide slurred S in I, aVL, V5-V6 | PE, RVH, congenital, ischemia |
| LBBB | ≥120 ms | Broad, notched R in I, aVL, V5-V6; QS or rS in V1; no septal q in V6 | CAD, cardiomyopathy, hypertension |
| Left anterior fascicular block (LAFB) | <120 ms | LAD (-45° to -90°); small q in I, aVL; small r in II, III, aVF | Common; benign or structural |
| Left posterior fascicular block (LPFB) | <120 ms | RAD (+90° to +180°); diagnosis of exclusion | Less common; structural |
New LBBB in acute chest pain = treat as STEMI equivalent (Sgarbossa criteria may help).
Fascicular/Bifascicular/Trifascicular Blocks
- Bifascicular block: RBBB + LAFB (most common) or RBBB + LPFB
- Trifascicular block: Bifascicular + 1st degree AV block - high risk for complete heart block
PART 8: SPECIAL ECG PATTERNS
Wolff-Parkinson-White (WPW) Syndrome
ECG in sinus rhythm:
- Short PR (<120 ms) - bypass of AV node delay
- Delta wave (slurred initial upstroke of QRS) - ventricular pre-excitation
- Wide QRS (>120 ms)
- Secondary ST-T changes
Preexcited AF in WPW (medical emergency):
DANGER: In WPW with AF, AV-nodal blockers (adenosine, verapamil, digoxin, beta-blockers) are CONTRAINDICATED - they can accelerate accessory pathway conduction and cause VF. Treat with procainamide or cardioversion. - Harrison's Principles 22E
Long QT Syndrome (LQTS)
- Congenital: Mutations in K+ channel genes (KCNQ1 most common), also SCN5A (Na+ channel)
- Acquired causes: Drugs (class IA/III antiarrhythmics, macrolides, fluoroquinolones, antipsychotics), hypokalemia, hypomagnesemia, hypothyroidism, bradycardia
- QTc >440 ms (men) / >460 ms (women) = abnormal
- Risk: Torsades de Pointes → can degenerate to VF → sudden cardiac death
- Characteristic trigger: TdP preceded by a PVC after a long pause (long-short sequence)
- Romano-Ward syndrome: autosomal dominant; no deafness
- Jervell-Lange-Nielsen syndrome: autosomal recessive; associated with congenital deafness
Brugada Syndrome
- Autosomal dominant channelopathy (SCN5A mutation in ~25%)
- ECG: RBBB morphology + ST elevation in V1-V3 (coved or saddle-back pattern)
- Type 1 (diagnostic): Coved-type STE ≥2 mm in V1-V2 with downsloping ST
- Risk: VF, sudden cardiac death, often at night/rest
- ECG may be concealed at rest; provocation with Na-channel blockers (ajmaline, flecainide) unmasks it
- Management: ICD for symptomatic patients - Fuster & Hurst's The Heart 15th Ed.
Acute Pericarditis
ECG Stages: - Braunwald's Heart Disease
| Stage | ECG Changes | Timing |
|---|---|---|
| Stage 1 | Diffuse ST elevation (concave up/"saddle-shaped") + PR depression in all leads except aVR; PR elevation in aVR | Hours to days |
| Stage 2 | ST normalization | Days |
| Stage 3 | T-wave inversion | Weeks |
| Stage 4 | ECG normalization | Weeks-months |
Key distinguishing features from STEMI:
- ST elevation is diffuse (not territory-specific)
- ST morphology is concave upward (vs. convex in STEMI)
- PR depression (pathognomonic) - pericardium itself is electrically silent; changes reflect epicardial myocardial injury
- No reciprocal ST depression (except aVR, V1)
- No Q waves (no necrosis)
- PR depression can be the only ECG sign in some cases
Pulmonary Embolism (PE)
Classic ECG findings (seen in massive/submassive PE - non-specific individually):
- Sinus tachycardia (most common)
- S1Q3T3: S wave in Lead I + Q wave in Lead III + T-wave inversion in Lead III
- T-wave inversion V1-V4 (RV strain pattern)
- New incomplete or complete RBBB
- RAD
- P pulmonale (peaked P waves in II)
Hyperkalemia
| K+ Level | ECG Changes |
|---|---|
| 5.5-6.5 mEq/L | Peaked, narrow, tall T waves ("tent-shaped") |
| 6.5-7.5 mEq/L | Widened QRS, prolonged PR, flattened P |
| >7.5 mEq/L | P waves disappear; wide bizarre QRS; sine-wave pattern |
| >8.0 mEq/L | VF or asystole |
Hypokalemia
- Flattening/inversion of T waves
- U waves become prominent (U > T in same lead = significant)
- Pseudo-prolonged QT (actually QU interval)
- Increased arrhythmia risk
Hypothermia
- Osborn (J) wave: positive deflection at J-point (QRS-ST junction), most prominent in V5-V6 and II
- Sinus bradycardia → AF → VF as core temperature drops
- Prolongation of all intervals
PART 9: SYSTEMATIC ECG INTERPRETATION (10-STEP METHOD)
Always interpret ECGs systematically to avoid missing findings:
| Step | What to Assess | Key Normal Values |
|---|---|---|
| 1. Rate | 300 ÷ large boxes (or count 6 sec × 10) | 60-100 bpm |
| 2. Rhythm | Regular or irregular? P before every QRS? | Regular |
| 3. P waves | Present? Morphology? One before each QRS? | Upright in II, inverted in aVR |
| 4. PR interval | Constant? Short? Long? | 120-200 ms |
| 5. QRS duration | Narrow or wide? | <120 ms |
| 6. QRS morphology | Bundle branch block? Q waves? | Normal |
| 7. Axis | Normal? LAD? RAD? | -30° to +90° |
| 8. ST segment | Elevation? Depression? Which leads? | Isoelectric ±0.5 mm |
| 9. T waves | Upright? Inverted? Peaked? | Upright I, II, V3-V6 |
| 10. QT interval | Prolonged? | QTc <440 ms |
Always compare to prior ECG when available - "new changes" vs "old" changes is often the most important determination.
Lead Groups as Territories (Quick Reference)
Septal: V1, V2
Anterior: V3, V4
Lateral: I, aVL, V5, V6
Inferior: II, III, aVF
Right: aVR (cavity), V4R (RV)
Reciprocal changes = ST depression in the lead directly opposite the infarct zone. They support the diagnosis of STEMI.
ECG Limitations
- A normal ECG does not exclude ACS (5-10% of MIs have normal initial ECG)
- Serial ECGs (every 15-30 min in chest pain) and troponin are always needed
- Prehospital ECG transmission reduces door-to-balloon time in STEMI significantly
- Electrode misplacement can mimic pathology (e.g., LA-RA swap = inverted P in I, negative QRS in I mimicking dextrocardia)
- 80-lead body surface mapping improves STEMI detection in "electrically silent" zones (far inferior wall, posterior wall, RV)
This guide covers: ECG basics, 12-lead system, waveforms and intervals, cardiac axis, chamber enlargement, ischemia/infarction patterns, arrhythmias (supraventricular, ventricular, heart blocks, bundle branch blocks), and special patterns (WPW, LQTS, Brugada, pericarditis, PE, electrolytes, hypothermia).
This is a shared conversation. Sign in to Orris to start your own chat.