
Paps smear
Pap smear cervical cytology normal abnormal cells
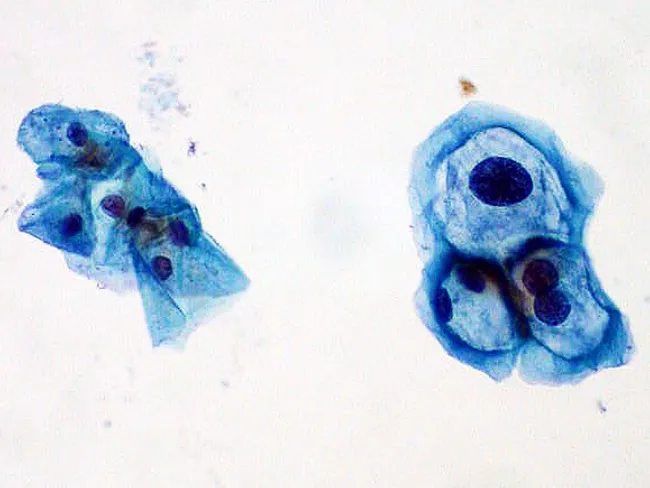
This is a cytology preparation of a cervical sample processed as a ThinPrep Pap smear and imaged by brightfield light microscopy. The right-hand field shows epithelial squamous cells with HPV cytopathic effect (koilocytosis): enlarged, irregular, hyperchromatic nuclei with coarse chromatin, a distinct perinuclear halo, and cytoplasmic clearing; accompanying cytoplasm is often dense and well delineated. The left-hand field displays morphologically normal squamous epithelial cells with uniform nuclei and minimal cytoplasmic clearing, serving as a normal comparator. The sample originates from the cervical transformation zone, where squamous metaplasia occurs; the specimen includes groups of discohesive and cohesive cells arranged in sheets and clusters. Pap staining yields a bluish to green-blue cytoplasm and prominent nuclear detail, enabling assessment of nuclear size, contour, and chromatin pattern. In HPV infection, koilocytosis reflects viral cytopathic effect and is considered a surrogate marker for oncogenic HPV infection; its presence warrants clinical follow-up with HPV typing and cytologic/beyond screening assessment. Clinically, the image is relevant for education, illustrating hallmark cytologic changes used in screening programs, differential diagnoses for squamous cell atypia, and potential progression to cervical intraepithelial neoplasia (CIN). This dual-field photograph aids learners in recognizing contrast between infected and normal epithelium, cytoplasmic maturation, and nuclear irregularity in a single view.
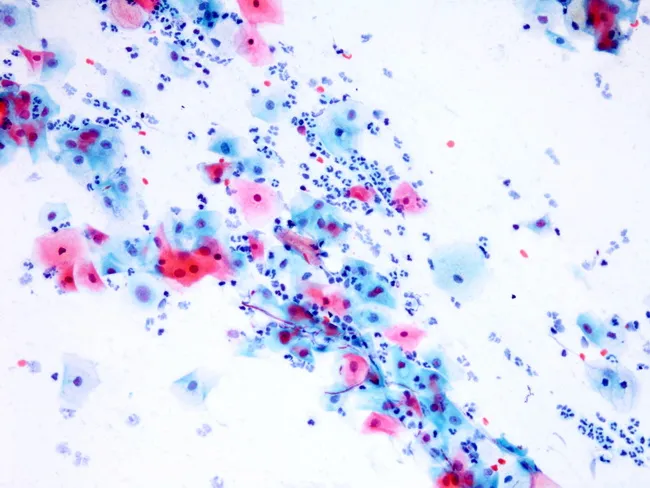
Conventional cervical cytology Pap smear demonstrates opportunistic yeast colonization consistent with Candida species. The primary cellular component comprises intermediate and superficial squamous cells within clusters, with abundant oval budding yeast forms measuring approximately 1–2 μm. Prominent pseudohyphae extend from yeast structures and appear eosinophilic with uneven staining on the cytology smear. A robust neutrophilic inflammatory background accompanies the fungal elements, reflecting active fungal infection and acute inflammatory response. The yeast forms are small, round to ovoid, with smooth contours and budding patterns; the accompanying pseudohyphae appear as elongated filamentous structures, often terminating in small buds. The appearance is diagnostic of Candida infection in vaginal/cervical cytology and can be seen in vulvovaginal candidiasis, cervicitis, or secondary colonization in patients with recent antibiotic exposure or immunocompromise. Consider differential diagnoses that can mimic yeast elements on Pap stain include other yeasts such as Saccharomyces and nonpathogenic contaminants, but the presence of true pseudohyphae and budding yeast strongly favors Candida. Clinically, these findings should prompt correlation with symptoms such as pruritus, discharge, and risk factors like diabetes mellitus, pregnancy, or immune suppression, and guide antifungal therapy decisions. Follow-up cytology or microbiology cultures may be used to determine species.
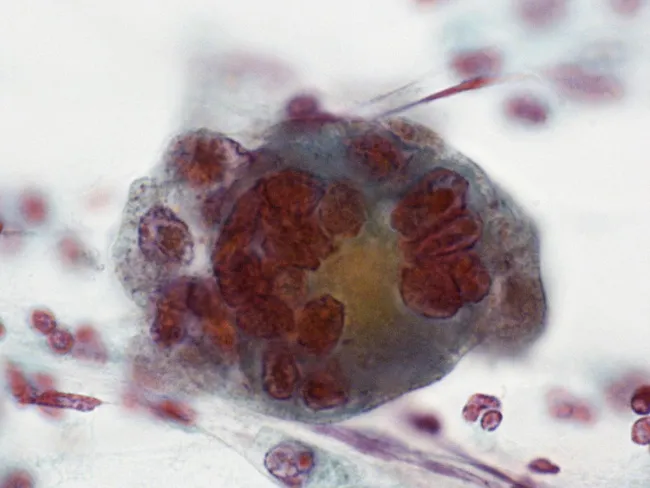
Imaging modality: Conventional cervical cytology (Pap smear) analyzed by light microscopy after Papanicolaou staining. Primary subject: an HSV-induced cytopathic change in cervical squamous epithelium, demonstrated as a multinucleated giant cell with characteristic intranuclear inclusions. Anatomical localization: cervix, transformation zone, squamous epithelium of the lower genital tract. Visual features: a large, rounded cell with abundant cytoplasm, multiple molded nuclei, marginated chromatin, and dense eosinophilic intranuclear inclusions (Cowdry type A). A perinuclear halo and nuclear molding are evident; nuclei tend to crowd together but do not fully overlap. Background typically contains neutrophils or inflammatory cells. Staining accentuates the eosinophilic nuclear inclusions and the halo, enabling recognition of HSV cytopathic effect. Pathological interpretation: cytopathic effects consistent with active herpes simplex virus infection of cervical epithelium (HSV cervicitis). Diagnostic significance: supports clinical suspicion of herpetic cervicitis; guides antiviral therapy and infection control; may prompt confirmatory testing (HSV PCR or viral culture). Differential considerations: cytomegalovirus infection (owl's eye inclusions) can mimic in some respects but shows solitary cells with distinct intranuclear inclusions; koilocytes from HPV are different. Clinical correlation: correlate with symptoms (dysuria, vaginal discharge, genital ulcers) and pregnancy status. Educational relevance: classic cytology example of HSV infection on Pap smear. Reproducible educational reference material.
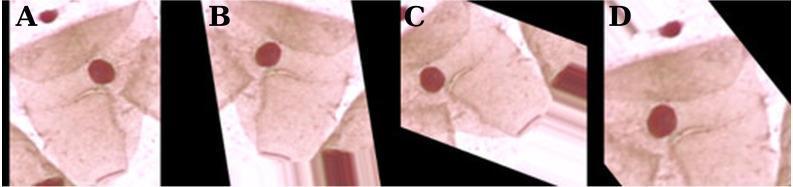
This medical image displays four panels (A, B, C, and D) illustrating Pap smear cytology samples from the Herlev database, used for medical machine learning research. The original clinical photograph (A) shows a single cervical cell with a distinct, darkly stained, round red nucleus and a surrounding lighter pink cytoplasm. Panels B, C, and D demonstrate various data augmentation techniques applied to the original image to improve neural network training. These include geometric transformations such as horizontal and vertical shifts, rotation, zooming, and shearing. There are also visible modifications in color saturation. These panels are used to teach computer vision models to recognize cellular features regardless of orientation or positioning, which is critical for the automated screening of cervical cancer and identifying dysplastic changes in columnar cells.
"cervical cancer screening" AND "Pap smear"
Pap Smear (Papanicolaou Test)
Overview
Anatomy: The Transformation Zone
- In younger women: the squamocolumnar junction (SCJ) is visible and the TZ can be large
- With aging: the SCJ migrates inward into the canal
- At menopause: the TZ is usually entirely within the canal and not visible
Indications
- Routine cervical cancer screening (per age-based guidelines)
- Women on DES (diethylstilbestrol), immunocompromised, or HIV-positive patients
- Abnormal vaginal bleeding or discharge
- Visible/palpable cervical lesions (though Pap is not diagnostic - biopsy is needed)
- Following hysterectomy for dysplasia/carcinoma: continue annually after 3-4 normal results
- Victims of sexual assault (part of initial workup)
- Investigation of atypical glandular/endometrial cells
Contraindications
- Absolute: None
- Relative: Active vaginitis/cervicitis, pelvic inflammatory disease, menstruation (defer routine screening; obtain regardless if patient has abnormal bleeding)
Screening Intervals (Current Guidelines)
| Population | Recommendation |
|---|---|
| Ages 21-29 | Cytology alone every 3 years |
| Ages 30-65 | Cytology + HPV co-testing every 5 years (preferred) OR cytology alone every 3 years |
| >65 with adequate prior screening | Discontinue |
| Post-hysterectomy (benign) | Discontinue |
| Post-hysterectomy (for dysplasia/carcinoma) | Continue annually |
Procedure Technique
- Insert speculum without lubricant (lubricant can distort cells)
- Sample the endocervix with a Cytobrush (rotate 90-180 degrees, one direction only)
- Sample the ectocervix with a wooden/plastic spatula
- Spread spatula sample on slide first, then "unroll" the brush sample directly over it
- Immediately fix the slide with cytologic fixative
- Use a cervical broom; rotate five full turns
- Swish device in transport fluid at least 20 times (ThinPrep) OR pop broom head off into vial (SurePath)
- Allows simultaneous HPV DNA reflex testing
- Perform early in first trimester; the active TZ externalizes, so deep canal sampling is unnecessary
- Prefer broom or spatula over wire-tip brushes (reduces bleeding risk)
Bethesda Classification System (2001)
Squamous Cell Abnormalities
| Bethesda Term | Histologic Correlation |
|---|---|
| ASC-US | Atypical squamous cells of undetermined significance |
| ASC-H | Atypical squamous cells, cannot exclude HSIL |
| LSIL | Low-grade SIL = CIN 1 + HPV koilocytotic changes |
| HSIL | High-grade SIL = CIN 2 and CIN 3 (moderate/severe dysplasia, CIS) |
| Squamous cell carcinoma | Invasive cancer |
Glandular Cell Abnormalities
- AGC (atypical glandular cells) - endocervical, endometrial, or NOS
- Endocervical adenocarcinoma in situ
- Adenocarcinoma
Key Merges in Bethesda Logic
- HPV changes + CIN 1 are combined into LSIL (same natural history, same distribution of HPV types)
- CIN 2 + CIN 3 are combined into HSIL (similar biologic profile; management is the same)
Management of Abnormal Results
| Result | Management |
|---|---|
| ASC-US | Reflex HPV DNA testing (preferred); if high-risk HPV+ → colposcopy. OR repeat cytology at 6-month intervals × 2 |
| ASC-H | Colposcopy |
| LSIL | Colposcopy (may observe in adolescents - often self-limited) |
| HSIL | Colposcopy + directed biopsy |
| AGC | Colposcopy; consider endometrial sampling (especially in women >40) |
Accuracy and Limitations
- Sensitivity for detecting CIN 2/3: 47-62%; specificity: 60-95%
- False-negative rate for a single conventional Pap smear: 20-50% (includes ThinPrep)
- Major error sources: sampling error, poor fixation, laboratory interpretation errors, failure to follow up
- More than half of invasive cancers occur in women who were never screened or underscreened
HPV & Cervical Cancer Connection
- 90% of HPV infections resolve spontaneously within 2 years
- The remaining 10% of persistent infections can progress to precancerous lesions
- HPV 16 carries the greatest risk of progression
- Risk factors for progression: smoking, immunocompromise, early age of first intercourse, multiple sexual partners
Cytopathologic Findings on Pap Smear
Common Procedural Errors to Avoid
- Not sampling the entire transformation zone
- Using lubricant on the speculum (distorts cellular morphology)
- Air-drying the slide before fixation (causes artifacts)
- Rotating Cytobrush more than 180 degrees
- Not labeling specimens before collection
- Failing to document whether an endocervical component was obtained
Classify breast cancer
breast cancer classification molecular subtypes histology
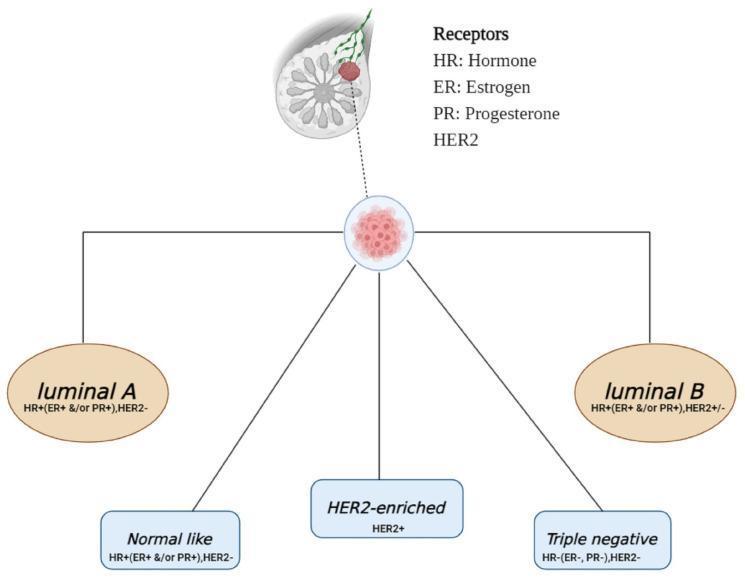
This educational diagram illustrates the intrinsic molecular subtypes of breast cancer categorized by their hormone receptor and HER2 status. At the top, a sagittal anatomical schematic of the breast shows a localized mass, which leads to a central node representing tumor classification. From this node, five distinct pathways branch to define specific subtypes: 1) Luminal A (HR+, ER+ and/or PR+, HER2-); 2) Luminal B (HR+, ER+ and/or PR+, HER2+/-); 3) Normal-like (HR+, ER+ and/or PR+, HER2-); 4) HER2-enriched (HER2+); and 5) Triple negative (HR-, ER-, PR-, HER2-). A legend defines the abbreviations used: HR (Hormone Receptor), ER (Estrogen Receptor), PR (Progesterone Receptor), and HER2 (Human Epidermal Growth Factor Receptor 2). This infographic is designed for medical education, aiding in the understanding of oncology classification, prognostic factors, and the immunohistochemical markers that guide clinical management in breast pathology.
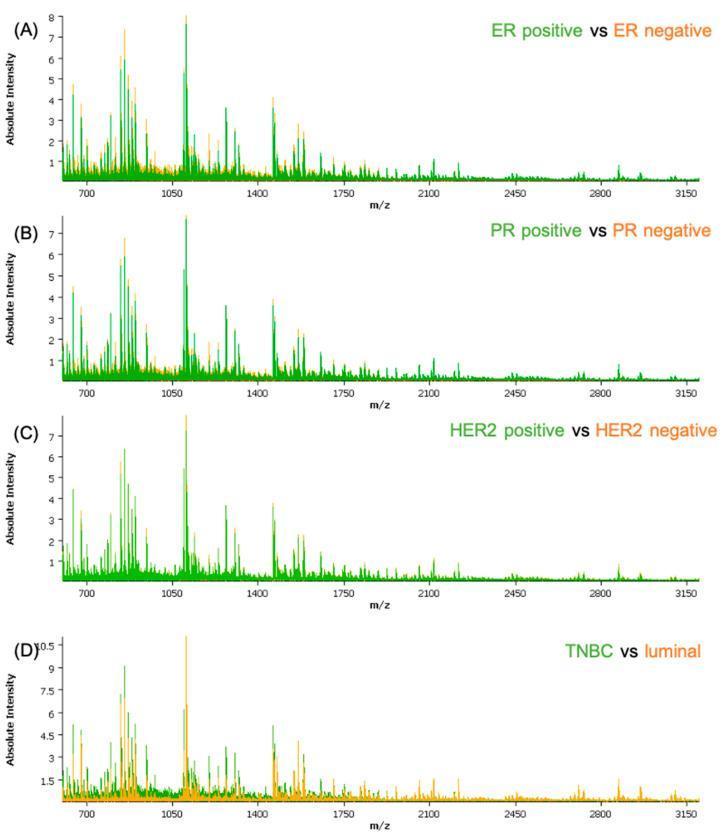
This diagnostic comparison chart displays MALDI-TOF mass spectrometry average spectra for breast cancer classification. The figure contains four subplots (A-D) showing 'Absolute Intensity' on the y-axis against 'm/z' (mass-to-charge ratio) on the x-axis, ranging from 700 to 3150. Subplot (A) compares Estrogen Receptor (ER) positive (green) and negative (orange) samples; (B) compares Progesterone Receptor (PR) positive (green) and negative (orange); (C) shows HER2 positive (green) and negative (orange); and (D) compares Triple-Negative Breast Cancer (TNBC) (green) and luminal subtypes (orange). Visually, the spectra are characterized by dense peptide peaks in the lower m/z range (700-1750), with intensity diminishing at higher mass ranges. Notable differential peak intensities are observed in the ER-positive and luminal groups compared to their counterparts, particularly around 1050 m/z. This educational material demonstrates the use of molecular profiling to identify distinctive peptide signatures associated with breast cancer receptor status and molecular subtypes.
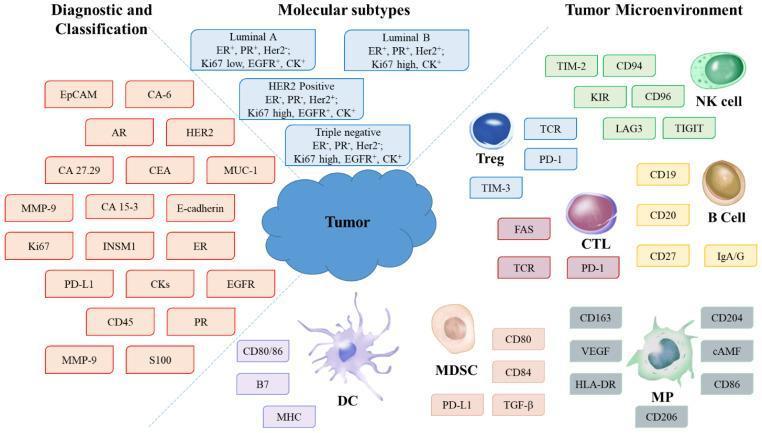
This medical infographic illustrates the complex landscape of biomarkers and cellular components involved in breast cancer diagnosis, classification, and the tumor microenvironment (TME). The diagram is divided into three functional sections. The 'Diagnostic and Classification' area lists critical tumor markers including EpCAM, HER2, ER, PR, Ki67, and PD-L1. The 'Molecular Subtypes' section provides specific biomarker profiles for Luminal A, Luminal B, HER2 Positive, and Triple Negative breast cancers, detailing the expression status of ER, PR, Her2, Ki67, EGFR, and CK. The 'Tumor Microenvironment' section displays various infiltrating immune cells and their associated surface markers: Regulatory T cells (Treg: TCR, PD-1, TIM-3), Natural Killer cells (NK: TIM-2, LAG3, TIGIT), B Cells (CD19, CD20), Cytotoxic T Lymphocytes (CTL: FAS, PD-1), Dendritic Cells (DC: CD80/86, MHC), Myeloid-Derived Suppressor Cells (MDSC: PD-L1, TGF-β), and Macrophages (MP: CD163, CD206, VEGF). This visual summary highlights the integrated approach needed for personalized oncology and immunotherapy selection.
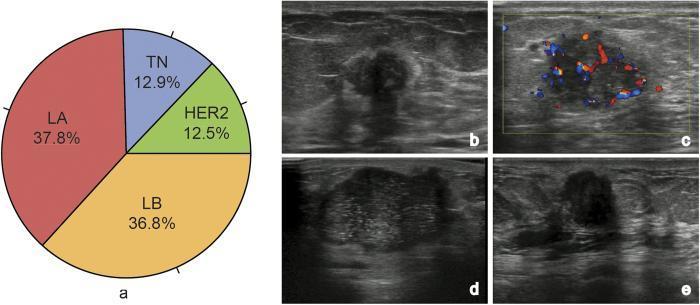
Educational medical graphic comparing breast cancer subtypes via a distribution chart and diagnostic ultrasound imaging. Panel (a) is a pie chart showing the prevalence of molecular subtypes: Luminal A (LA, 37.8%), Luminal B (LB, 36.8%), HER2-enriched (12.5%), and Triple-Negative (TN, 12.9%). Panels (b–e) present diagnostic ultrasound images illustrating characteristic features for each: (b) Luminal A (LA) subtype displaying a distinct hyperechoic halo and significant posterior acoustic shadowing; (c) Luminal B (LB) subtype demonstrated via color Doppler showing internal vascularity; (d) HER2-enriched subtype showing internal punctate calcifications and posterior acoustic enhancement; (e) Triple-Negative (TN) subtype presenting as an oval-shaped mass with a micro-lobulated margin. This comparison highlights how B-mode and Doppler ultrasound features such as margin morphology, echogenic boundary, and posterior acoustic phenomena vary across breast cancer molecular classifications, aiding in radiological-pathological correlation.
"breast cancer" AND "molecular subtypes" AND classification
Classification of Breast Cancer
1. Classification by Invasiveness
| Category | Percentage | Types |
|---|---|---|
| Non-invasive (In Situ) | 15-20% | DCIS, LCIS |
| Invasive | 80-85% | Multiple histological subtypes |
Non-Invasive Breast Cancer
- Malignant cells confined within the ductal membrane
- DCIS architectural patterns: papillary, cribriform, solid, comedo
- Papillary/cribriform = lower grade, slower progression to invasion
- Solid/comedo = higher grade; central necrosis → calcification (visible on mammography as pleomorphic/linear microcalcifications)
- Grade and ER status are more prognostically important than architectural pattern
- No longer classified as Tis in AJCC 8th edition - now considered a benign/high-risk entity
- Marker of elevated bilateral breast cancer risk
2. Histological Classification of Invasive Cancer
No Special Type (NST) / Ductal NST - 50-70%
- Most common type; no distinct architectural pattern
- Gross: hard, irregular, radiodense mass with desmoplastic reaction
- Classic "medullary pattern" (high-grade, TIL-rich) is now classified as invasive carcinoma NST with medullary pattern
Special Types
| Histological Type | Frequency | Key Features |
|---|---|---|
| Invasive lobular | 5-15% | Single-file ("Indian file") infiltration; E-cadherin loss; bilateral tendency |
| Tubular | 2-3% | Well-formed tubules; excellent prognosis; low grade; ER+ |
| Mucinous (colloid) | 2-3% | Tumor cells floating in extracellular mucin; favorable prognosis |
| Invasive cribriform | 1-3% | Cribriform glandular pattern; low-grade; good prognosis |
| Invasive papillary | 1-2% | Papillary structures; older women; favorable |
| Adenoid cystic | ~1% | Biphasic morphology; rarely metastasizes to lymph nodes |
| Metaplastic | ~1% | High-grade, ER/PR/HER2 negative; node-negative but poor prognosis |
Mixed Connective and Epithelial Tumors
- Phyllodes tumors (benign and malignant) - <1%
- Carcinosarcoma - <1%
- Angiosarcoma - <1%
3. Histological Grading (Nottingham Grade)
| Parameter | Score 1 | Score 2 | Score 3 |
|---|---|---|---|
| Tubule formation | >75% | 10-75% | <10% |
| Nuclear pleomorphism | Small, uniform | Moderate variation | Marked variation |
| Mitotic rate | Low | Moderate | High |
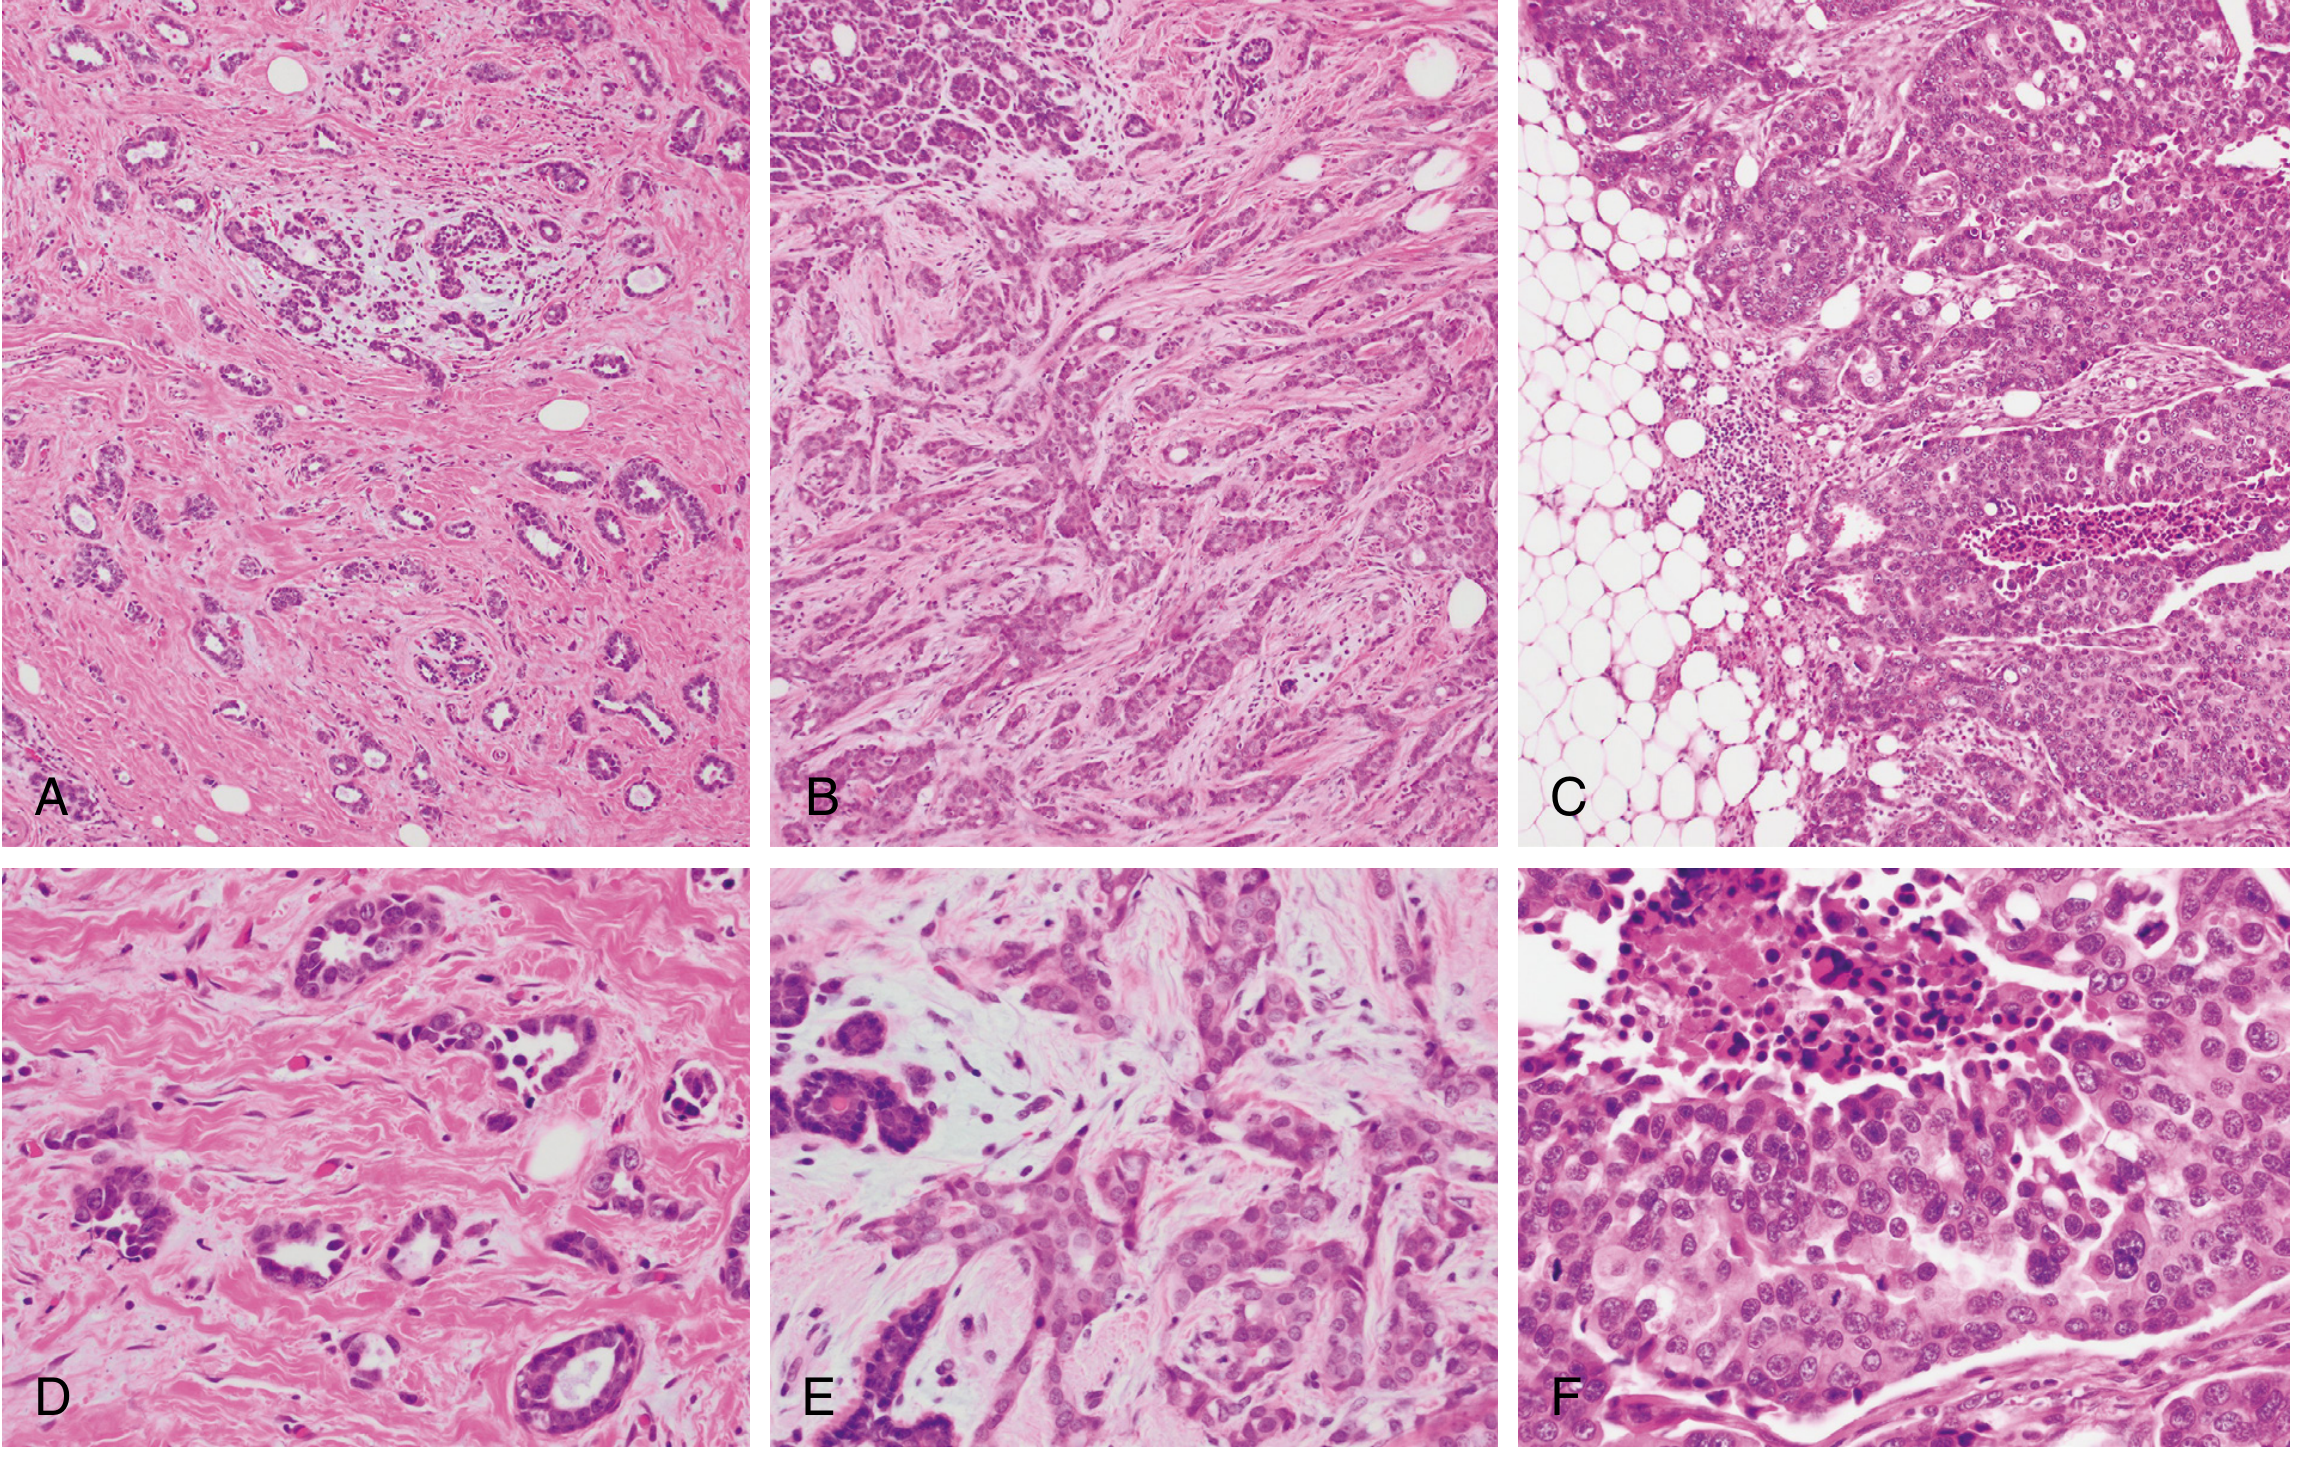
- Grade 1 (3-5): Well differentiated - tubular/cribriform pattern, small uniform nuclei, low proliferation
- Grade 2 (6-7): Moderately differentiated - mixed tubular/solid, moderate pleomorphism
- Grade 3 (8-9): Poorly differentiated - ragged sheets, enlarged irregular nuclei, necrosis, high mitotic rate
4. Molecular / Receptor-Based Classification
The Five Intrinsic Subtypes (IHC Approximation)
| Intrinsic Subtype | IHC Profile | Clinical Class | Prognosis |
|---|---|---|---|
| Luminal A | ER+, PR+, HER2−, Ki-67 <14% | HR-positive | Best overall survival |
| Luminal B (HER2−) | ER+, PR low/−, HER2−, Ki-67 ≥14% | HR-positive | Worse than Luminal A |
| Luminal B (HER2+) | ER+, PR low/−, HER2+ | HR+/HER2+ | Intermediate |
| HER2-enriched | ER−, PR−, HER2+ | HER2-positive | Poor (pre-targeted therapy); improved with anti-HER2 agents |
| Basal-like | ER−, PR−, HER2− | Triple-negative (TNBC) | Worst; highest metastatic risk |
| Normal-like | ER+, PR+, HER2− | HR-positive | Similar to Luminal A |
| Claudin-low | ER−, PR−, HER2−, low claudin expression | TNBC-like | Poor; stem-cell features |
Clinical Groupings (Simplified)
| Clinical Group | Prevalence | Defining Feature |
|---|---|---|
| Luminal (ER+/HER2−) | ~70% | Hormone receptor-driven; tamoxifen/aromatase inhibitor responsive |
| HER2-positive | ~15% | HER2 amplification; trastuzumab, pertuzumab, T-DM1 responsive |
| Triple-Negative (TNBC) | ~15% | ER−/PR−/HER2−; chemotherapy ± immunotherapy (pembrolizumab) |
- ER/PR: IHC; positive if ≥1% of cells stain (Allred score 0-8)
- HER2: IHC scored 0/1+/2+/3+; 3+ = positive; 2+ = equivocal → confirm with FISH/CISH (HER2/CEP17 ratio ≥2.0 = amplified)
- Ki-67: Proliferation marker; <10% = low, 10-20% = borderline, >20% = high
- HER2-low (IHC 1+ or 2+ without amplification): emerging subgroup responsive to trastuzumab deruxtecan (T-DXd)
5. Anatomic Staging - AJCC 8th Edition TNM
T - Primary Tumor
| Stage | Description |
|---|---|
| Tis | In situ (DCIS only; LCIS excluded) |
| T1 | ≤20 mm |
| - T1mi | ≤1 mm (microinvasion) |
| - T1a | >1 mm to ≤5 mm |
| - T1b | >5 mm to ≤10 mm |
| - T1c | >10 mm to ≤20 mm |
| T2 | >20 mm to ≤50 mm |
| T3 | >50 mm |
| T4 | Any size, extends to chest wall/skin |
| - T4d | Inflammatory breast cancer (IBC) - ≥1/3 of skin involved |
N - Regional Lymph Nodes
| Stage | Description |
|---|---|
| cN0/pN0 | No lymph node metastases |
| pN1mi | Micrometastases >0.2 mm but ≤2.0 mm, or >200 cells |
| cN1/pN1 | 1-3 ipsilateral mobile axillary nodes |
| cN2 | Fixed/matted axillary nodes |
| cN3 | Infraclavicular, internal mammary + axillary, or supraclavicular nodes |
M - Distant Metastasis
| Stage | Description |
|---|---|
| M0 | No distant metastasis |
| M1 | Distant metastasis (bone, liver, lung, brain most common) |
Anatomic Stage Groups
| Stage | T | N | M |
|---|---|---|---|
| 0 | Tis | N0 | M0 |
| I | T1 | N0 | M0 |
| IIA | T0-1 | N1 | M0; or T2 N0 M0 |
| IIB | T2 | N1 | M0; or T3 N0 M0 |
| IIIA | T0-3 | N2 | M0; or T3 N1 M0 |
| IIIB | T4 | N0-2 | M0 |
| IIIC | Any T | N3 | M0 |
| IV | Any T | Any N | M1 |
AJCC 8th Edition update: Now integrates pathologic prognostic staging - incorporates tumor grade, ER/PR/HER2 status alongside anatomic TNM, making it the first breast cancer staging system to include non-anatomic factors.
6. Special Biological Categories
Inflammatory Breast Cancer (IBC)
- Rapid onset erythema, edema, peau d'orange of ≥1/3 of breast skin
- Classified T4d regardless of tumor size
- Most aggressive clinical presentation; typically ER−, high-grade
Hereditary Breast Cancer
- BRCA1 mutations: Chr 17q21; associated with TNBC/basal-like phenotype; also ovarian CA
- BRCA2 mutations: Chr 13q12.3; associated with luminal-type; also male breast CA, pancreatic, prostate CA
- BRCA1/2 account for 80-90% of single-gene familial breast cancers and 3-6% of all breast cancers
- BRCA1/2 carriers eligible for PARP inhibitors (olaparib, talazoparib)
7. Breast Cancer Evolution Pathways
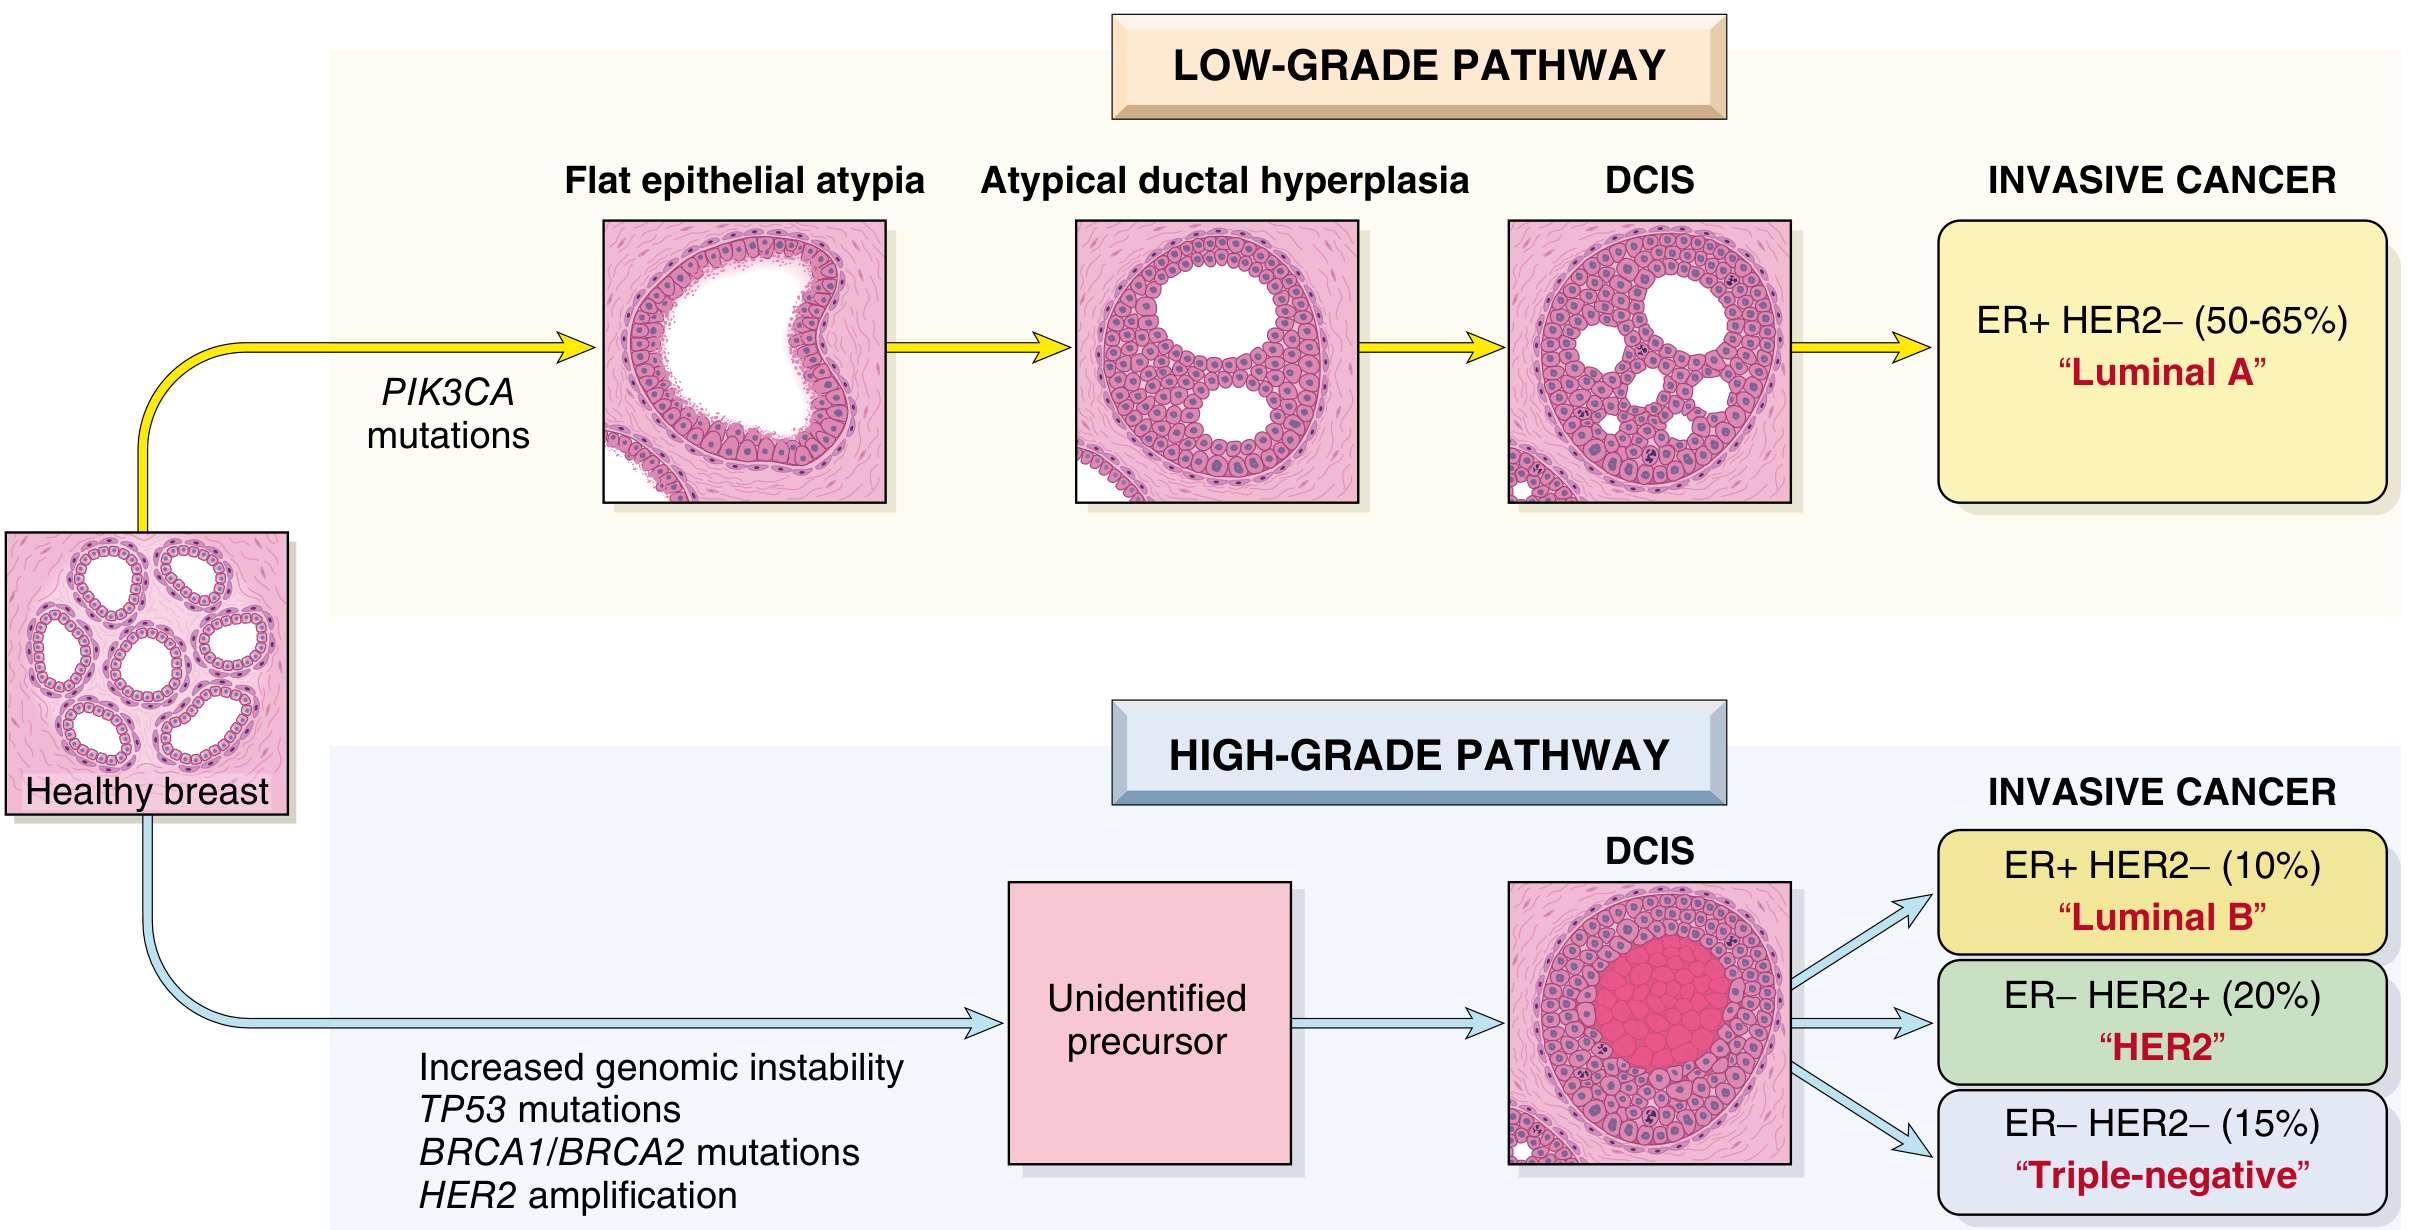
- Low-grade pathway: Almost always ER+/HER2− (Luminal A); evolves through flat epithelial atypia → atypical hyperplasia → low-grade DCIS → invasive carcinoma
- High-grade pathway: More complex; produces Luminal B, HER2-enriched, or TNBC; greater genomic instability, frequent TP53 mutations, HER2 amplification, BRCA1/2 deficiency
Summary Comparison of Molecular Subtypes
| Feature | Luminal A | Luminal B | HER2-enriched | TNBC |
|---|---|---|---|---|
| Prevalence | ~38% | ~37% | ~13% | ~13% |
| ER/PR | +/+ | +/+/− | −/− | −/− |
| HER2 | − | −/+ | + | − |
| Ki-67 | Low | High | High | High |
| Grade | 1-2 | 2-3 | 3 | 3 |
| Prognosis | Best | Intermediate | Poor → improved | Worst |
| Primary Rx | Endocrine | Endocrine ± chemo | Anti-HER2 + chemo | Chemo ± immunotherapy |